Congratulations, College Grads. Now Pay Up.

It’s that time of year when young men and women step outside into the big, real world and realise just how much money they owe to various creditors. Yay. The problem, however, has continued to get worse for students. This interactive infographic by the New York Times explains just how so by comparing student debt to costs.
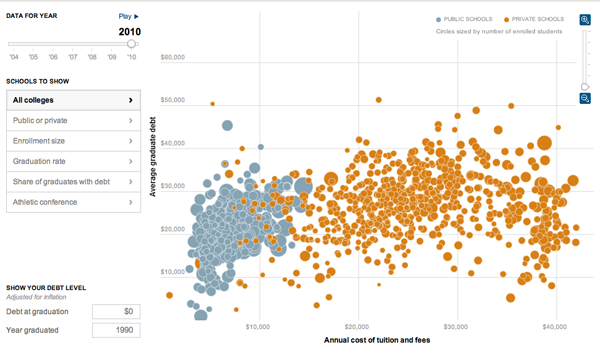
The overall view of indebtedness

While the bubble chart is also available in map form—though I don’t find that particularly useful myself—the more interesting added layer of complexity comes from the data displayed when the user selects a specific university.
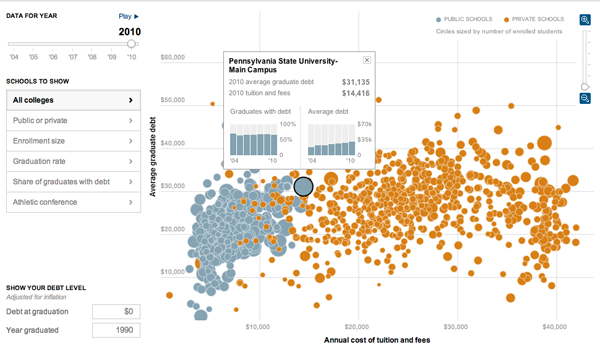
Debt at Penn State, which I attended for all of two semesters

Credit for the piece goes to Jeremy White, Andrew Martin, Andrew W. Lehren, and Archie Tse.

School Segregation in New York

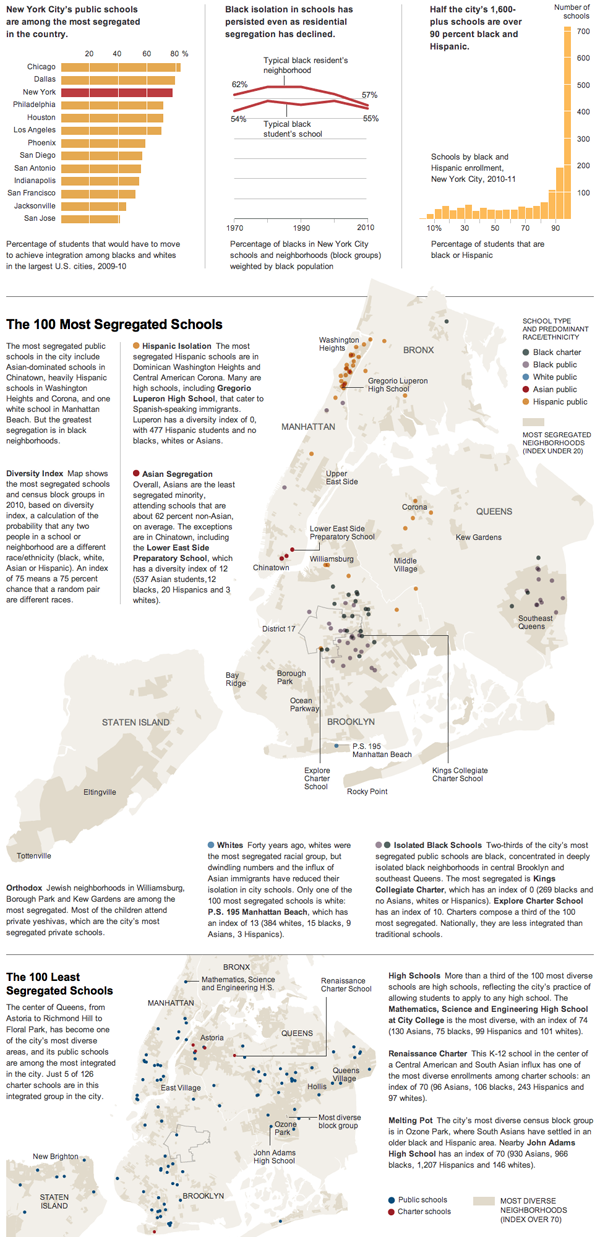
This weekend the New York Times looked at segregation in New York City schools by mapping the least (and most) diverse and offering quick comparisons to other large cities. (Is it really a surprise that the country’s largest cities also would need the largest demographic shifts to create diverse education environments?) Probably the best thing, seemingly as always, in the piece is the annotations that provide stories and context and explain the outliers that are all otherwise visualised in the infographic.

School segregation in New York

Credit for the piece goes to Ford Fessenden.