Boston’s 2013 Season

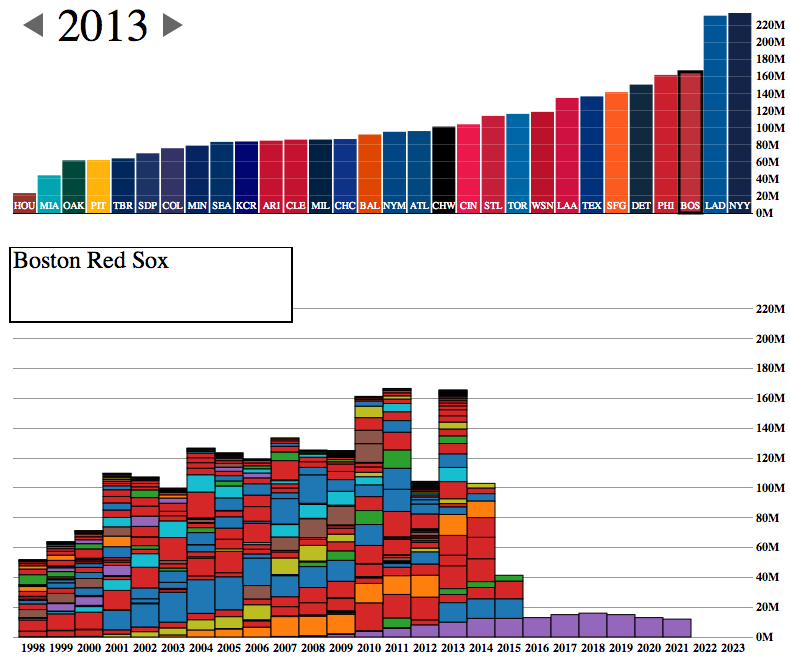
If you’re not a Boston Red Sox fan, what’s wrong with you? Well, okay, so long as you’re not a Yankees fan, you’re not that bad. Anyway, the Boston Globe looked at the 2013 Red Sox season. Game by game, inning by inning. And because Boston is now advancing to the American League Championship Series, and since they will probably face Detroit, here’s a screenshot of the great game that was Scherzer vs. Lester.

Red Sox 2013 season review

Credit for the piece goes to Chiqui Esteban.

The Republicans Who Support a Clean Budget Resolution

Yesterday, we looked at the new Conservative Party of America. But those are the votes that John Boehner fears to upset—and possibly fracture his party and cost him his job—if he should let a clean budget resolution come to the floor and should it pass. But why would it pass if it needs 217 votes and there are only 200 Democrats? Well, now we have a nice interactive graphic from the Washington Post that explores the moderate Republicans. Which, if this count is accurate, would provide enough votes when combined with Democrats to pass a clean budget.

The moderate Republicans…

Why are these Republicans in favour of a clean budget resolution? The y-axis shows that they are in moderate or mixed congressional districts, i.e. not Conservative districts. The x-axis shows that a fair number of these moderates have a high proportion of federal workers within their respective district. And who’s not working/earning money during the shutdown? Yep, a lot of federal workers.

Credit for the piece goes to Aaron Blake, Dan Keating, Ted Mellnik, and Darla Cameron.

The Conservative Party of America

We enter our second week of the government shutdown. Of course, blame for the shutdown falls largely upon a small number of conservative Republican members of the House, bolstered by Senator Cruz (R-TX) and his allies in the Senate. But we already know that there are a number of moderate Republicans who want to pass a clean budget resolution. So one way of looking at this new conservative faction is as a new minor party in a coalition government with Ted Cruz as Party Leader.

The idea is not mine. Ryan Lizza first wrote about the “Suicide Caucus”, a topic that Philip Bump expanded upon several days later. However, as a thought experiment, I was curious to see what would happen if this third party, a Conservative Party, would look in data visualisation terms. So here’s a quick stab at America’s newest third party.

The Conservative Party of America

The Wars of Tom Clancy’s Universe(s)

Tom Clancy died this week. Among other novels, he authored the Hunt for Red October, Clear and Present Danger, and Patriot Games—those three were made into movies. So you may very well have heard of the man. Over at Business Insider, they mapped out the Clancy world by colouring those countries against which the United States has gone to war.

The Clancy Wars
The Clancy Wars

Credit for the piece goes to Walter Hickey.

Paying Federal Employees

The Washington Post put together this infographic looking at paydays for federal employees who will still be working during the shutdown, e.g. military service personnel. Of course, if the shutdown drags on, the paychecks for those still working would be delayed.

Paying essential personnel

Credit for the piece goes to Lisa Rein and Todd Lindeman.

The US Government Shuts Down

So the House Republicans’ Tea Party wing added several different non-budget riders centred around the Affordable Care Act (which they have labelled Obamacare) to the budget. And then the whole House Republican caucus passed it despite threats of immediate vetoes from both the Democratic Senate and the White House. The House Republicans have shut down the US government because of their refusal to remove non-budget legislation from the budget. This after the Affordable Care Act was deemed to be constitutional. After 42 separate votes on scrapping it. After the 2012 elections where the Democrats, who ran on keeping the Affordable Care Act, won more votes than Republicans, who ran on scrapping it. But, it gets even more zany than that as this fantastic infographic shows the pinball-like refusal of the Tea Party to remove the Affordable Care Act knowing well in advance that the Senate Democrats were not going to allow the rider.

The back and forth
The back and forth

Credit for the piece goes to Karen Yourish and Archie Tse.

Funding the Improbable

This interactive map from the Washington Post is one part of a long-form piece that looks at NASA and the improbable tasks facing the agency. Specifically the piece looks at how NASA wants to get to Mars, but how difficult that is and how an also difficult asteroid mission is as a backup plan.

Funding the improbable

Really fantastic is about all I can say.

Credit for the piece goes to Joel Achenbach, Alberto Cuadra, Kennedy Elliott, Rebecca Rolfe, and Ricky Carioti.

How Cruise Missiles Would Strike Syria

While we are waiting for Russian help to destroy Syrian stockpiles of chemical weapons, we know that the Pentagon is still ready to strike (most likely with cruise missiles) various targets of the Syrian regime. This graphic from the Wall Street Journal explores some of the options. The interesting bit is the range of Syria’s anti-ship missiles. Because for those of you who do not recall the Israel–Lebanon war of 2006, Hezbollah (known to be aiding the Syrian regime) surprised some by scoring a hit on an Israeli warship with a less-advanced missile than in the Syrian arsenal.

Pentagon plans
Pentagon plans

This is only one of several different graphics from that page. Different graphics look at elements of the conflict, including the refugees, timeline of the regime’s actions, &c.

Credit for the piece goes to the Wall Street Journal graphics department.

Paying a Bribe

Some say bribes grease the wheels of business. But if that is the case, where are the greasiest wheels? This interactive piece from the BBC showcases an interesting story. It maps who has paid bribes and the value thereof. Then it looks at corruption in the different sectors of the country and which is perceived to be the most corrupt.

A look at bribery
A look at bribery

Aesthetically this is not the finest piece. Some of the most interesting countries to view are in Africa and Southeast Asia, i.e. geographies near the equator. Unfortunately the designers here chose a map projection that emphasises Siberia and Arctic Canada at the expense of those very countries. Also, where did Greenland go? I know that the ice is melting, but I don’t think it’s melted that quickly. Furthermore, if the user clicks the “List” option, he or she is presented only with a list of geographies. None of them are selectable nor do they encode data. So why is the list there?

In short, the interface is a bit clunky and strangely designed. Line lengths are too long and it looks ugly. But, there are two interesting things going on here worth noting. First the legend here actually does not just show the range for the choropleth, but it also encodes the number of countries that fall within that range.  

Second, by clicking on a particular bin for the legend, the map filters for the selection. I think that from a design perspective, a lighter grey and a lighter stroke outline would have made the filtering a bit more prominent, but the idea is interesting. Unfortunately, I found no way of easily returning to an all-bin view of the map.

A piece for the BBC that misses a few, but also hits a few.

Credit for the piece goes to the BBC graphics team.

Foreclosing on Homes in Washington, DC

Today’s post comes from the Washington Post. It is a single interactive graphic, a map, that supports a long-form article about foreclosures in Washington.

DC foreclosure map
DC foreclosure map

Credit for the piece’s graphics goes to Ted Mellnik, Emily Chow, and Laura Stanton.