Taxes

Let’s face it, governments need money to function. If you want a large military, you have to fund it. If you want pension system, you have to fund it. If you want medical care for the old, the sick, and the poor, you have to fund it. If you want to give everyone unicorns made of rainbow beams, you have to fund it. And…well…nevermind.

The point is taxes. After an election that focused so heavily on them, we’re still debating them. But here are some facts about them from the New York Times. The designers, Mike Bostock, Matthew Ericson, and Robert Gebeloff used small multiples of line charts—and lots of them—to look at who pays taxes by income band and how they pay different types of taxes. I found particularly interesting the points made near the bottom of the piece about how the progressive tax system is increasingly less so.
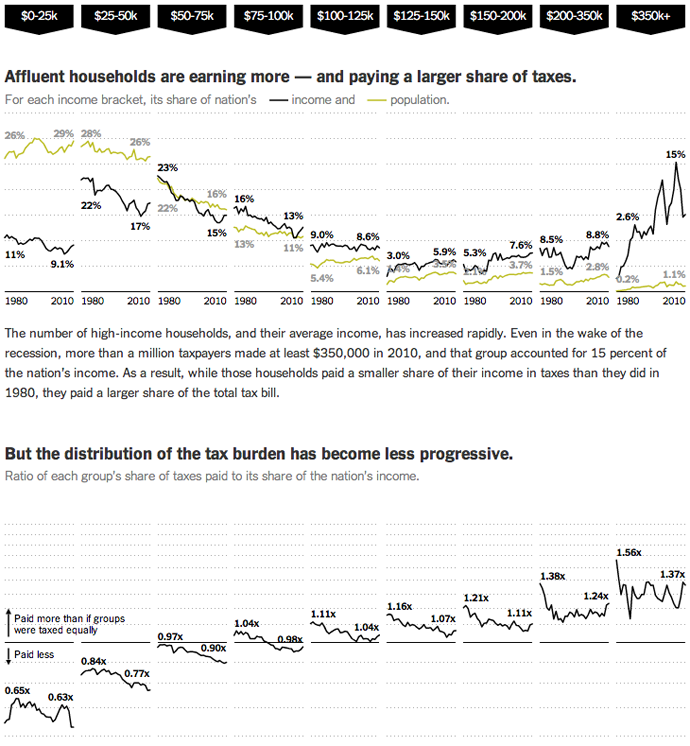
How the American tax system is becoming less progressive

But how do these taxes compare to spending? In a separate graphic for the same article, a stacked bar chart compares revenue to expenditure. With the exception of the balanced budget during President Clinton’s administration, we have been outspending our revenue since 1980. While statements to the effect of the US national budget needs to be managed like a US household budget are both overly simplistic and naive, there is a truth in a long-term mismatch between revenue and expenditure might cause problems. That is why many see the deficit and our debt as a medium-term problem facing the United States.
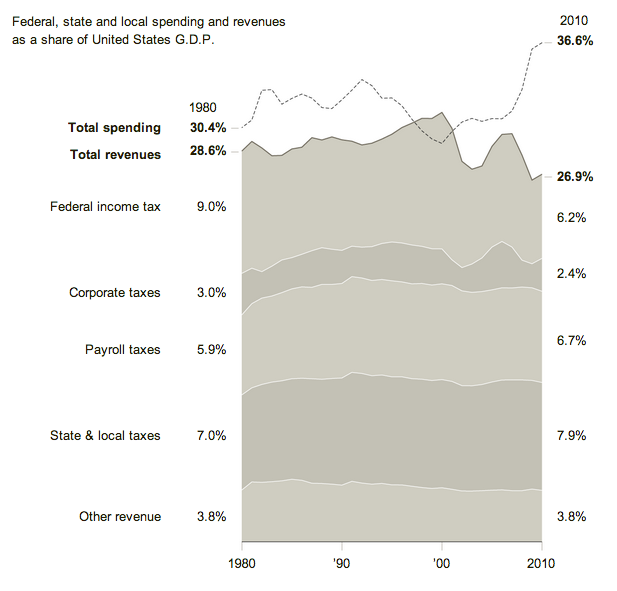
Spending versus revenue

Credit for the first piece goes to Mike Bostock, Matthew Ericson, and Robert Gebeloff.

The Paths to 270

There is one day to go until the presidential of 2012. But despite what many say and a fewer number want, the United States is not a democracy. It was never meant to be. Instead it is a democratic republic. We elect people who make decisions for us. Perhaps one of the most misunderstood ways in which this happens is through the election for the president.

The popular vote does not matter. If the popular vote did matter, Al Gore would have been elected president in 2000, not George Bush. Instead, your state’s electors matter because they belong to something called the electoral college. Different states have different numbers of electors (loosely based on their political representation in Congress). Given which states are certain to vote for President Obama (Illinois) and Governor Romney (Georgia), there are only a few states that are available for either to win (Ohio).

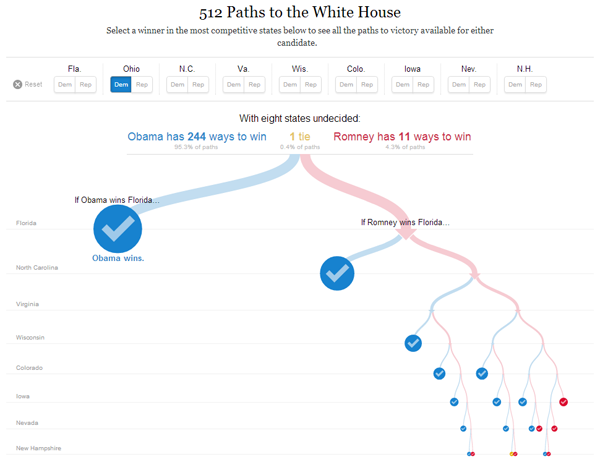
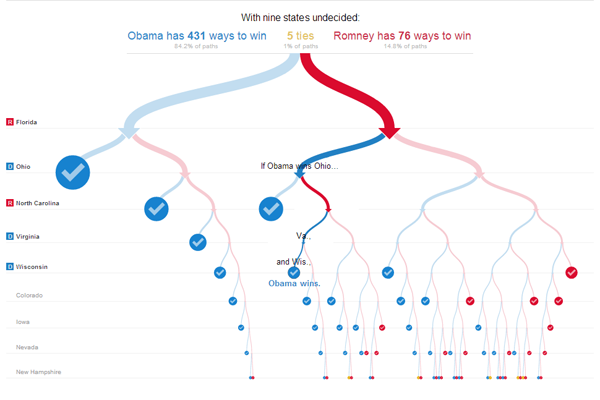
Different combinations of states can be had to reach 270 electoral college votes, which is the number necessary to become president. While Governor Romney might be able to make 50.1% of the national vote, as this interactive piece from the New York Times shows, his path to 270 votes is very narrow and he cannot stray too far and still hope to win. And it is because of this fact (generally speaking) that many, e.g. Nate Silver of the New York Times, are saying that a re-election of President Obama is far more likely than a Governor Romney victory.

There are two ways to really play with it. First, select different states and see how many different routes are left open to Governor Romney. The second is to leave the selections blank and then follow the flow chart given by the New York Times.

Play with the Toggles Until You Get a Winner
Follow the Red Road for Romney

Credit for the piece goes to Mike Bostock and Shan Carter.

Playing in the Swing States

The 2012 elections are now less than two weeks away and so let the sporting analogies begin. We’re in the home stretch now. Homeruns, field goals, and running out the clock. Et cetera et cetera ad nauseam.

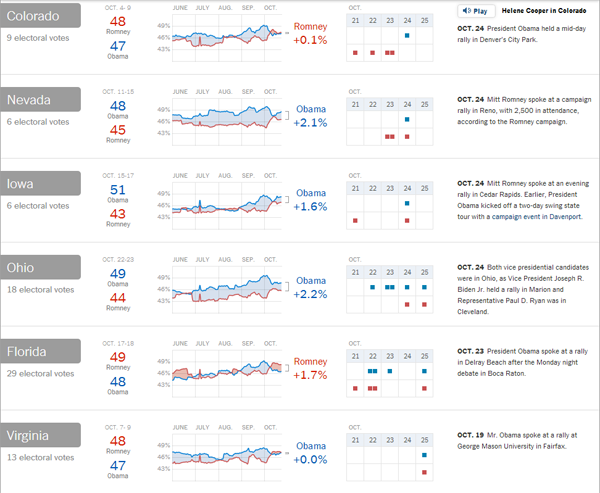
But over at the New York Times we have an interactive piece that looks at what they call the state of play of the swing states in terms of the latest tracking polls at a state level along with campaign stops and commentary from the paper. It’s a concise way to look at those few states that will largely determine the outcome of the election.

Swing states
Swing states

Show Me Some Swing

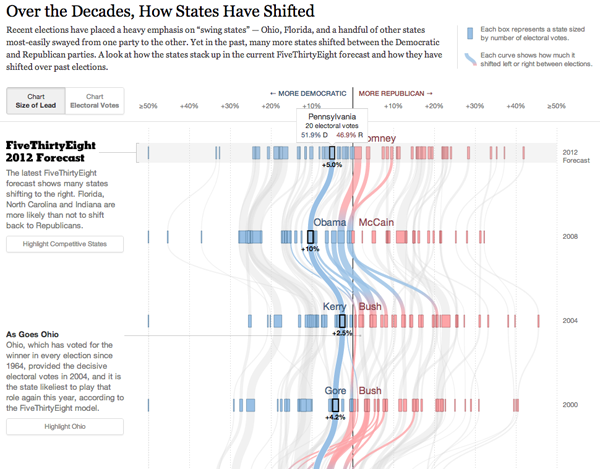
Problems with my access to the tubes of the internets prevented me from posting this piece last week. But it’s still good and still relevant, especially in the wake of last night’s presidential debate. The New York Times and the FiveThirtyEight forecast came together to create this interactive flow chart, if you will, of the ebb and flow of electoral politics.

Show Me Some Swing
Show Me Some Swing

Two different views, one based on electoral votes and the other on the margin of victory, determine the basic chart type. But both let you watch swings states vacillate between Republican and Democratic support. Context is provided to the side of the main graphic to explain just what was going on in particular elections.

Credit for the piece goes to Mike Bostock, Shan Carter, and Amanda Cox.

The Red Sox Were Truly Awful in 2012

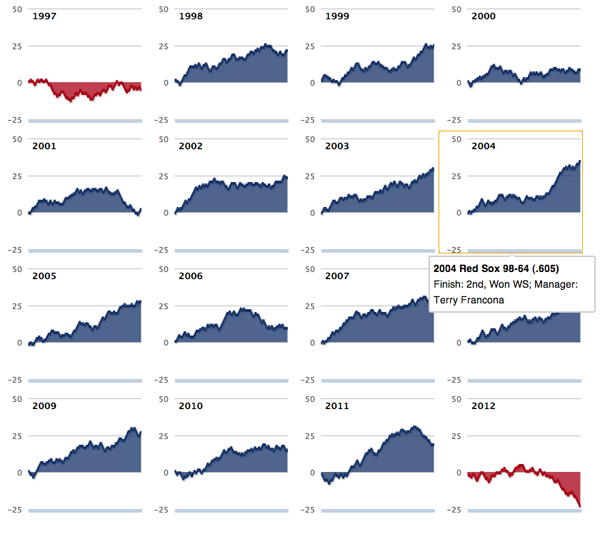
The Boston Red Sox hired John Farrell this weekend to be their manager just one season after hiring Bobby Valentine for the role. There is a lot to be said about just who is to blame about the Red Sox’ awful season. But it was pretty awful. How awful? The Boston Globe shows us in this interactive piece.

It’s a series of small multiples of line charts. However, one of the big problems with the infographic is that the labels are entirely absent. As best I can tell the line is the number of games over .500, i.e. an even split between wins and losses. But, it could be more clearly called out if not in the legend or on the axes than in the title.

But over all it does put this past season into a sober perspective.

How Bad is Bad? Awful, it Turns Out.

Credit for the piece goes to Daigo Fujiwara.

Absentee Ballots

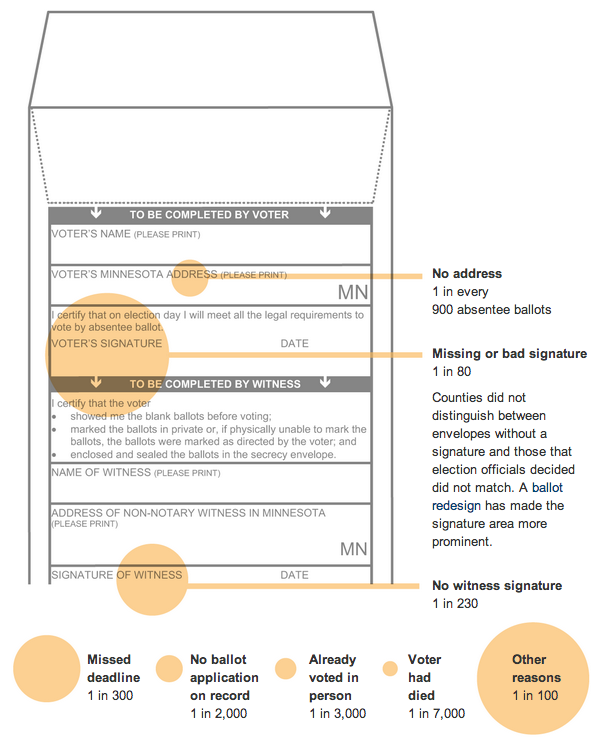
This graphic comes from a set by the New York Times that looks at absentee and mail-in ballots, which are particularly popular in western states. The representation of the absentee ballot from Minnesota in 2008 is then examined to see which areas were the reasons for discounted ballots.

Minnesota's 2008 ballot

Follow the directions to the best of your abilities, people. Make your vote count.

The Drop in the Unemployment Rate and How to Spin It

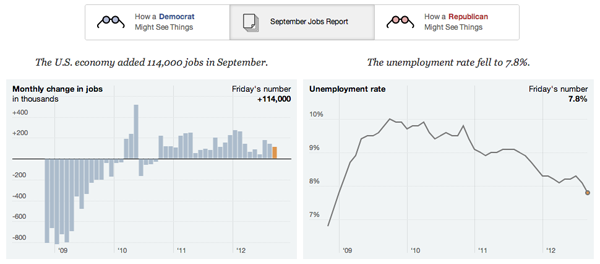
On Friday we received the monthly jobs report. And the furore that arose with it. Principally the anger stemmed from right-leaning commentators who believed that the non-partisan Bureau of Labor Statistics, a government agency tasked with collecting data on employment among other metrics, “cooked the books”/ “massaged the figures”/ flat-out lied to show a significant drop in the unemployment rate that could not be attributed to people who had stopped looking for work—a cause of some earlier drops over the last few years. As someone who works with data originally collected from national statistics offices across the world on a daily basis, those claims touched a nerve. But I shall leave that rant for another time.

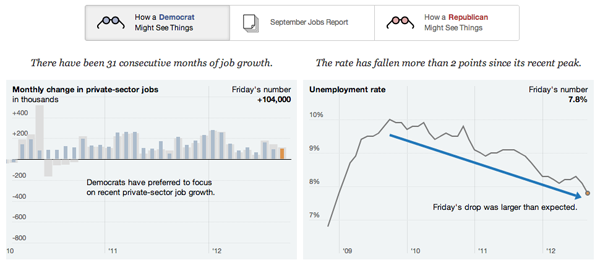
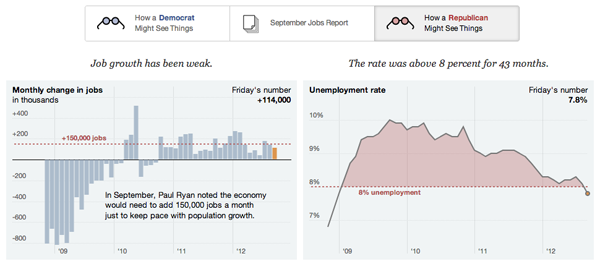
Instead let’s look at the New York Times piece that quickly followed on the outrage of fools. We can look at and analyse the data in different ways—the origin of the phrase lies, damned lies, and statistics—and surely the Republican and Democratic parties would do just that. They did. This New York Times piece shows how that can be—and was—done. It involves points of reference and context.

First the facts:

The Facts
The Facts

Then how the Democrats spin them:

Spin it from the left…

Finally how the Republicans spin them:

Then spin it from the right.

But the facts themselves do not lie. 114,000 non-farm jobs were added to payrolls. The unemployment rate fell to 7.8%, the lowest rate since January 2009.

Credit for the piece goes to Mike Bostock, Shan Carter, Amanda Cox and Kevin Quealy.

The Hispanic Vote

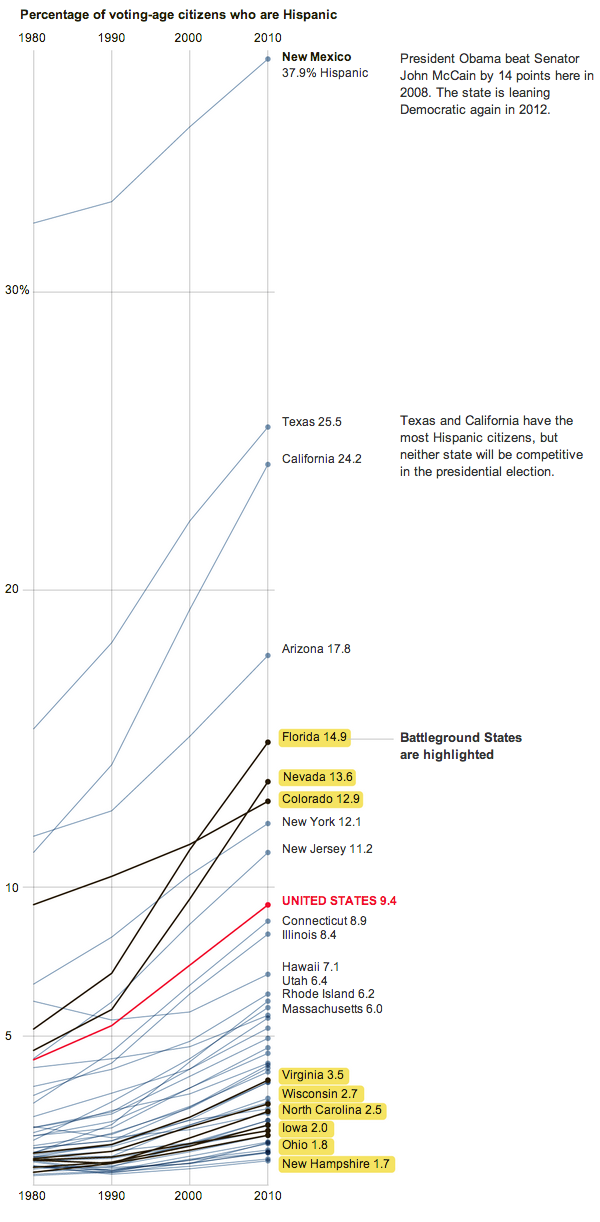
People make a great deal about the Hispanic vote and how it will affect the election. In every election I can recall. Granted, that’s only  a few presidential elections and a couple more Congressional mid-terms. But the problem is that Hispanics do not vote. In scientific-ish terms, the Hispanic vote is wasted potential energy—they could make quite the impact, particularly in the south and southwest, arguably too in the larger cities. But to look at where to focus energies at higher efficiencies, i.e. turnout, the New York Times has this graphic looking at the potential for Hispanic votes.

Hispanic Voters
Hispanic Voters

Credit for the piece goes to Kevin Quealy.

This Infographic Is Da Bomb

For your Friday comic relief comes the infographic of the week.

The content is serious. But the graphic is laughable at best. And undercuts the message in my opinion. Seriously, it’s like the mobile weapons labs, but worse. All over again.

Isn't the bomb already lit? How does the red line stop it from going off?

Photo credit goes to Mario Tama at Getty Images, via the Los Angeles Times.

Average Household Spending

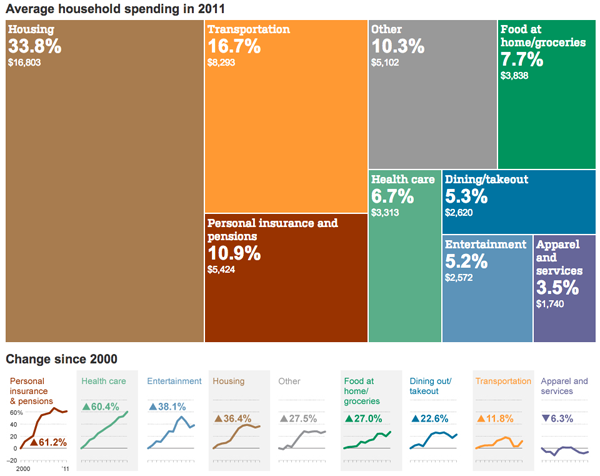
This tree map from the Wall Street Journal looks at an interesting subject: average household spending. How much are we spending on housing, on food, on transportation, &c.?

Household spending
Household spending

But I’m not so sure that the main visualisation is necessary. I appreciate the big colour and splashiness, but the space use seems inefficient. Perhaps if the colours had been tied, as is commonly seen, to another variable, the tree map would be more useful. Imagine if the chart looked at the spending value and the average growth over the last ten years, with the year-by-year value still plotted below.