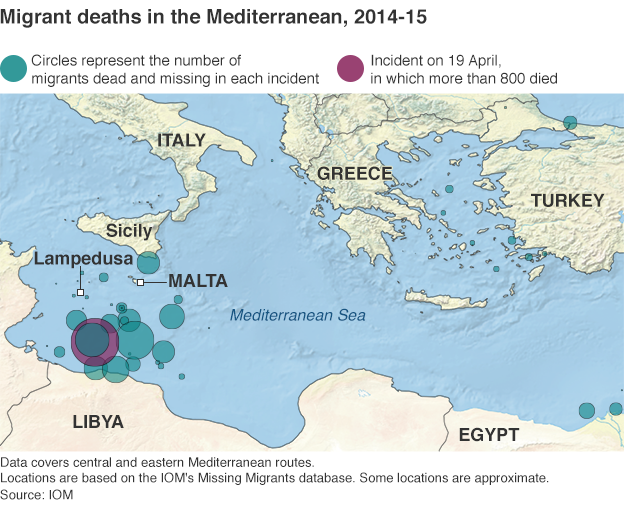
Yesterday we looked at a map of coal plants, with the dots sized by capacity. Today, we have a similar approach in a much smaller graphic about a much different topic. The BBC published this map yesterday in the context of an article about a report of the EU contacting Australia in regards to its migrant interception programme.

Compared to the maps we saw yesterday, I’m not so keen on this. Not the idea, mind you. I think that the story bears telling in a graphical, visual format. Look at how many of those deaths occur in the waters between Libya and Italy. Not between Tunisia and Italy. Not between countries of the eastern Mediterranean and islands like Cyprus or Crete.
But, the blue-green colour used to identify previous incidents is too close to the blue of the Mediterranean for my taste. Though, in fairness, that does make the purplish colour highlighting the most recent incident stand out a bit more. But even the map of the Mediterranean includes details that are not likely necessary. Do we need to show the topography of the surrounding countries? Do we need to see the topography of the sea floor? Probably not, although in a different piece the argument could be made geography determines the migration routes. Compare that to Bloomberg’s piece, where the United States was presented in flat, grey colours that allowed the capacity story to come to the forefront.
Lastly, a pet peeve of mine with maps and charts like this. Please, please, please provide a scale. I understand that humans are poor at comparing differences in area. And that is a reason why bars and dots are so often a clearer form of communication. But, in this piece, I have no idea whatsoever about the magnitude and scale of these incidents. Again, compared this to the Bloomberg piece, where in the bottom corner we do have two circles presented to offer scale of capacity.
Credit for the piece goes to the BBC graphics department.
