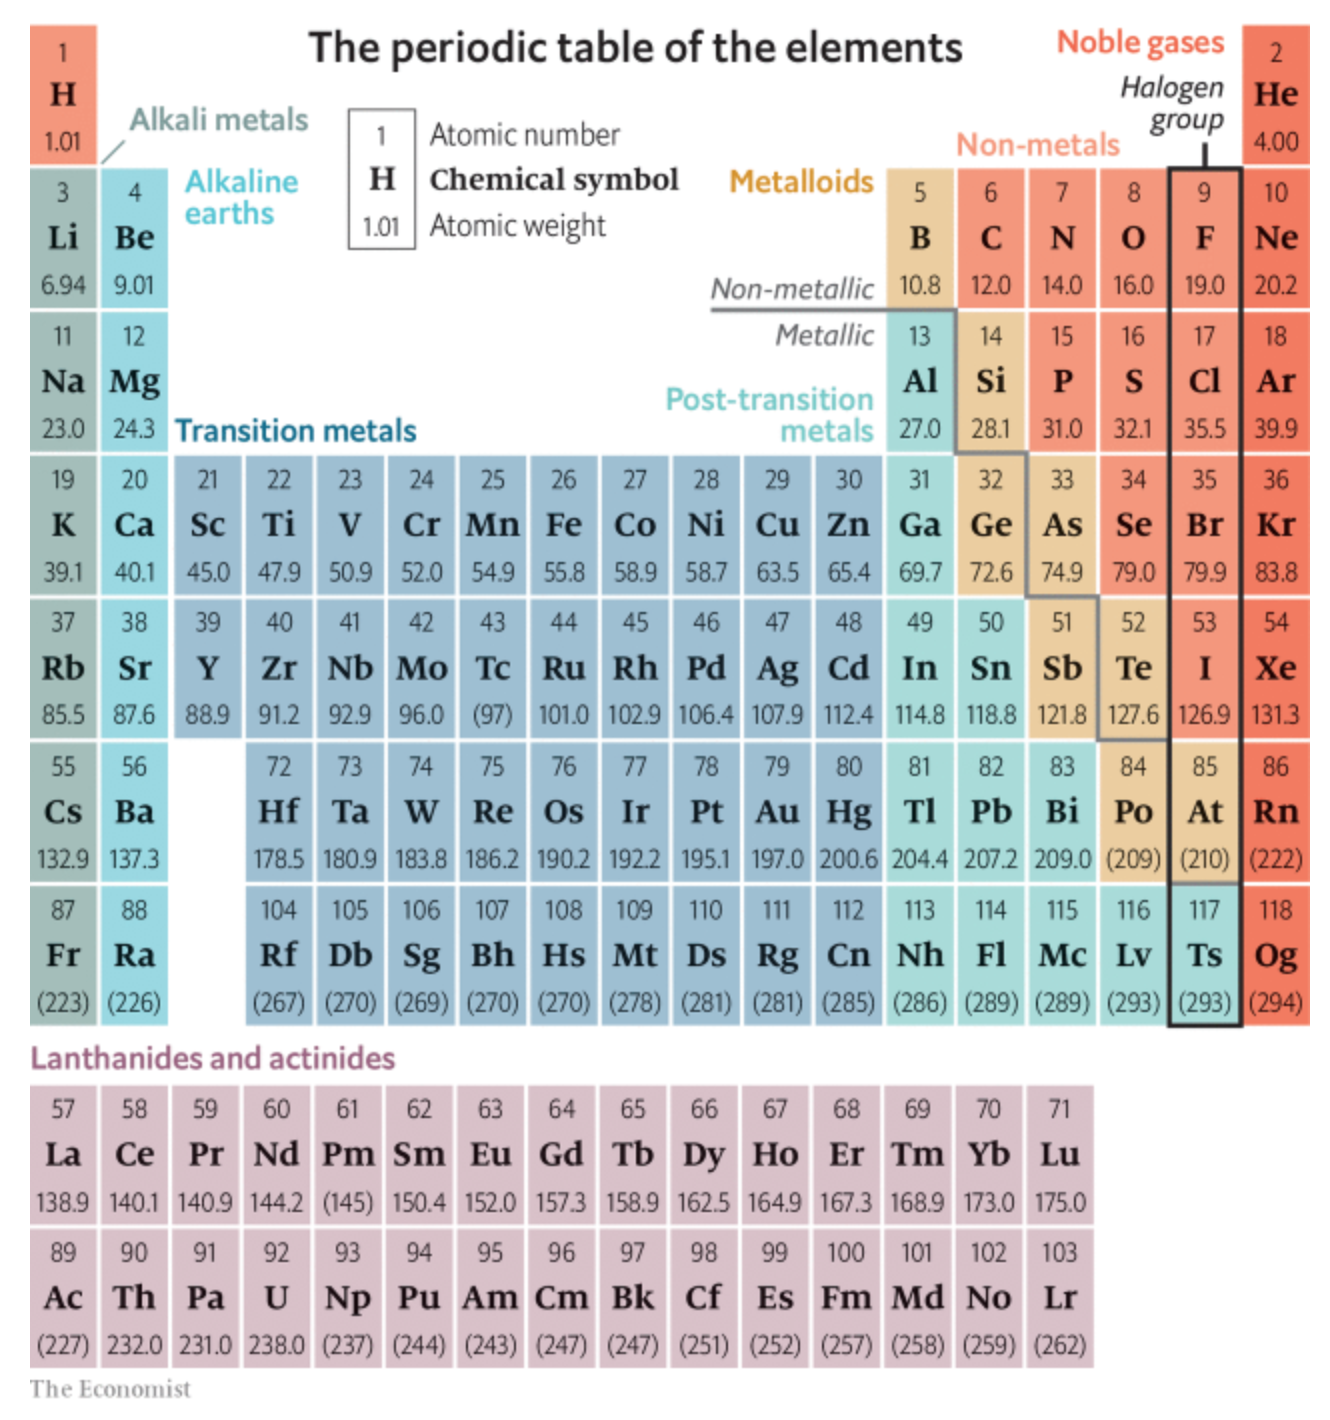
Last week the Economist published a fascinating read that uses one of the fundamental information design pieces there is. The piece talks about the history of organising within the field of chemistry and the most well-known…elements in it: the elements. I am, of course, referring to the Periodic Table.

The piece starts actually in revolutionary France, a history I did not know, and walks through how that led into the eventual development of Mendeleev’s table. It then briefly runs through the history of the concept of the atom and how that evolved to define the refined table we see today. (And in so doing it includes a nice graphic showing the shell model of the atom’s electron orbits.)
I often work in data visualisation—surprising exactly nobody given this blog—and one thing I often say is that while graphics are for showing and storytelling, tables are for organising. The Periodic Table organised information known about atoms both known and unknown, creating holes for future chemists to place their discoveries. It is the chemistry we all know and love—or perhaps hate—today. It is a classic piece of information design.
And the reason why I bring it up? The Economist pointed out that last week it turned 150 years old.
Credit for the piece goes to the Economist graphics department.
