The Summary of the Mueller Report

When Robert Mueller submitted his report a few weeks ago, some interested parties declared it a witch hunt that had wasted time and money. Except, it had done the opposite of that. It had laid bare Russia’s interference in our elections and the contacts between Russian government and quasi-government officials and Trump campaign officials. Said officials then lied about their contacts and, along with other crimes discovered during the course of the investigation, either pleaded guilty or were convicted. And while a few trials are still underway, we also now know 12 other cases have been referred to prosecutors but they remain under wraps.

At the time of submission, the New York Times was able to create this front page graphic.

There's some shady shit going on here.
There’s some shady shit going on here.

It highlighted the key figures in the report’s investigation and identified their current status. Many of those charged, essentially all the Russians, are unlikely to ever stand trial because Russia will not extradite them.

Inside the piece we had two full pages covering the report. The graphics were rather simple, like this, although as these were black and white pages, colouring the photographs was not an option. Instead, the designers simply used headers and titles to separate out the rogues’ gallery.

Not exactly the pages on which you want your name…

This wasn’t a complicated piece, but it made sense as one of the first pieces. For months we had been told the investigation was “wrapping up soon”, or words to that effect. Then, out of nowhere, it finally did. In one day, and crucially without the actual report yet, work like this reminded us that the report had, in fact, achieved its purpose.

Credit for the piece goes to the New York Times graphics department.

The Fire at Notre Dame Cathedral: Part Deux

Yesterday I mentioned how there were few graphics detailing the fire at Notre Dame de Paris. Just give media organisations a day. The BBC published this piece about the fire. It includes, much like the Times piece from yesterday, an illustrative diagram detailing the key locations of the fire.

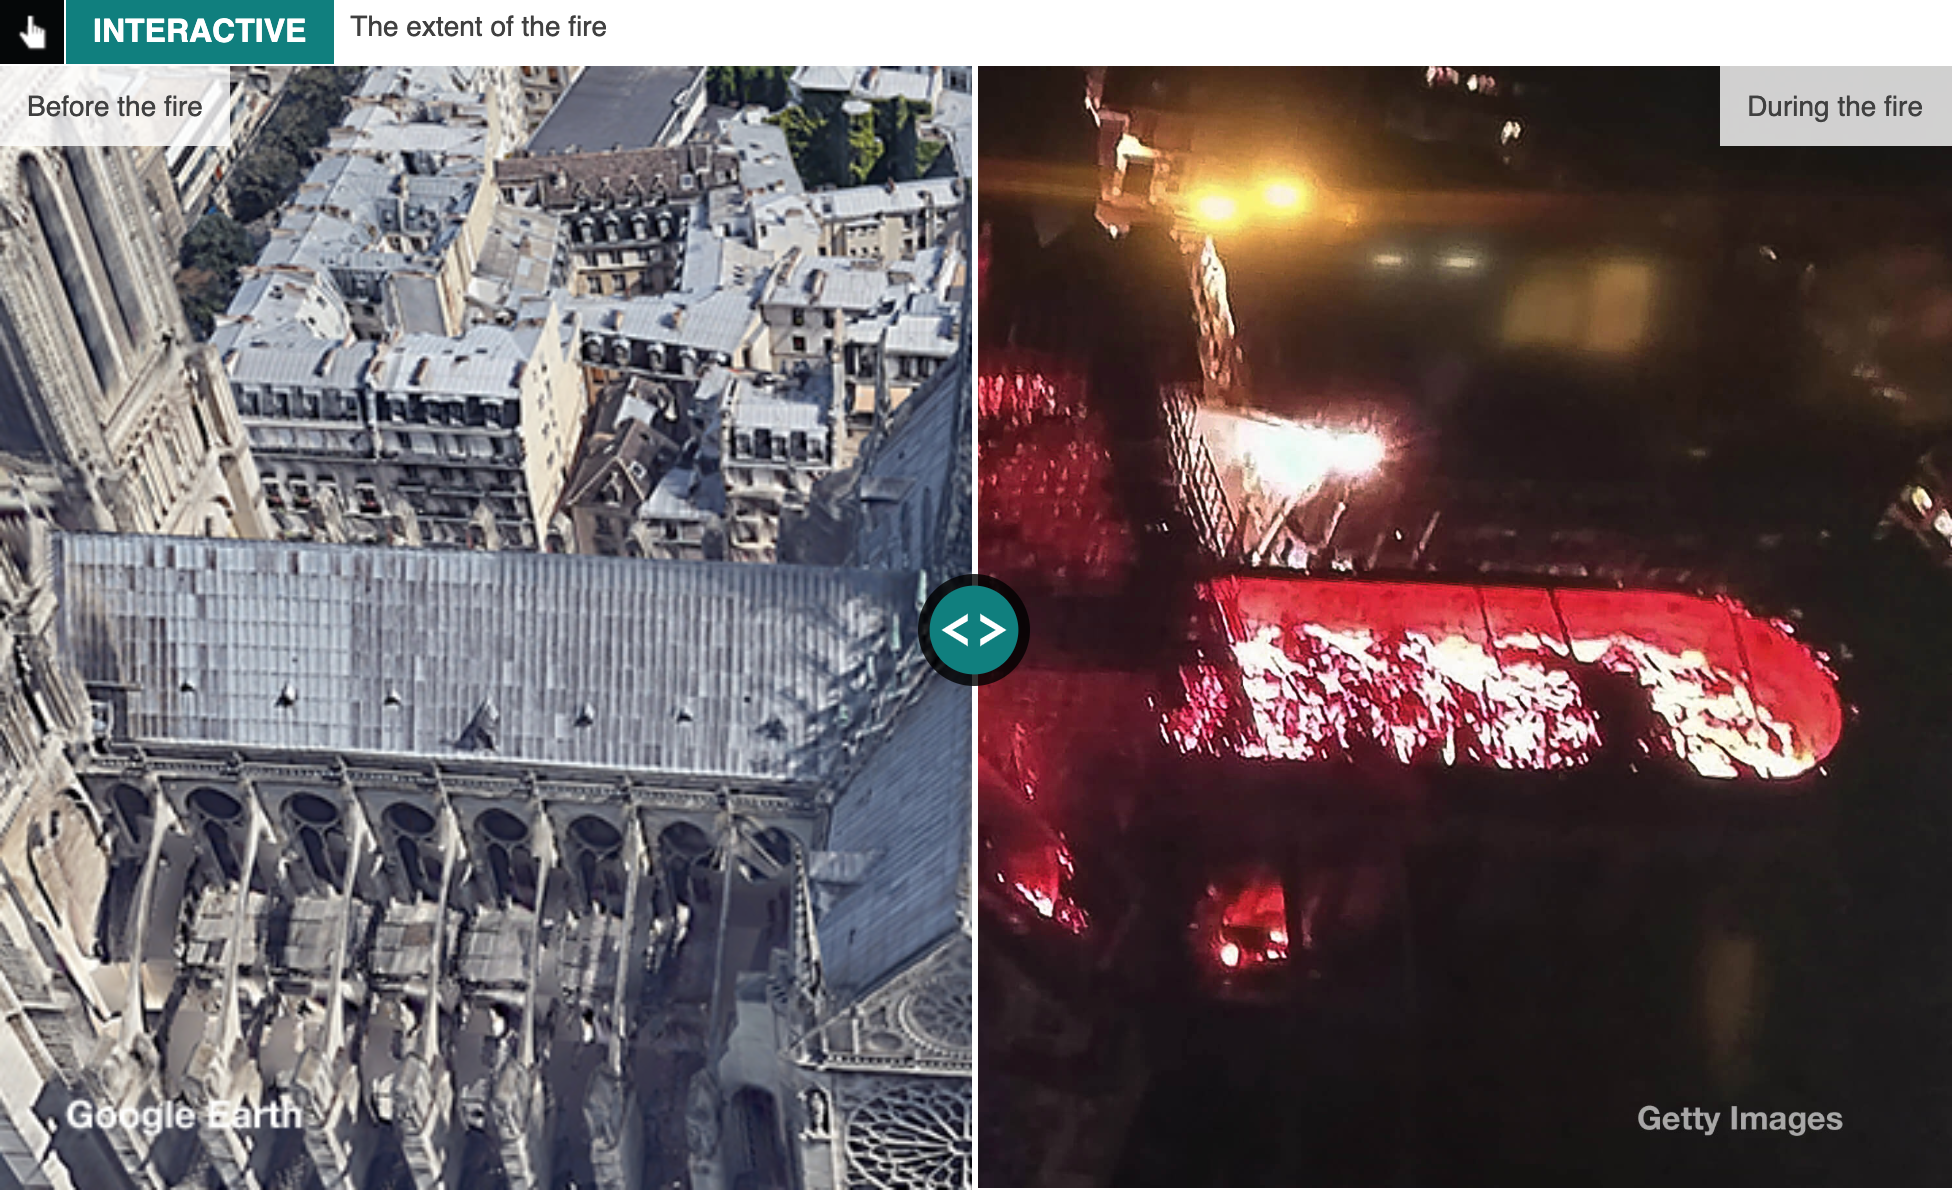
But the BBC piece goes a bit further and includes photo sliders like this.

The roof is on fire
The roof is on fire

It shows the extent of the fire burning away at the roof. (Amazingly, the stone vaulted ceiling below the roof contained most of the fire as the ground floor is nearly intact.)

Another slider looks at the appearance of the cathedral while photographs are annotated to provide immediate context of what the reader is seeing.

Overall, it is a very strong piece.

Credit for the piece goes to the BBC graphics department.

Anak Krakatau

During my winter holiday to London the volcano Anak Krakatau erupted, sending enormous amounts of material sliding into the ocean. The displaced water had to go somewhere and travelled as a tsunami that devastated the Indonesian coastline.

Of course Anak Krakatau is one of several remnants of the much larger volcano of Krakatoa that erupted several times, perhaps most famously in 1883. Anak Krakatau specifically emerged in the late 1920s and has been building ever since until it collapsed almost two weeks ago. But by how much did it collapse?

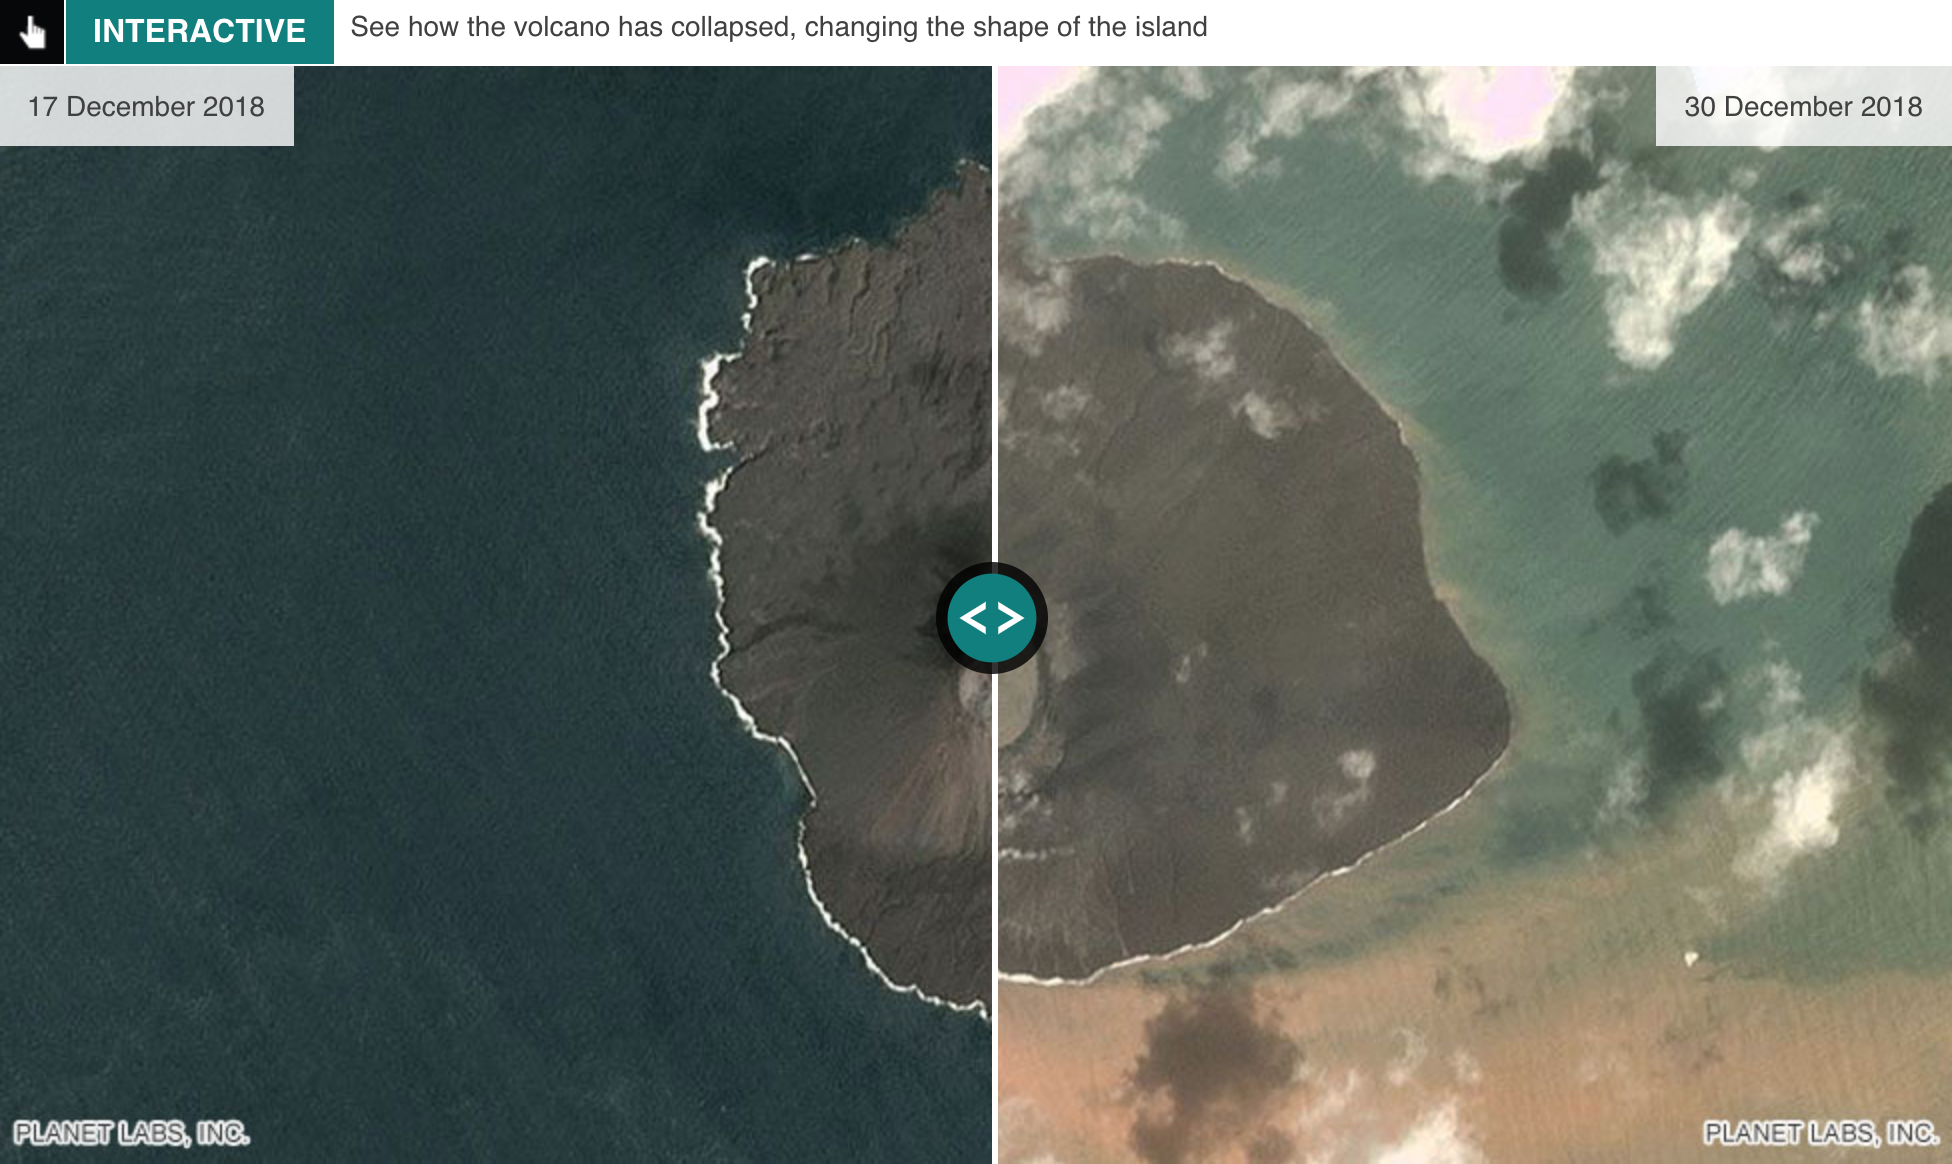
Until just a few days ago, the skies above the volcano have not permitted detailed photography. But within the last day or so we have started to get images and the BBC put together this piece that looks at Anak Krakatau before and after.

Before on the left, after on the right

It is a fairly common convention these days, the slider overtop the two images. But conceptually it shows clearly how the shape of the island has changed, in particular the new bay that has emerged. The other remarkable feature is the extension of land to the presumably east (right) of the image.

Credit for the piece goes to the BBC graphics department.

#MeToo After One Year

One year on and the #meToo movement continues to upend the political, economic, and cultural landscape of the United States. And a few days ago the New York Times published a piece on all the stories they have collected.

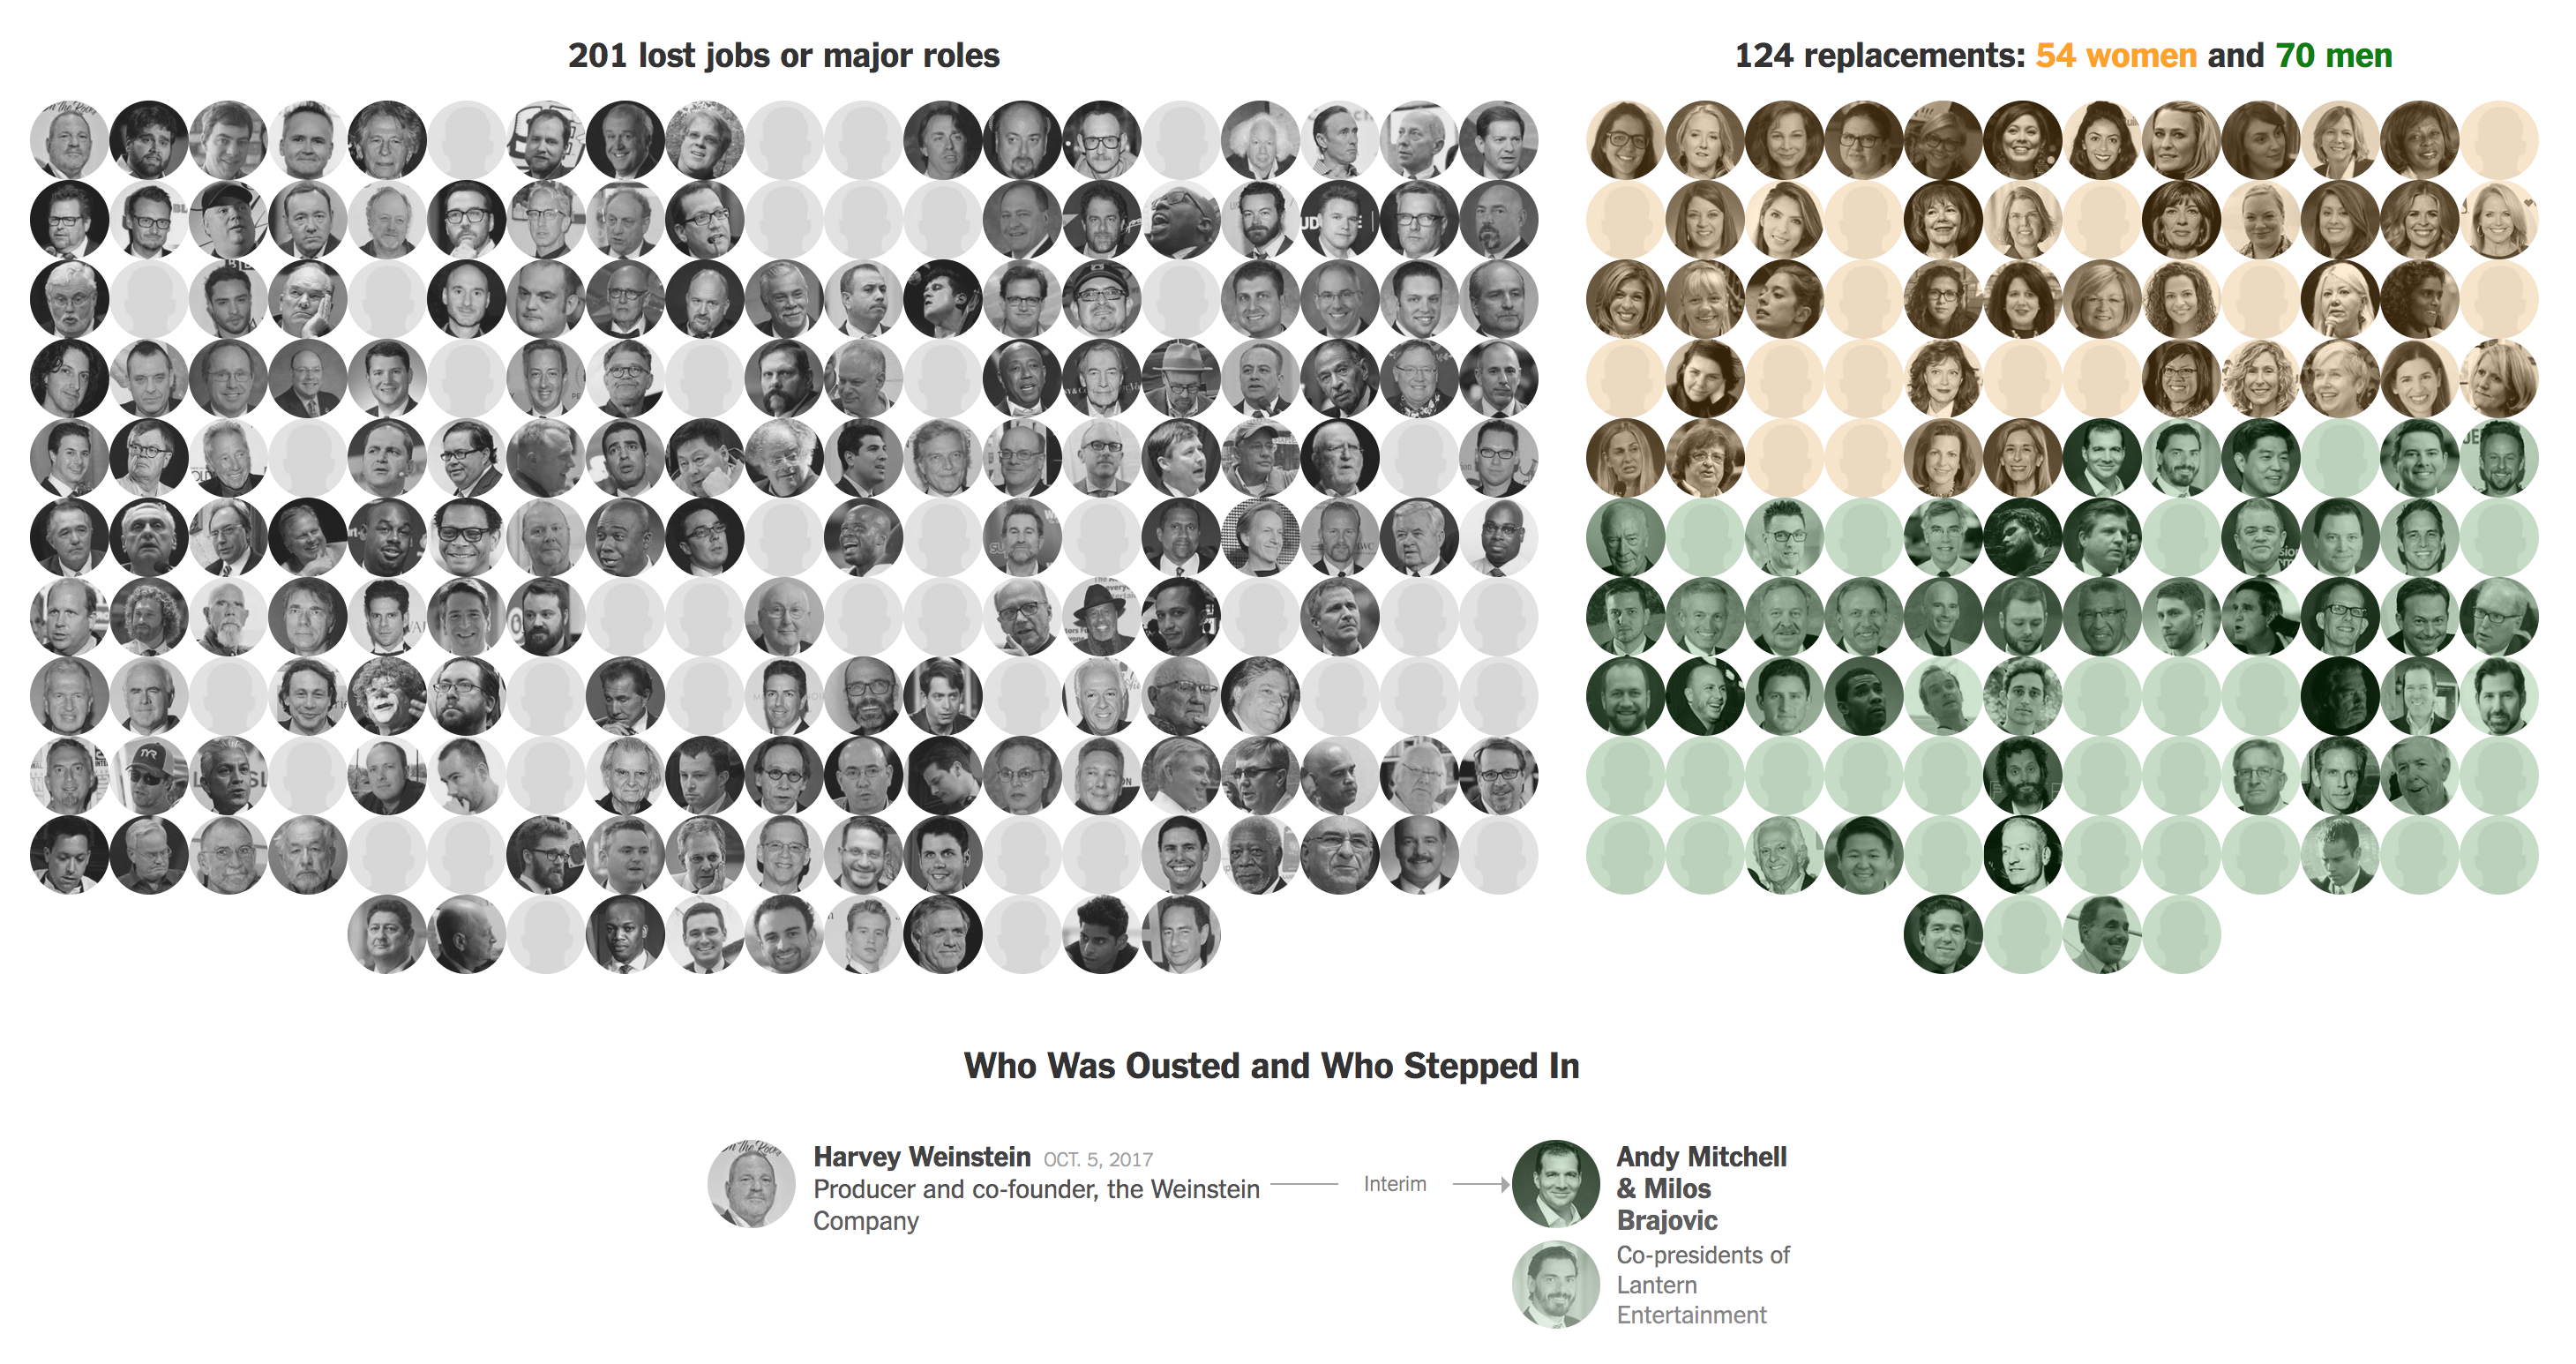
From a data visualisation standpoint, this is a fairly simple piece. It takes 201 men (and a few women) who allegedly committed crimes along with their photo (if available) and then shows who replaced them. The screenshot below is of the total number of faces—notably not all men have been replaced—and then divides those who replaced them by gender.

Naturally it starts with Weinstein at the top…

The bit at the bottom shows how the case studies work. A man is on the left and who replaced him is on the right, both in the interim and more permanently, if applicable. A brief text account of the story falls below the alleged offender. And with 200+ stories, you can scroll for days.

Credit for the piece goes to Audrey Carlsen, Maya Salam, Claire Cain Miller, Denise Lu, Ash Ngu, Jugal K. Patel, and Zach Wichter.

Revealing the Past Through a Heatwave

The United Kingdom has been…well, enjoying is not the right word for me, so let’s just say witnessing a heatwave. And it is having some unexpected consequences. In short, things like grass will behave differently in extreme conditions when planted on soil vs. when growing atop stone, wood, or other non-natural features. This helps identify foundations and alike for long-forgotten structures. The BBC has a nice piece looking at some work just like this discovered across the British Isles.

The house was known about, but the details are still fascinating.

Credit for the piece goes to Paul Hancock and PH Aerial Photograph.

Picking at the Bones

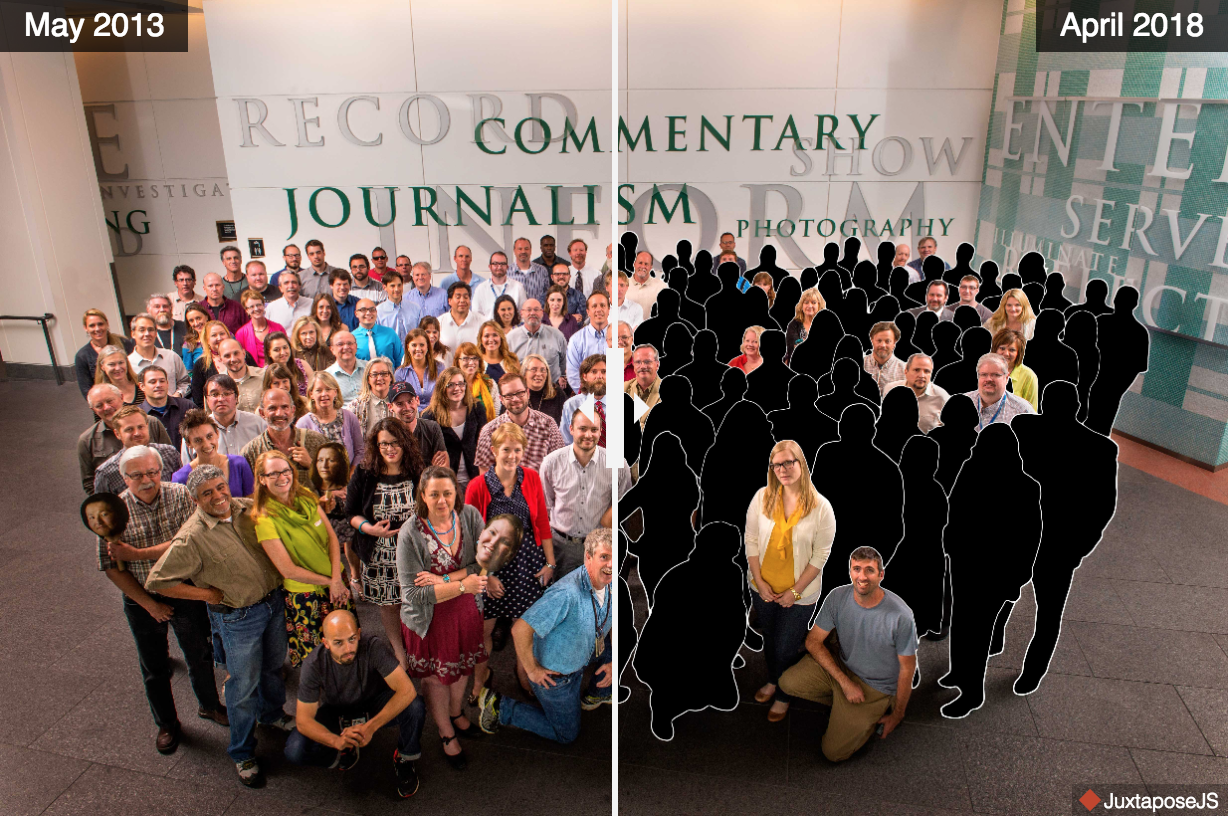
We have all seen the slider that lets you see a pre- and post- or before and after of, usually, the same property, building, landscape, map, &c. Well a few days ago, the Denver Post took the same form and used it to show the before and after of cuts to the staffroom in just five years.

What makes the photo so telling is that in the editorial describing the photo, the paper is successful. But the hedge fund managers of the paper continue to demand cuts to the overhead. And in the journalism environment that often leads to cuts in coverage or quality, and sometimes both. And for the leading—and only large circulation—paper of Denver, that is bad news, pardon the pun, for the community.

Staff before, staff after

What makes the situation worse is that allegedly the cuts are due to poor business investments by the hedge fund, Alden Global Capital, in areas not at all related to the news industry.

Credit for the piece goes to the Denver Post graphics department.

Piece, Larsen C

When I was in high school in 2002, it was big news when one of the three Larsen ice shelves in Antarctica, Larsen B, collapsed. And then when I was at university, the band British Sea Power wrote a song titled “Oh Larsen B” that I have always enjoyed.

Now Larsen B was not the first Larsen ice shelf to collapse. That dubious honour belongs to Larsen A, which collapsed in 1995. But, Larsen B will not be the last as the third, Larsen C, is now on the verge of collapse. This graphic from Adrian Luckman, reproduced by the BBC, illustrates how the rift calving the shelf has seen accelerated growth recently.

The rift's growth has accelerated lately
The rift’s growth has accelerated lately

I believe the colours could have been designed a bit better to show more of the acceleration. The purple fades too far into the background and the yellow stands out too much. I would be curious if the data existed to create a chart showing the acceleration.

The inclusion of the map of Wales works well for showing the scale, especially for British audiences. In other words, an iceberg 1/4 the size of Wales will be released into the Southern Ocean. For those not well versed in British geography, that means an iceberg larger than the size of Delaware. That’s a big iceberg.

Credit for the piece goes to Adrian Luckman.

Beating Ted Williams

Last week the Red Sox’s season came to an end after being swept by the Cleveland Indians and with the sweep so too ended David Ortiz’s career. He is one of the best Red Sox hitters of all time, but Ted Williams was the best. And so last week FiveThirtyEight ran a piece on how one manager from the Cleveland Indians—hence the relevance, right?—beat Ted Williams by “inventing” what we all know in baseball as the shift.

The below photo comes from the game and shows what we baseball fans now think of as routine was at the time almost brand new. (Although to be fair, the shift in this case left only one fielder on the left side of the field—the left fielder. Typically today both the shortstop and left fielder both remain.) Anyway, for those baseball fans, the article is worth a quick read.

Who's on first? Not Ted Williams after his at bat.
Who’s on first? Not Ted Williams after his at bat.

Credit for the piece goes to an unknown photographer ca. 1946.