Pretty bad.
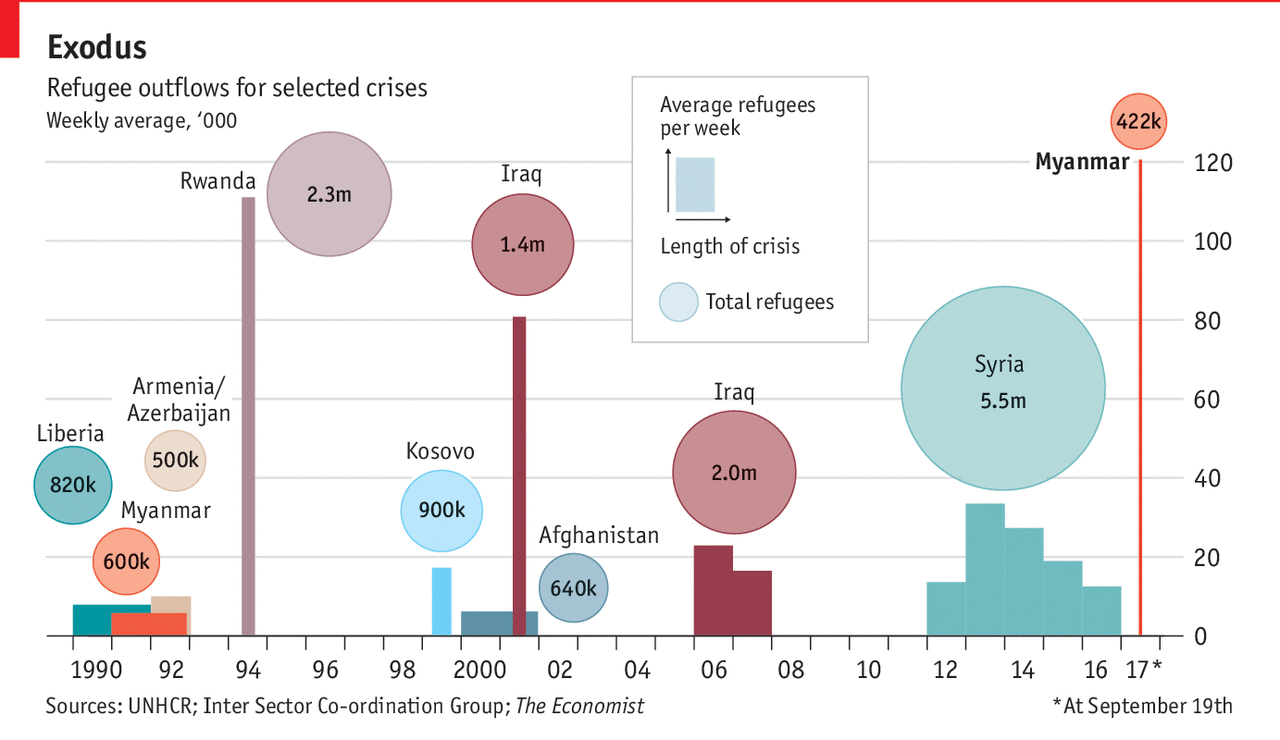
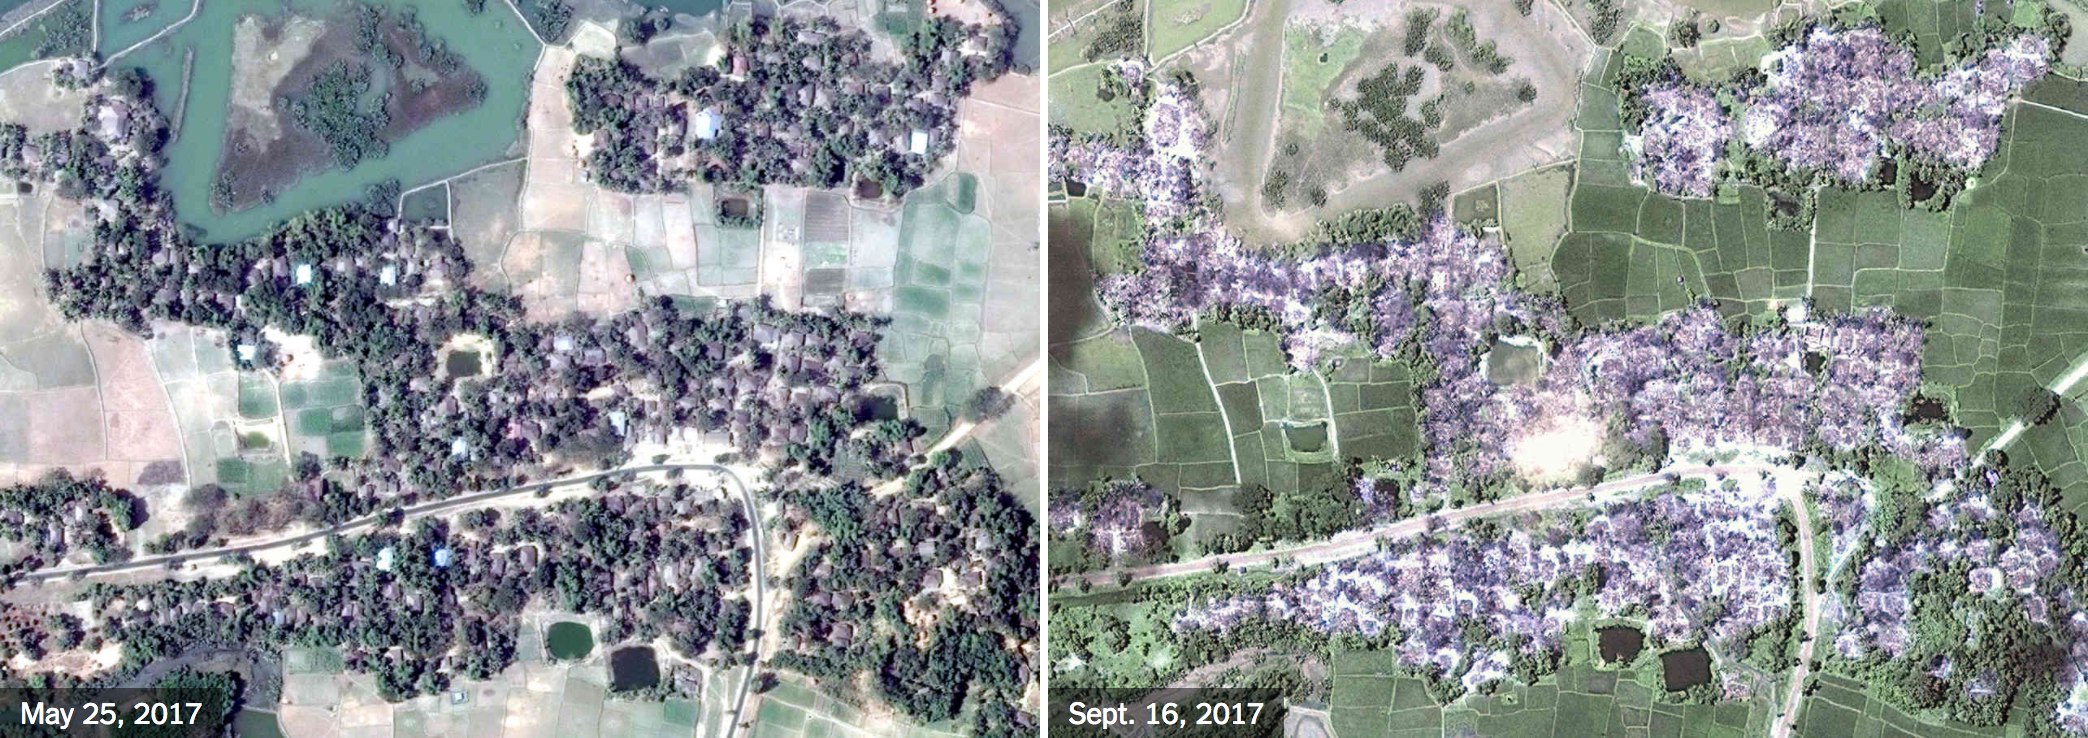
Less than a week after posting about the satellite views showing entire villages razed to the ground, we have a piece from the Economist looking at refugee outflows. And they are worse than the outflow of refugees during the Rwandan genocide back in 1994.
To be clear, they are not saying that nearly a million people have been killed—though there is quite a bit of evidence to say the Burmese security forces are cleansing the state of Rakhine of one of its primary ethnic groups.

But when it comes to the chart, I am not quite sure what I feel about it. It uses both the x and y axis to show the impact of the refugee outflow. But the problem is that we are generally rubbish at comparing areas. Compounding that, we have the total number of refugees represented by circles, another notorious way of displaying areas. (Often people will confuse the circle’s area with its radius or diameter and get the scale wrong.)
I wonder, would a more straight forward display that broke the dataset into two charts would be clearer? What if the designers had kept the Marimekko-like outflow display, but represented each crisis and its total outflow as a straight bar chart to the right of the timeline? (I do think the timeline is particularly good context, especially since it highlights the earlier persecution of the Rohingya.)
Credit for the piece goes to the Economist’s Data Team.

