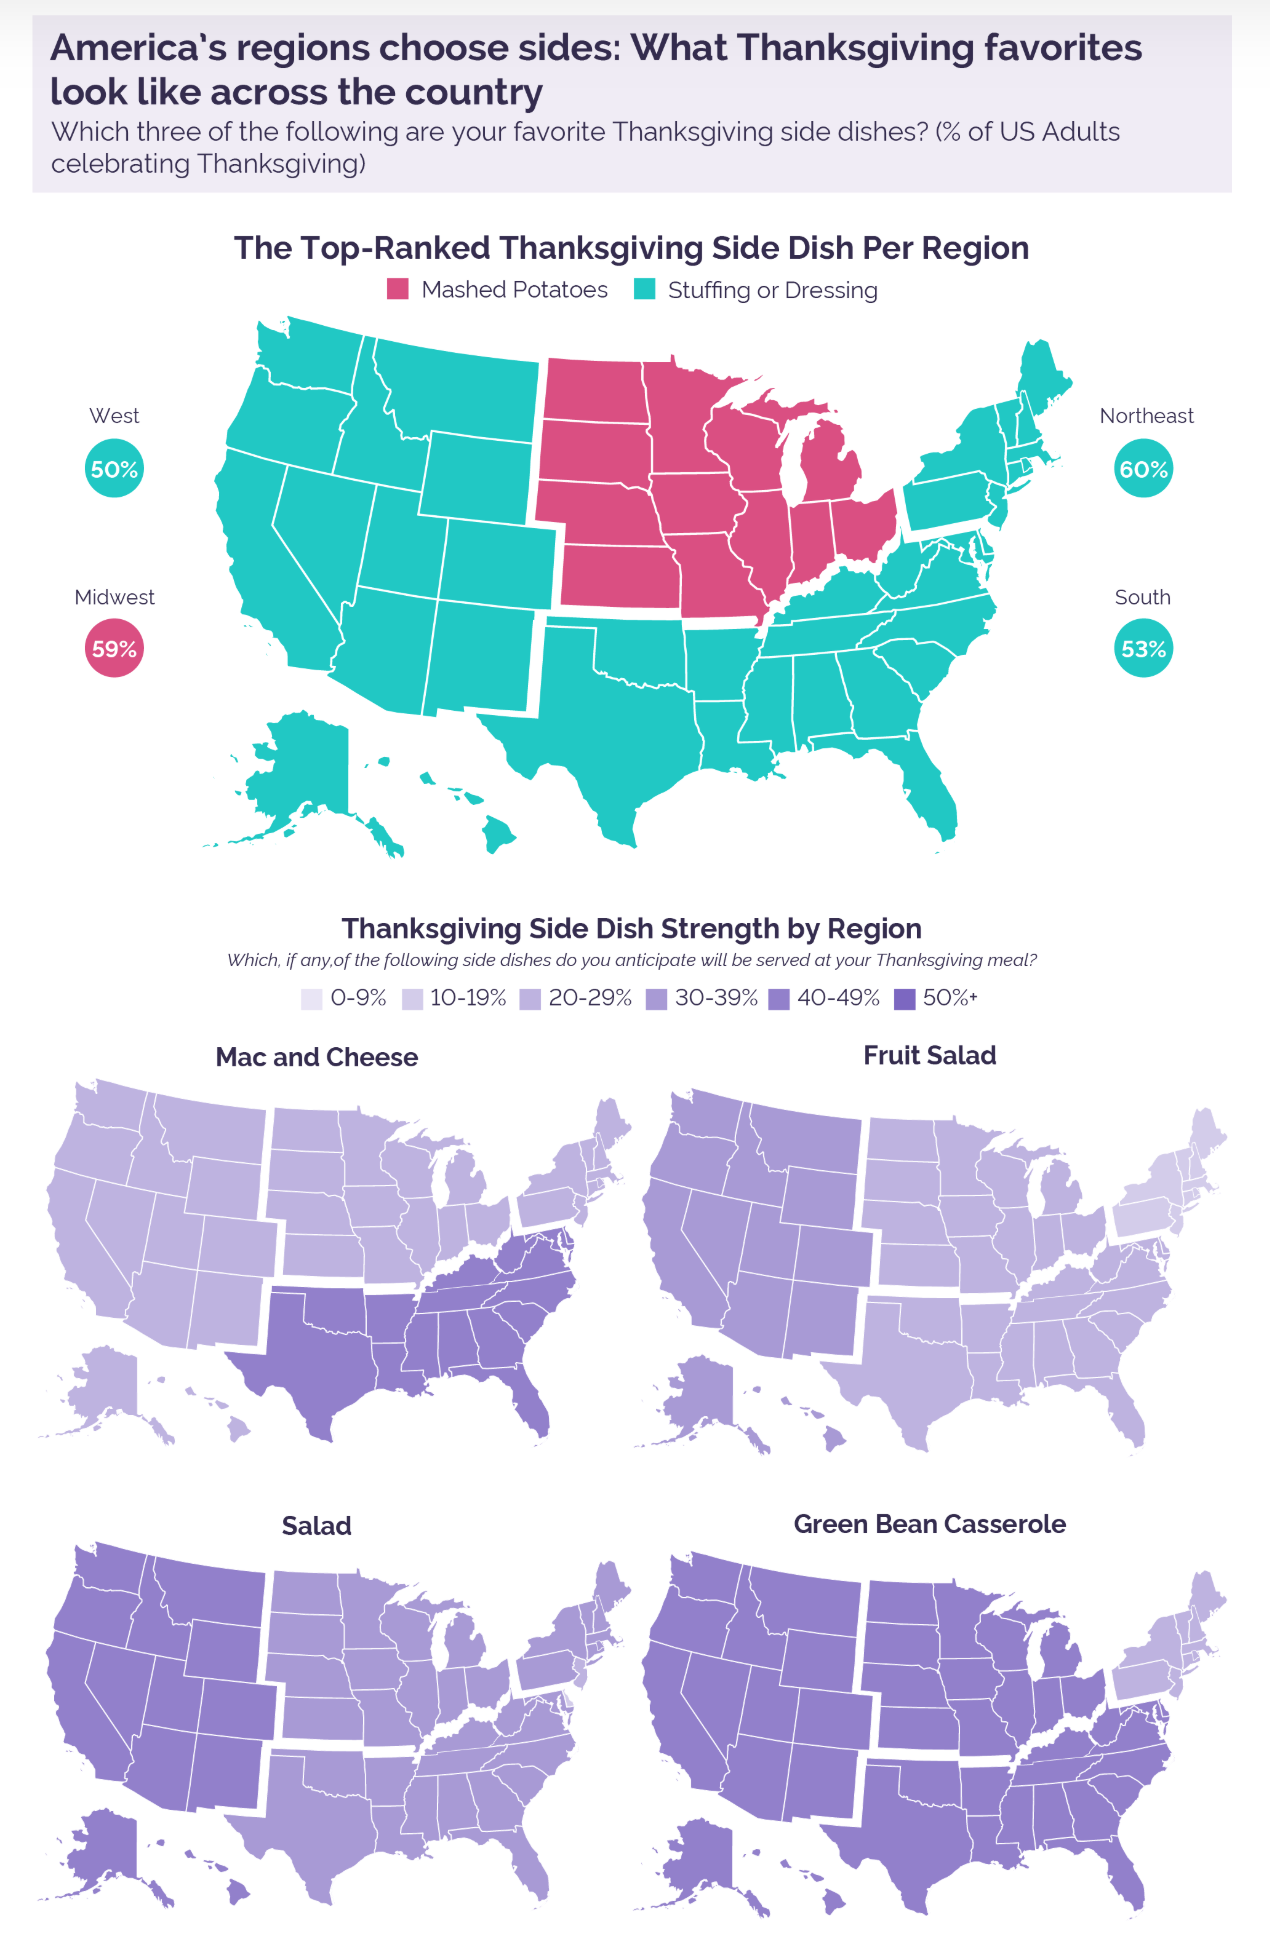
American Thanksgiving meals often feature elaborate spreads of side dishes. And everyone has a favourite. A common theme around the holiday is for media outlets to conduct surveys to see which ones are most popular where. In today’s piece we have one such survey from pollster YouGov. In particular, I wanted to focus on a series of small multiples maps they used to illustrate the preferences.

I used to see this approach taken more often and by this I hope I do not see a foreshadow of its comeback. Here we have US states aggregated into distinct regions, e.g. the Northeast. One could get into an argument about how one defines what region. The Midwest is one often contested such region—I have one post on it dating back to at least 2014.
Instead, however, I want to focus on the distinction between states and regions. This small multiples graphic is a set of choropleth maps that use side dish preferences to colour the map. Simple enough. However, the white lines delineating states imply different fields to be coloured within the graphic. Consequently, it appears that each state within the region has the same preference at the same percentage.
The underlying data behind the maps, at least that which was released, indicates the data is not at the state level but instead at the regional level. In other words, there are no differences to be seen between, say, Pennsylvania and New Jersey. Consequently, a more appropriate map choice would have been one that omitted the state boundaries in favour of the larger outlines of the regions.
More radically, a set of bar charts would have done a better job. Consider that with the exception of fruit salad, in every map, only one region is different than the others. A bar chart would have shown the nuance separating the three regions that in almost all of these maps is lost when they all appear as one colour.
I appreciate what the designers were attempting to do, but here I would ask for seconds, as in chances.
Credit for the piece goes to the YouGov graphics team.
