Bryce Harper

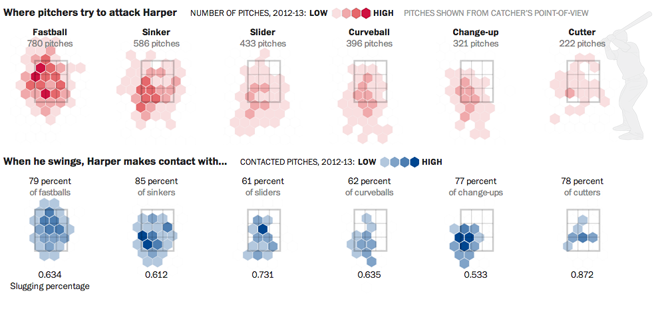
Bryce Harper is undoubtedly one of the best baseball players in the game today. To put it simply, he hits. And he hits well. And he hits well often. So the Washington Post put together an interactive, long form piece about Harper’s swing and hitting.
Pitching to Bryce Harper

The piece begins with a narrated video outlining the science behind Harper’s swing. Then the reader can down into the piece and learn more about Harper’s history and development and how he compares to other hitters. Statistics and data visualisation pieces show just how impressive Harper is as a hitter and how pitchers are trying to combat that.

Interactive long form articles are appearing more and more often online. But this is perhaps the most data- and science-intensive piece I have seen thus far. What is particularly nice about the format is that, as I have often noted, annotations and explanations are what make good infographics and what move data visualisation from presentational to informational. That this piece in particular happens to be about baseball, well, all the better.

Credit for the piece goes to Adam Kilgore, Sohail Al-Jamea, Wilson Andrews, Bonnie Berkowitz, Todd Lindeman, Jonathan Newton, Lindsay Applebaum, Karl Hente, Matthew Rennie, John Romero, and Mitch Rubin.

Disabled List Payrolls

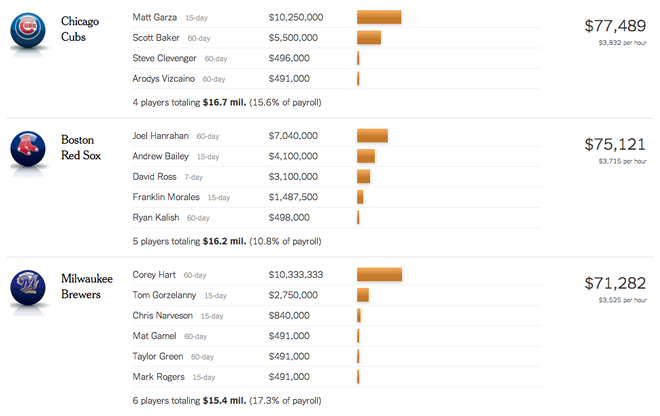
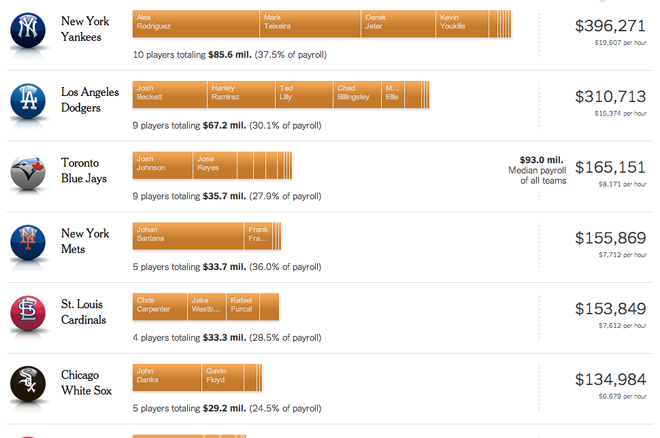
The Boston Red Sox are in Chicago this week to play the other Sox, i.e. the White Sox. So this week we have a bunch of baseball-related pieces. The first is this recent interactive graphic from the New York Times. It is a daily-updated graphic that looks at the payroll of all Major League teams that is tied up on players on the Disabled List, i.e. those unable to play because of injuries.

Comparing all MLB teams

Clearly the Yankees are paying a lot of money for no production. You can go down the list and compare each team’s total spending. But if you want intra-team details, the piece offers you the ability to look at player-by-player salary details. Interestingly one of Chicago’s baseball teams ranks just above the Red Sox while Milwaukee sits just below.

Red Sox players on the Disabled List

Credit for the piece goes to Shan Carter, Kevin Quealy and Joe Ward.

Replacing Nomar Garciaparra

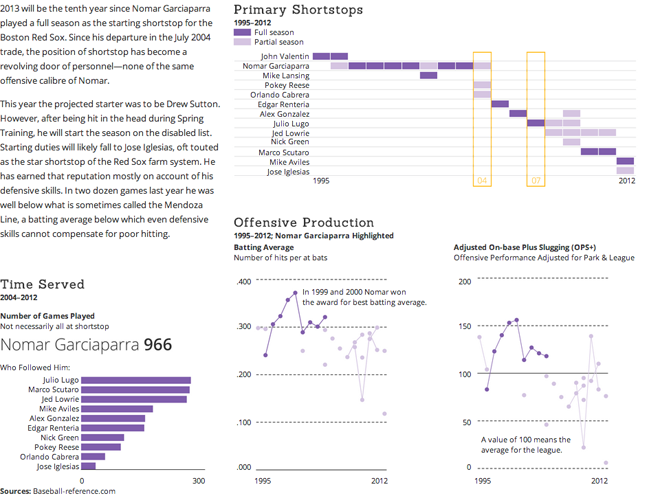
I am a fan of the Boston Red Sox and have been since 1999. The first (and sadly only) Red Sox game I saw at Fenway was the day after Nomar Garciaparra hit three home runs in one game. Two of them were grand slams. For you non-baseball folks (NBF) reading this, that is majorly impressive. Anyway, the Red Sox traded him in 2004 to acquire some pieces they needed to make a run for the World Series title that had eluded them for 80+ years (also significant for NBF). The result? My favourite player traded to the Cubs, but my favourite team won the World Series.

But now it’s Opening Day, the kickoff for the baseball season—that reference is for you American football fans. (To be fair, there was a game last night between two Texas teams, but today’s the de facto start.) Since that 2004 trade, however, the Red Sox have not had a consistent, long-term shortstop of the same offensive calibre of Nomar. How bad has this revolving door been? My infographic today looks at the shortstop replacements for Nomar Garciaparra.

Click to go to the full graphic

The Red Sox Were Truly Awful in 2012

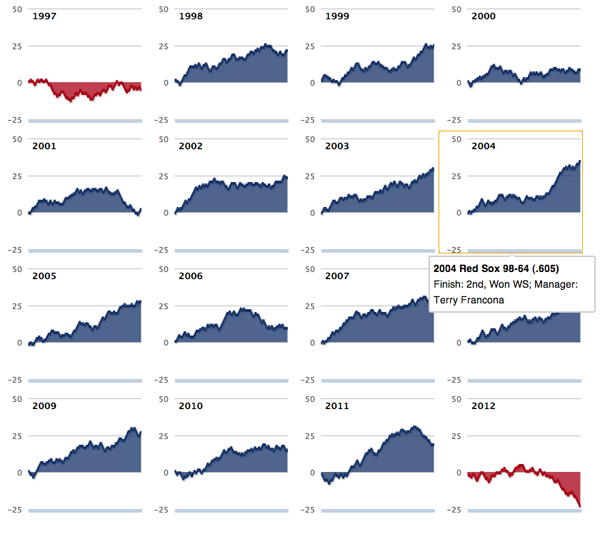
The Boston Red Sox hired John Farrell this weekend to be their manager just one season after hiring Bobby Valentine for the role. There is a lot to be said about just who is to blame about the Red Sox’ awful season. But it was pretty awful. How awful? The Boston Globe shows us in this interactive piece.

It’s a series of small multiples of line charts. However, one of the big problems with the infographic is that the labels are entirely absent. As best I can tell the line is the number of games over .500, i.e. an even split between wins and losses. But, it could be more clearly called out if not in the legend or on the axes than in the title.

But over all it does put this past season into a sober perspective.

How Bad is Bad? Awful, it Turns Out.

Credit for the piece goes to Daigo Fujiwara.

The Cities of Champions

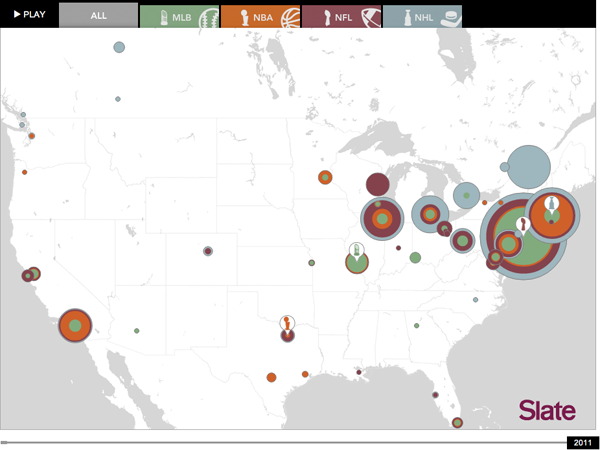
From Slate comes an interactive map of which cities have won what championships across the big four sports (baseball, basketball, football, and hockey). It plots the championships over time and allows the user to see just how dominant certain cities have been in certain sports.

Where the winners won

Credit for the piece goes to Chris Kirk.

Mariano Rivera

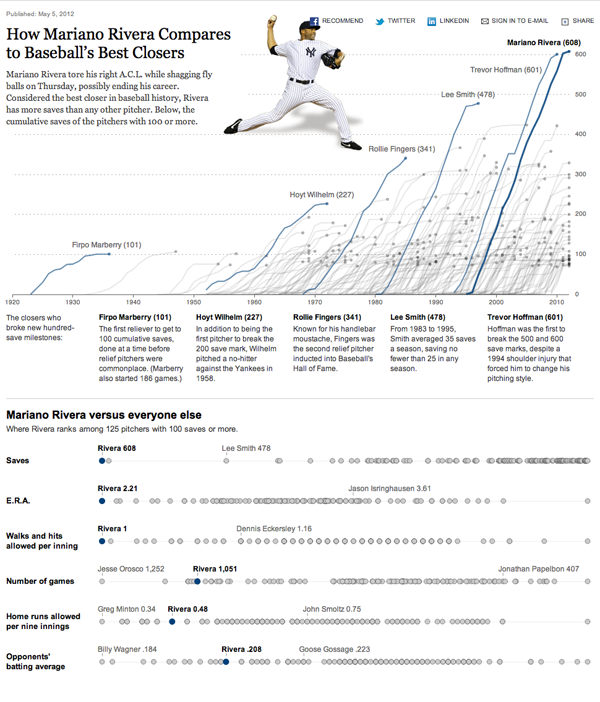
Mariano Rivera of the New York Yankees is(was?) one of the best closers in baseball history. I’ll give him that. So when a freakish accident brought to an end his season—and possibly his career—the New York Times of course had an(other) infographic about his historic numbers.

Rivera compared to other closers

But I’m a Red Sox fan. And this whole sequence of events will always be my memory of Rivera.

A great night
A great night

Power Pitching (And Who’s Paying)

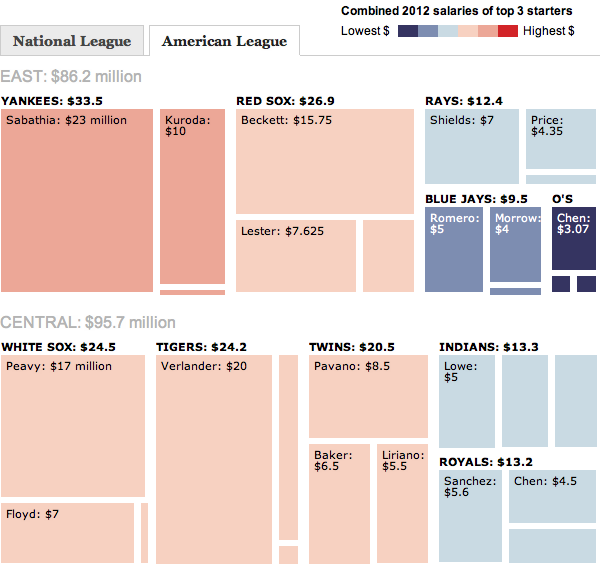
And the baseball season is kicking off (perhaps a bit slowly for my 1–3 Red Sox, but I’m not worried…yet). The Washington Post, the newspaper for those most likely to be following the Washington Nationals, put out a little while ago an interactive graphic looking at the payroll figures for the Top-3 starting pitchers in each team’s rotation.

Comparison of AL East and Central Pitching Contracts

Credit for the piece goes to Sisi Wei and Todd Lindeman.