How Africa Tweets

Today’s piece is hit and miss. It comes from the World Economic Forum and the subject matter is the use of Twitter across Africa. I think the subject matter is interesting; mobile communication technology is changing Africa drastically. The regional trends shown in the map at the core of the piece are also fascinating. Naturally I am left wondering about why certain countries. Does spending on infrastructure, GDP per capita, disposable income levels have any sort of correlation if even only on a national and not city level?
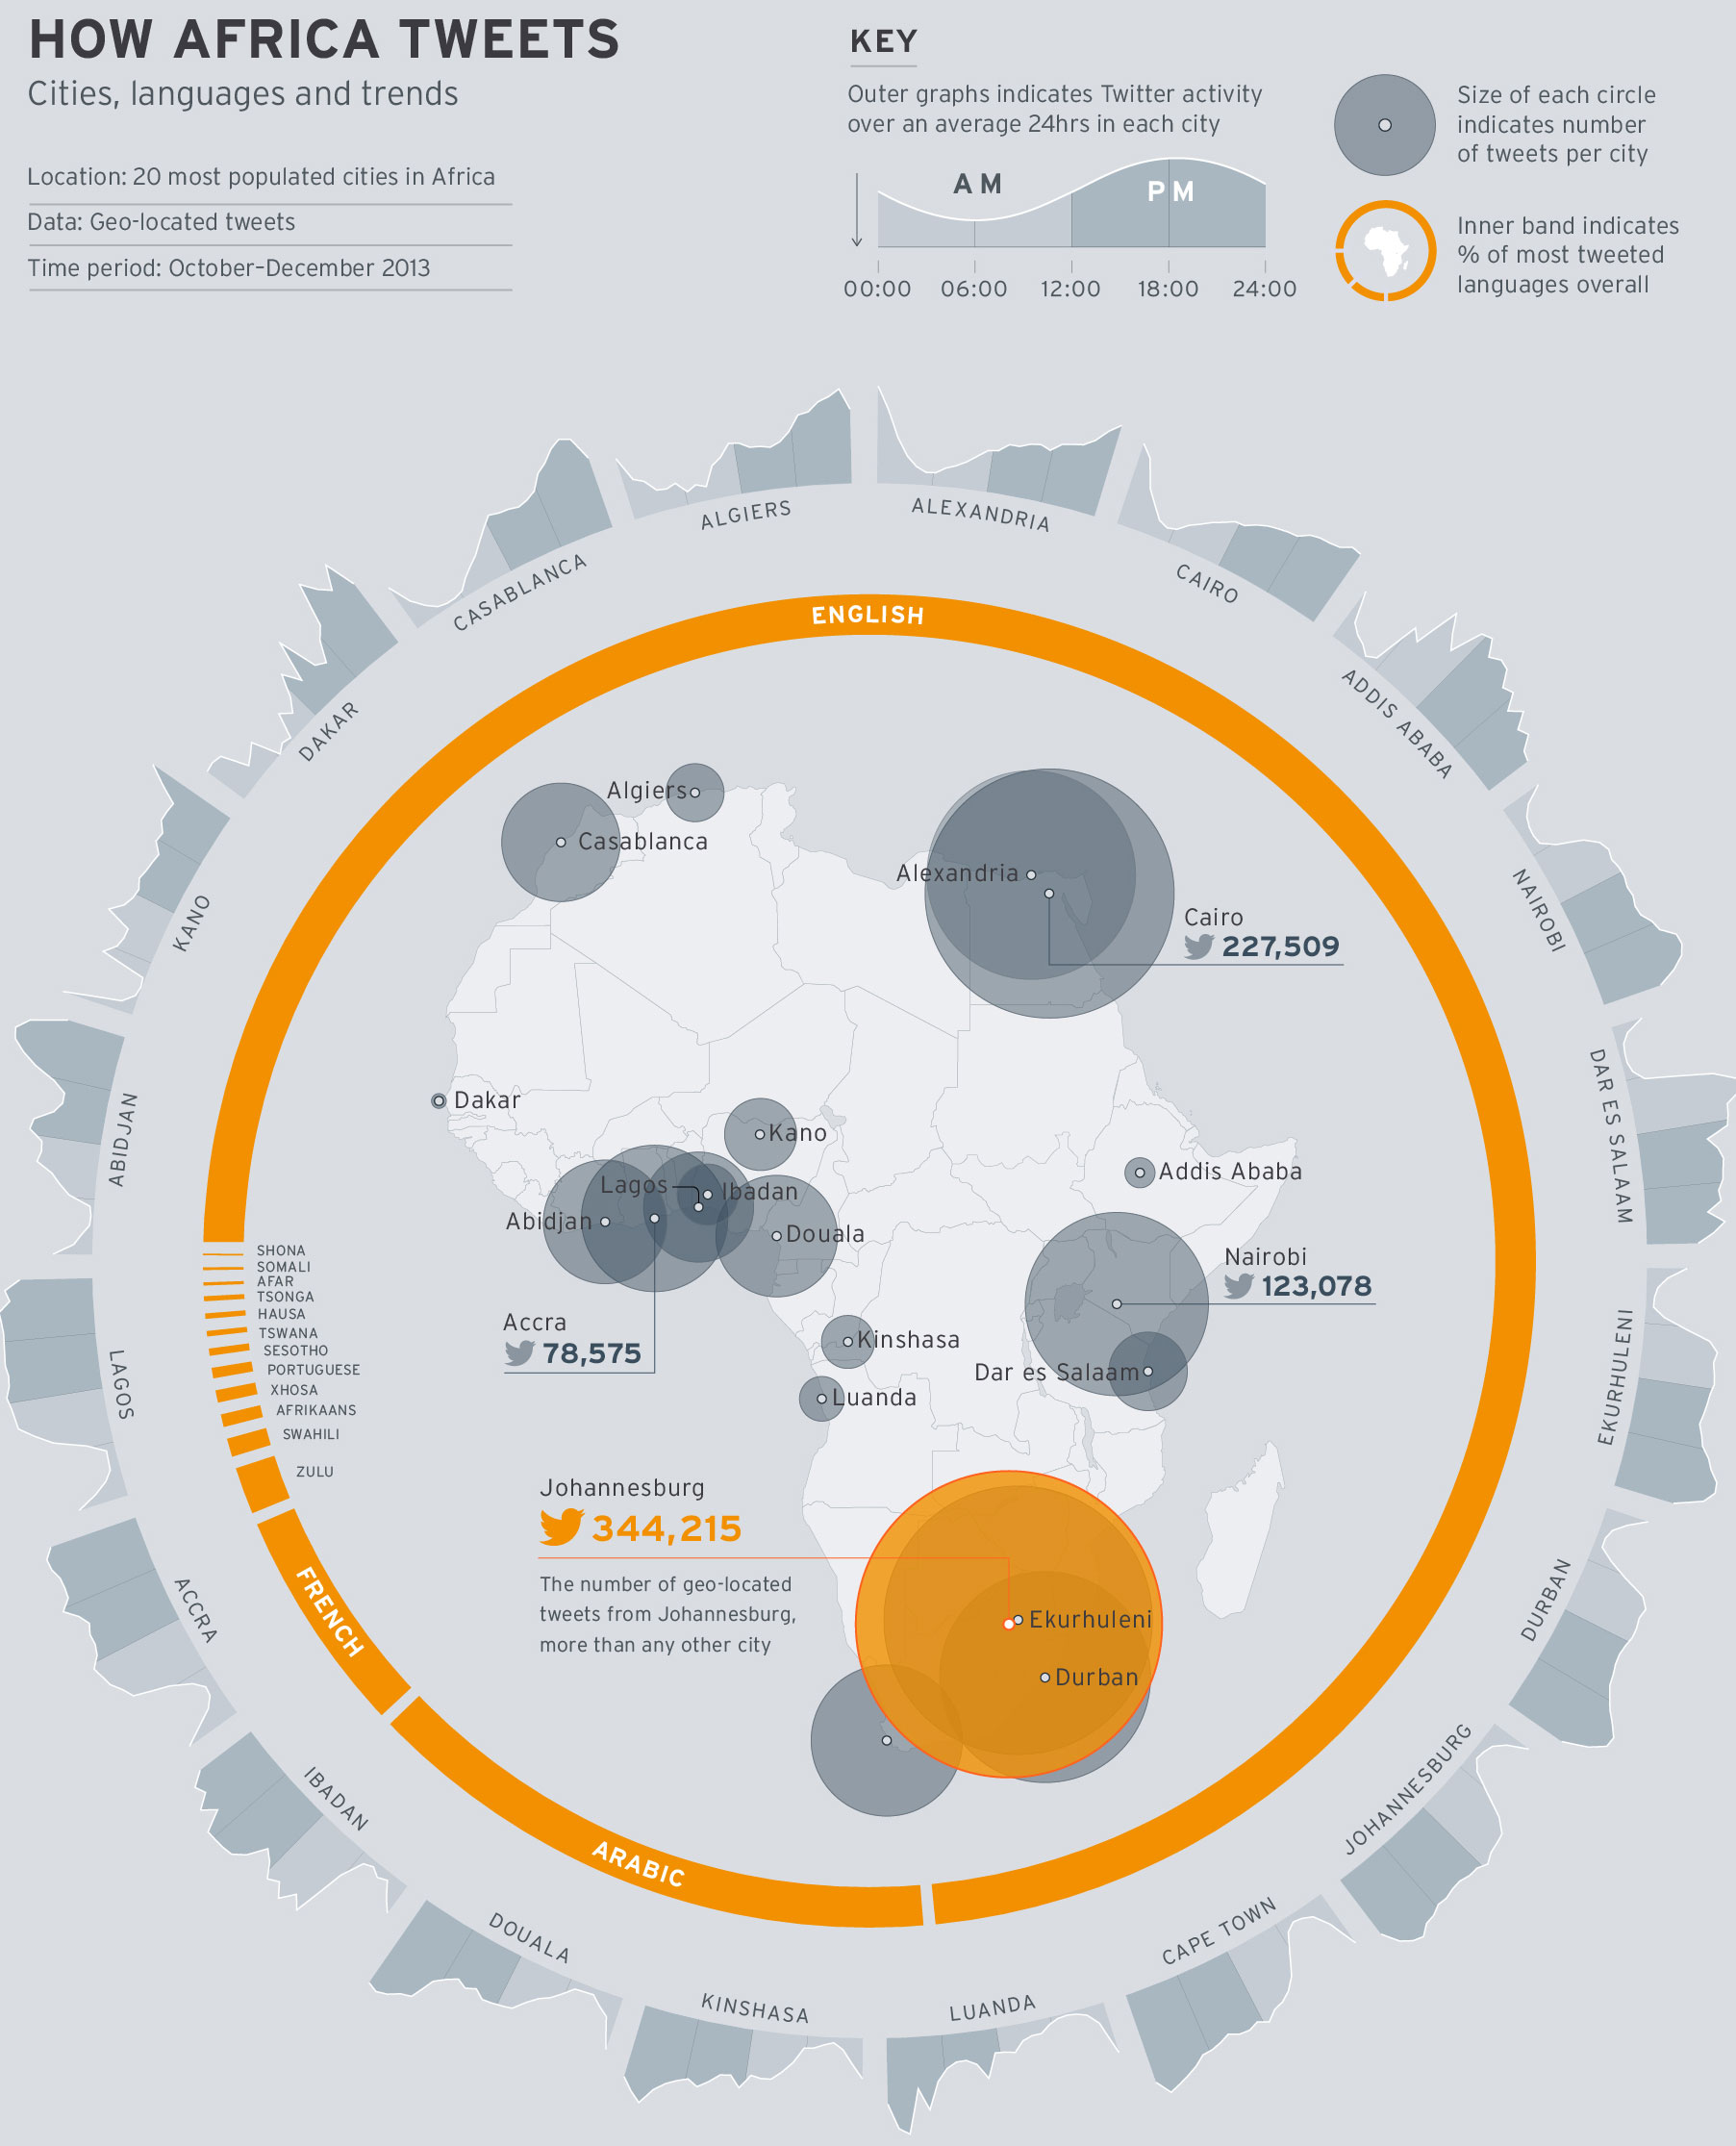
How Africa tweets
How Africa tweets

But what really irks me is the content that wraps around the map. First the donut chart, I think my objections to donuts—at least the non-edible kind—are well known. In this case, I would add—or sprinkle on—that the white gaps between the languages are unnecessary and potentially misleading.

Secondly, the cities are eventually displayed upside down. Thankfully the labels are reversed so that city names are legible. However, the continually changing angle of the chart makes it difficult to compare Douala to Luanda to Alexandria. A neatly organised matrix of small multiples would make the data far clearer to read.

In short, I feel this piece is a good step in the right direction. However, it could do with a few more drafts and revisions.

Credit for the piece goes to Allan Kamau.

Ivory Poaching

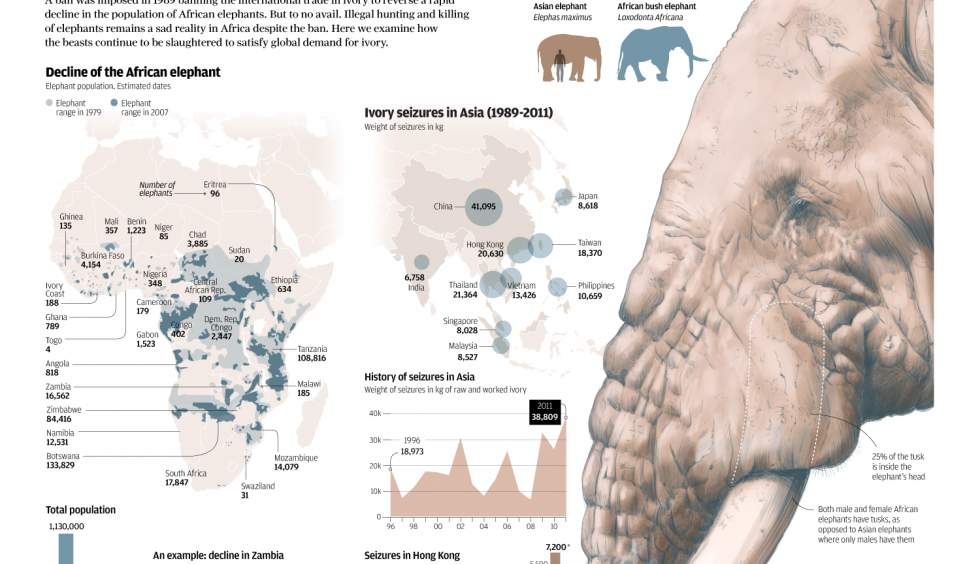
The South China Morning Post had a fantastic infographic detailing the hunting of elephants for their ivory. Despite bans to make such hunting illegal, the problem continues and is worsening because of the Asian trade in ivory.

Cropping of the infographic

Credit for the piece goes to Adolfo Arranz.

The Young and the Educated

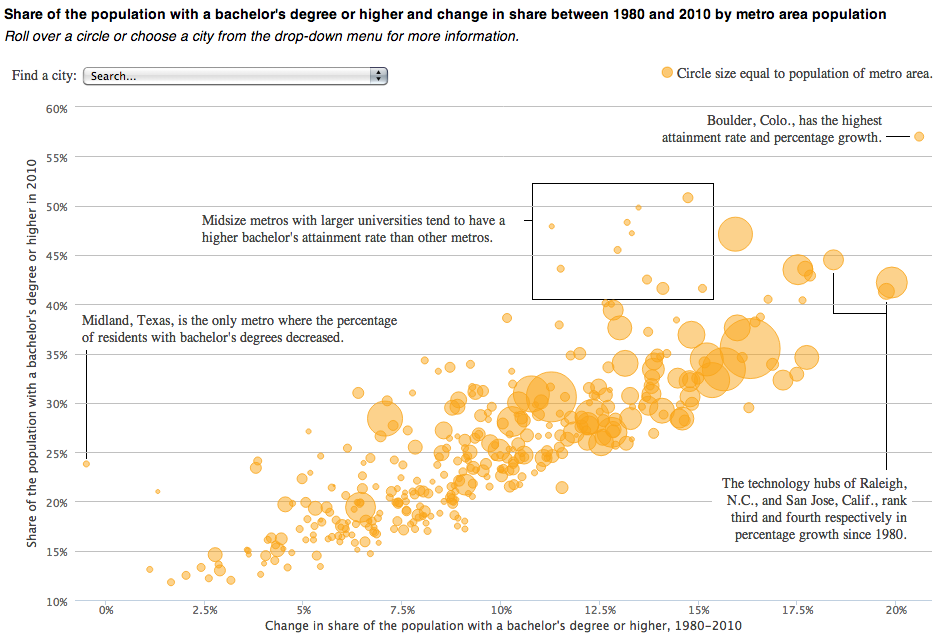
Today’s piece comes from the National Journal. It is an interactive bubble chart that compares the educated class of cities in 1980 to those in 2010 (educated meaning the share of population with at least a bachelor’s degree).

College graduate cities

Not a whole lot to say about this one, in a good way. A nice summation at the top with clearly presented data below while annotations on the plot call out particular objects in the series worth noting. And then for those who want to find themselves, a drop down filter at the top allows users to select a particular city.

Credit for the piece goes to Brian McGill and Nancy Cook.

The New American Center

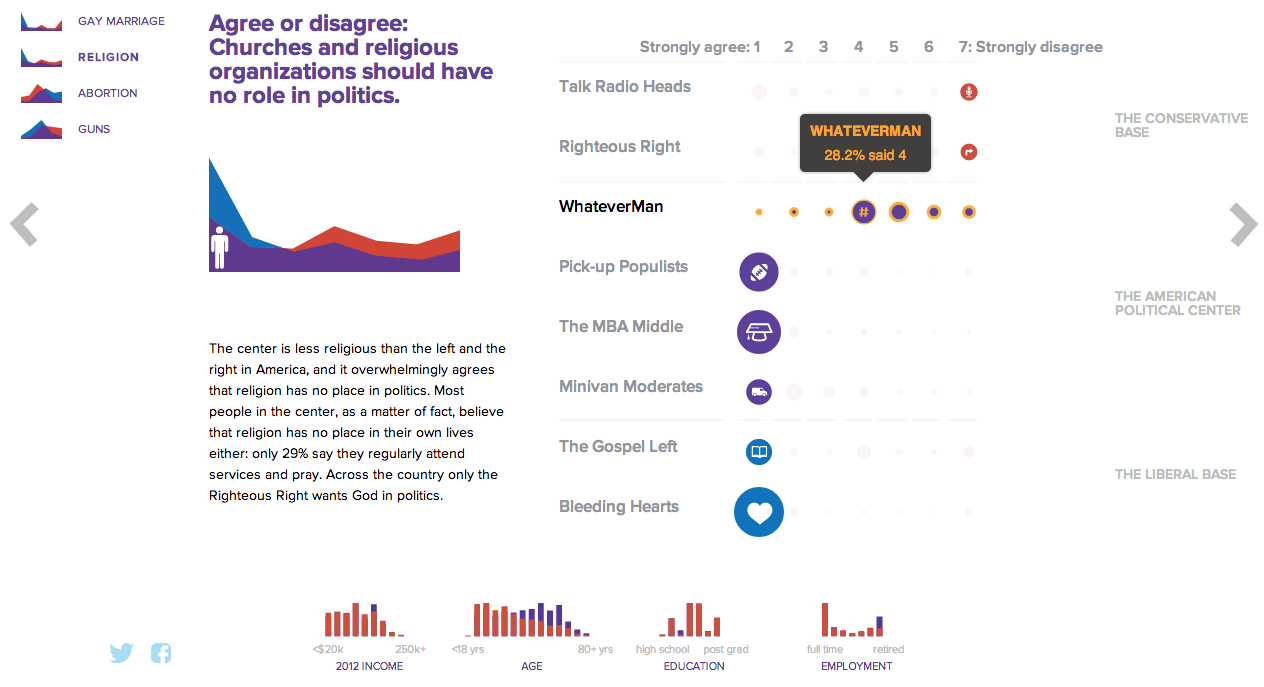
NBC News and Esquire magazine published results from their August survey of some 2000+ respondents that attempted to define the New American Center, i.e. the political persuasions of the majority of the country excepting the radical right and the loony left. For the purposes of Coffee Spoons, I am most interested in looking at the data visualisation and the infographics that result.

Both NBC News and Esquire visualised the results. While I could write two long blog posts looking at both of them, for today, it is more important to look more at the fundamental design difference between the two.

NBC News opted for a design direction emphasising data first. Perhaps because NBC is a news platform, their focus was on the clean communication of the data. Looking

NBC News results
NBC News results

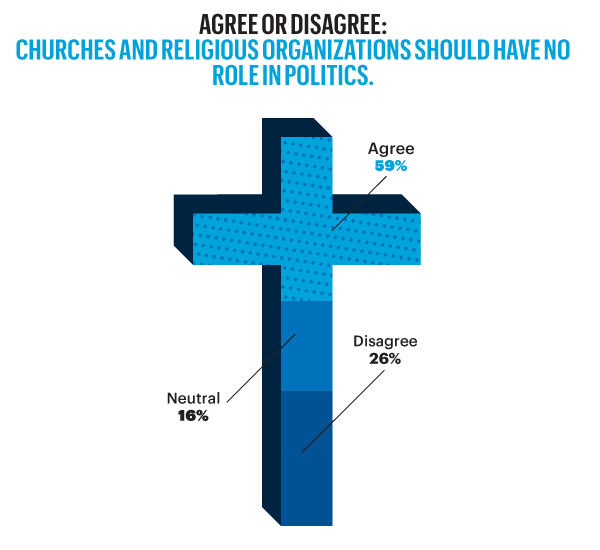
On the other hand, Esquire opted for a more sensationalised direction. The same data points used for the screenshot above creates this graphic below. Not only is less data is contained, less context given, less subtlety and nuance captured, it also is just difficult to read. Is the 59% supposed to be the area of the cross filled in? Its length? Why is it three-dimensional? Where are the Snowdens of yesteryear? At first glance, I ignore the horizontal wings and focus solely on the vertical length of the main bar.

Esquire results
Esquire results

For a useful representation of data, I think NBC News clearly wins. But that both organisations used the same data to craft their separate results, this story on the New American Center is useful for comparing two different design directions and the results thereof.

No designers are specifically mentioned, at least not that I could find, so credit for each piece goes to its respective owner, i.e. NBC News or Esquire.

Corporate Taxes

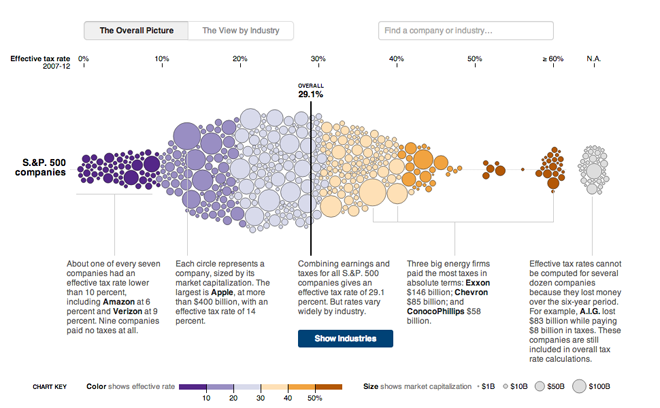
Corporate taxes are always a fun discussion point. Who pays too much? Too little? Not at all? In May, the New York Times published an interactive piece examining US companies and their effective tax rates from 2007 through 2012.

At its core, the piece is a bubble chart along one axis that plots the tax rate for the company, with the bubble sized proportionally to said company’s market capitalisation. Colours reinforce the tax rate plotting, but are not themselves necessary. I think they would have been better tied to something along the lines of industries or profit or sales growth.

Overall corporate tax rates

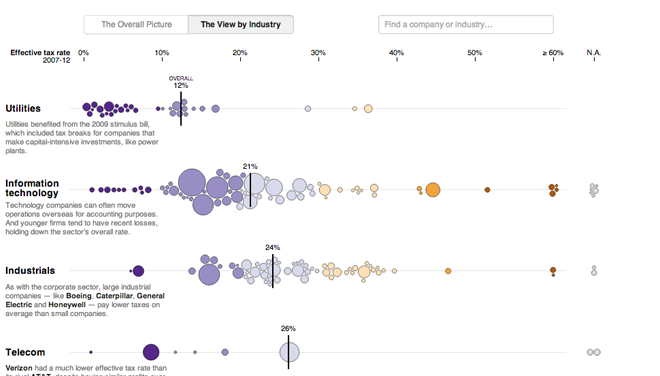
Of course that was when I saw the button for viewing the data by industry. The view of all companies is broken up into a series of charts about each particular industry. And of course, if you want information on a particular company, the smart search/filter is particularly useful.

Corporate tax rates by industry

Credit for the piece goes to Mike Bostock, Matthew Ericson, David Leonhardt, and Bill Marsh.

Who Has Your Photograph

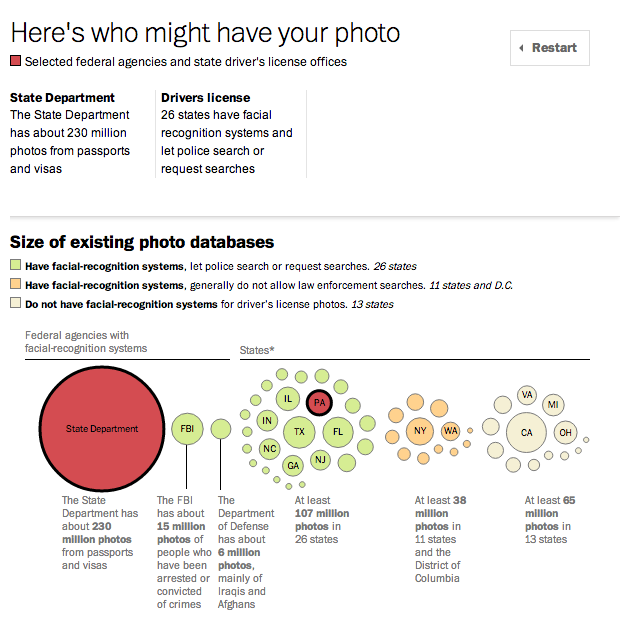
Privacy is the hot topic these days. And in this interactive piece from the Washington Post, we can see which state and federal agencies may have your photograph to run face recognition software without your arrest. The bubble chart, which is broken into four different levels of search permissions, maps out how many photographs are stored. Beyond that, however, the piece personalises the story by asking you a few simple questions to reveal just who may very well have your face. Below is where my ugly mug is stored.

My photograph can likely be found in red.

Credit for the piece goes to Darla Cameron and Craig Timberg.

New Data Visualisation Forms

Monday was an odd day, both 1 April and the start of baseball. I had a tough decision to make: Do I post a serious baseball-related piece or a humourous April Fool’s Day one instead? If you recall, I went for the serious baseball option. But that leaves me with Friday, where I try to post work that is a bit on the lighter side of life.

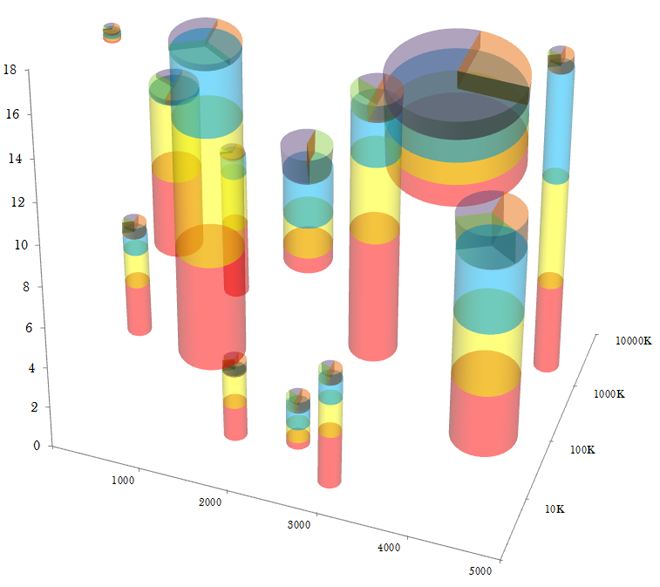
So here is EagerPies, published by EagerEyes on 1 April. It’s in the style of the EagerEyes site, a blog with posts about data visualisation. This selection is EagerPies work to improve upon Minard and the layering of data sets. But if you worry about complexity, fret not for they realised that encoding data in transparency would be a step too far.

Stacked scatter column pies

Credit for the piece goes to EagerPies.

Canadian Debt

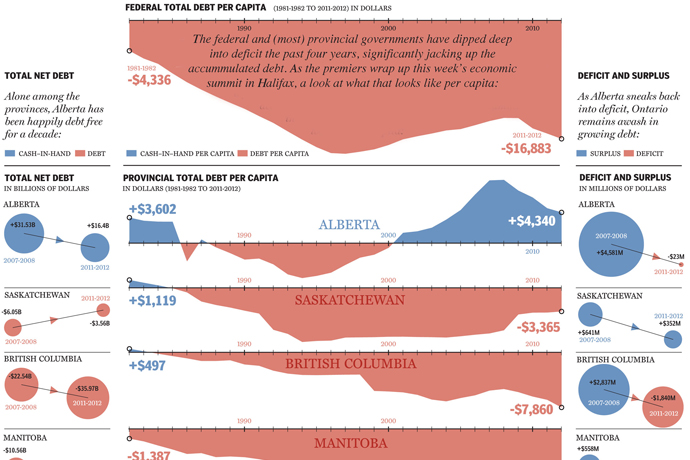
Canada, along with Australia, was one of the few Western, industrialised economies to weather the global recession of 2008 fairly well. However in recent years, despite the economic boom in the energy-rich western provinces, many of Canada’s provinces have been accumulating substantial—though not yet crippling—levels of debt. Toronto’s National Post explores the federal and provincial situation using small (or perhaps medium-sized) multiples.

Canada's debt
Canada's debt

Credit for the piece goes to Richard Johnson.

Palestine

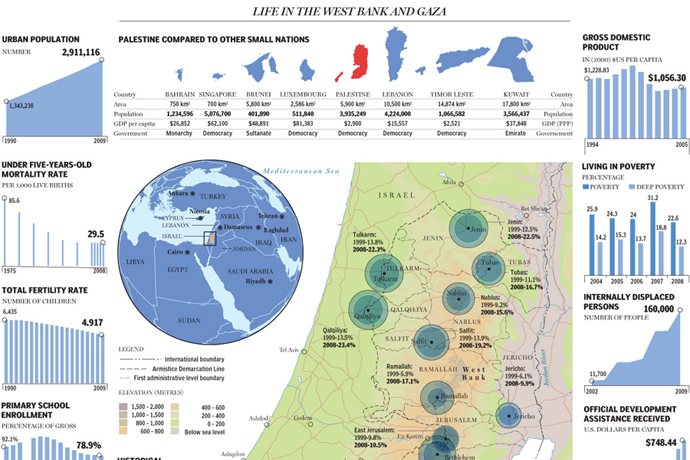
With Palestine admitted to the United Nations as a non-member observer state, the Middle East tensions between Israel and Palestine have reached a new level. Regardless, Palestine may now have access to international institutions and is closer to being a recognised, sovereign state. Toronto’s National Post published a large infographic looking at the state of Palestine and how the two non-contiguous territories of the West Bank and the Gaza Strip compare to each other.

An infographic looking at Palestine

Credit for the piece goes to Richard Johnson.

The Politics of Beer

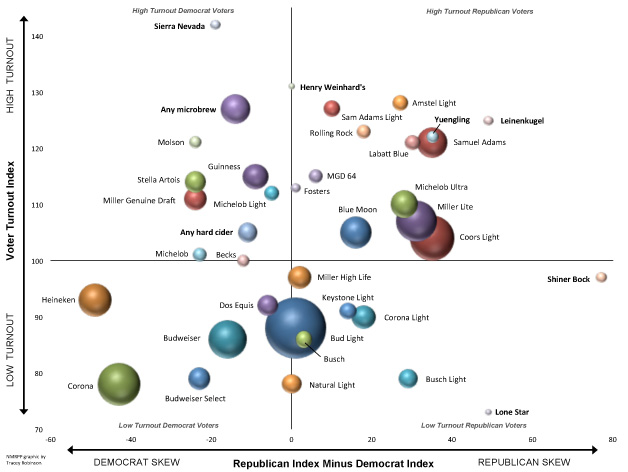
This Friday at Happy Hour as you sip your pint, are you going to wonder what your beer choice says about your politics? Okay, probably not. But you could. And if you did, this chart from the National Journal would help you identify just what your drink is saying.

Politics of beer
Politics of beer

Is your favourite on the chart? Do you have to reevaluate your choices for November? Or whether or not to go vote?

Credit for the piece goes to Tracey Robinson, NMRPP via the National Journal.