Carbon Taxes

Last week the New York Times published an article about carbon taxes, looking at their adoption around the world and their effectiveness. It is a fascinating article about how different countries have chosen to implement the broad policy idea and the various forms it can take. And, most importantly, how some of those policies can end up blunting the intended effect of carbon emission reduction.

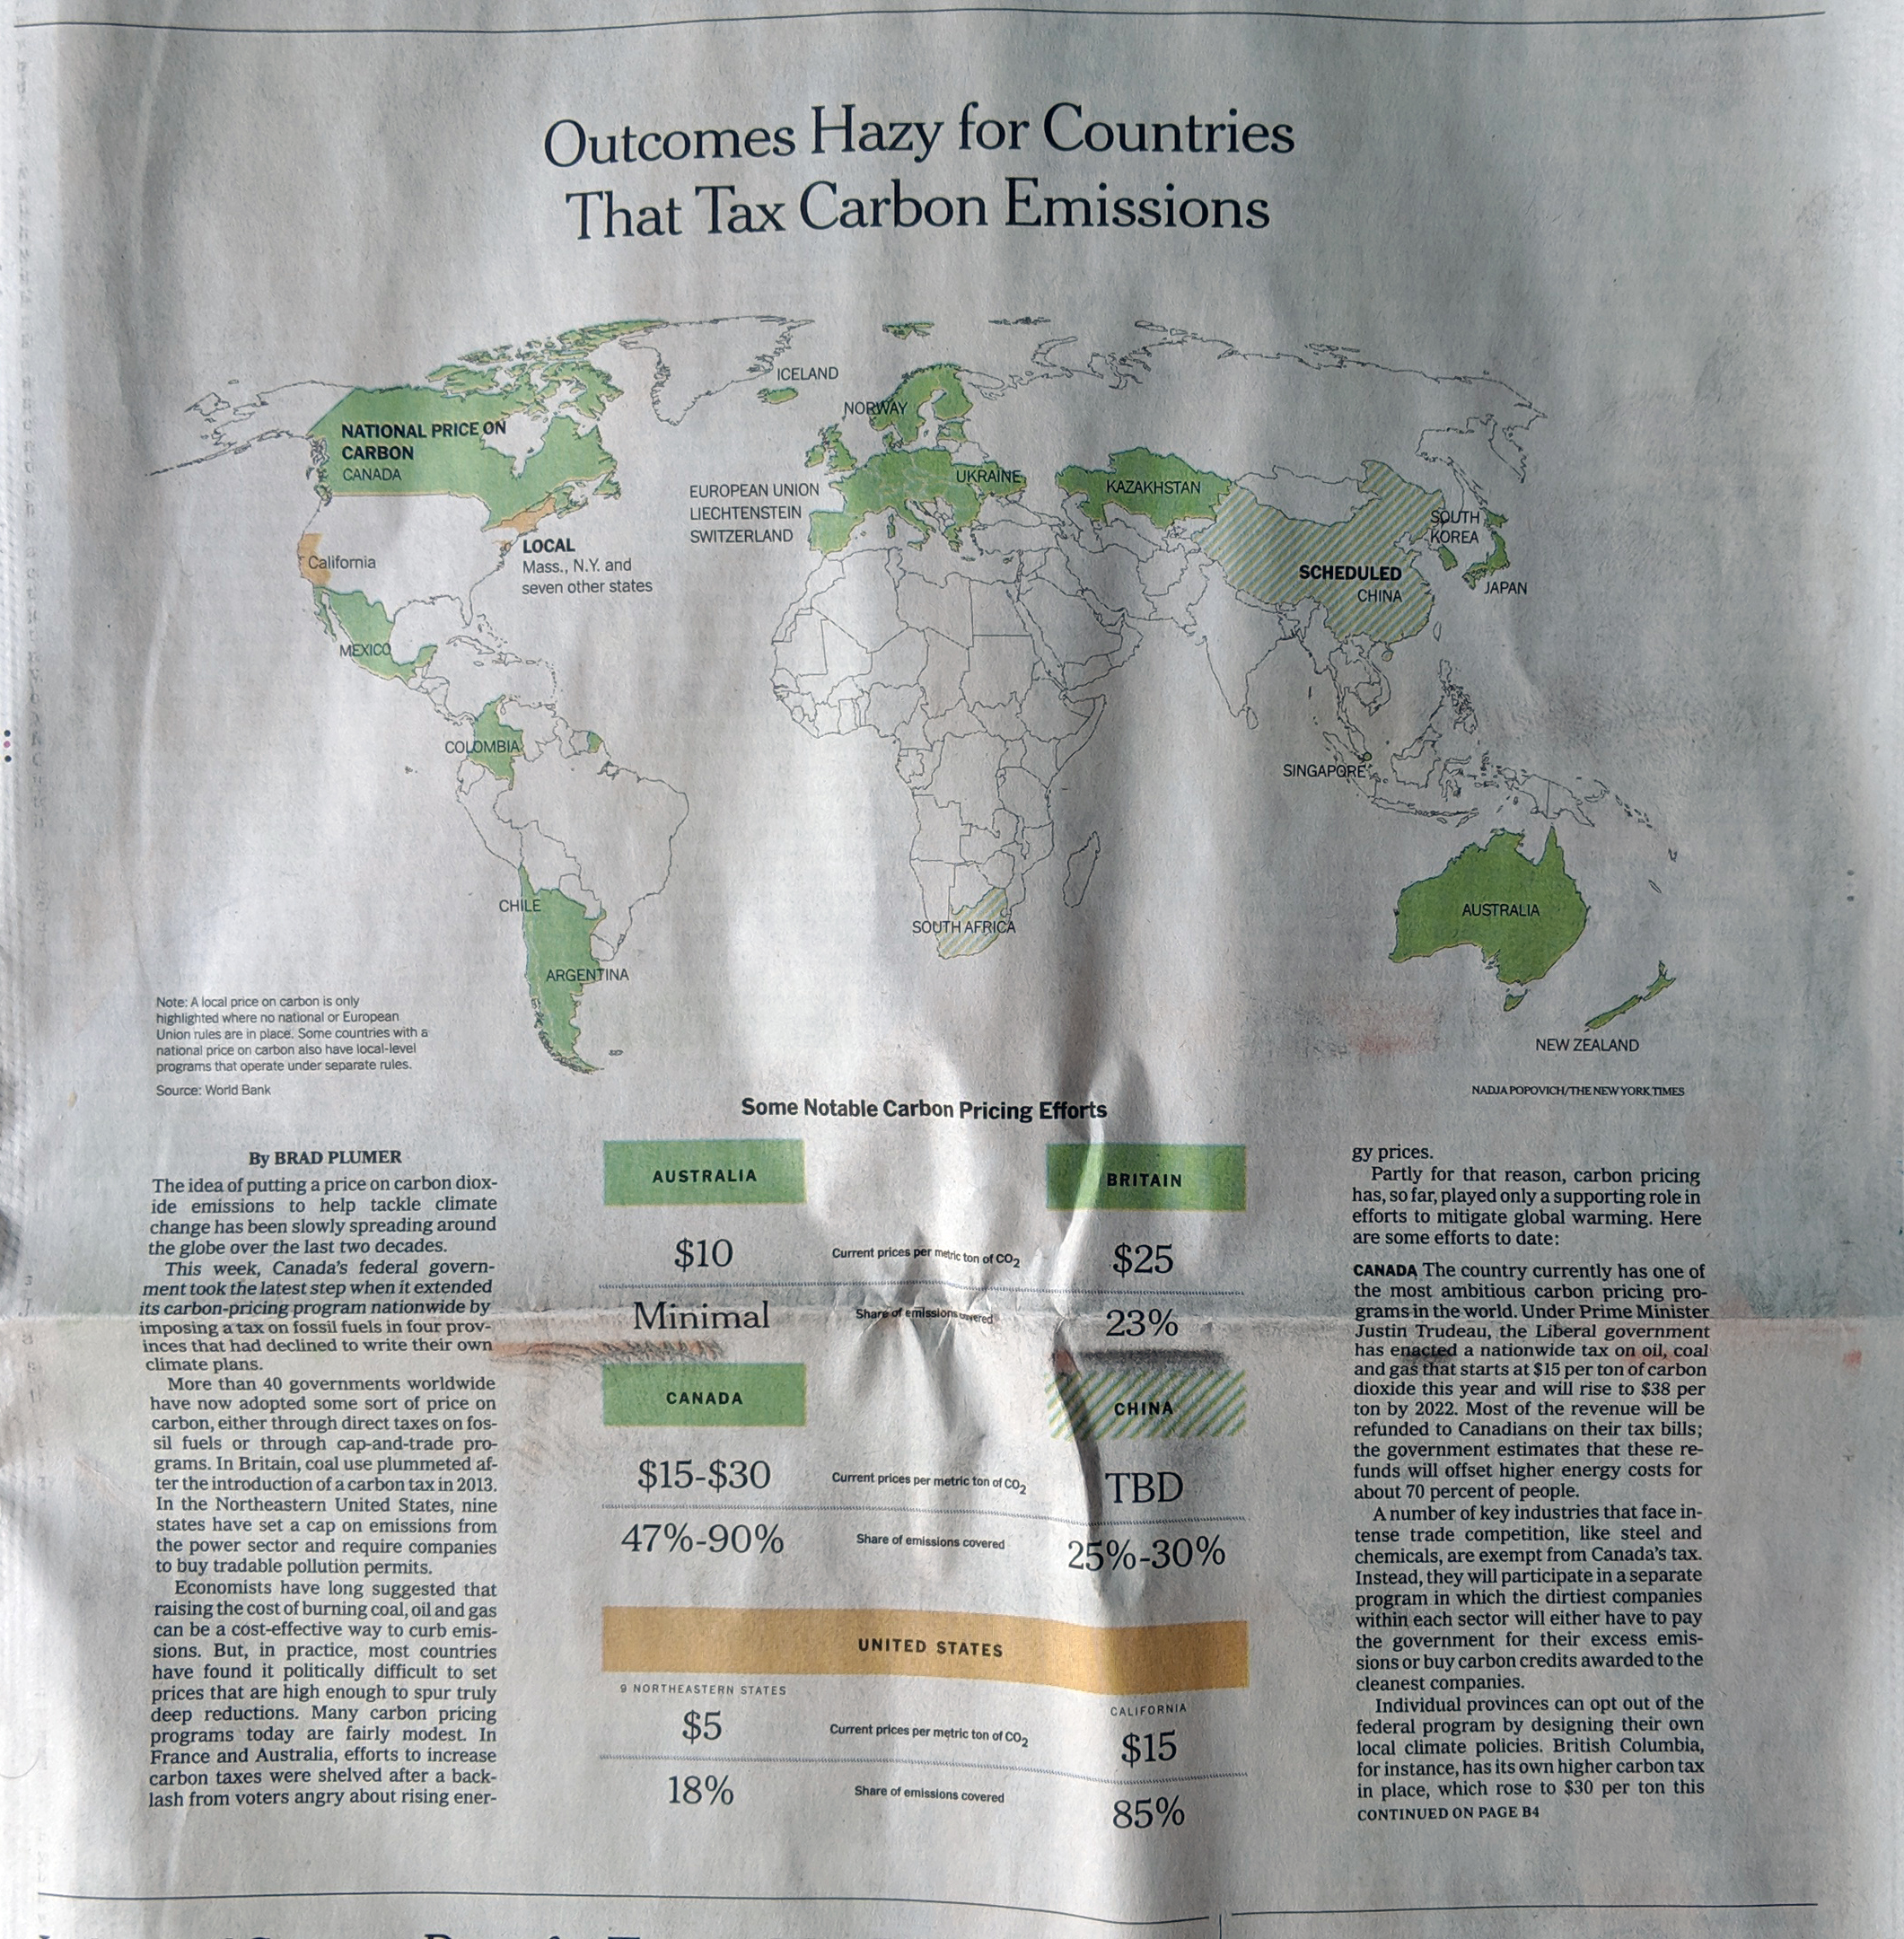
This, however, is about the print piece, because as I was flipping through the morning paper, I found the Business section had a world map above the fold. And we all know how I feel about big, splashy print graphics.
We could use some more green on this map

Here we have a pretty straight-forward piece. It uses a map to indicate which countries have adopted or are scheduled to adopt a carbon tax programme. The always interesting bit is how the federal system in the United States is represented. Whilst a carbon cap-and-trade deal failed in the US Senate in 2009, individual states have taken up the banner and begun to implement their own plans. Hence, the map shows the states in yellow.

There is nothing too crazy going on in the piece, but it is just a reminder that sometimes, as a designer, I love big splashy graphics to anchor an article.

Credit for the piece goes to Brad Plumer.

Apple Hits One Trillion

Last Tuesday we looked at a print piece from the New York Times detailing the share price plunge of Facebook after the company revealed how recent scandals and negative news impacted its financials. Well, today we have a piece from last week that shows how large Apple is after it hit a market capitalisation of one trillion US dollars.

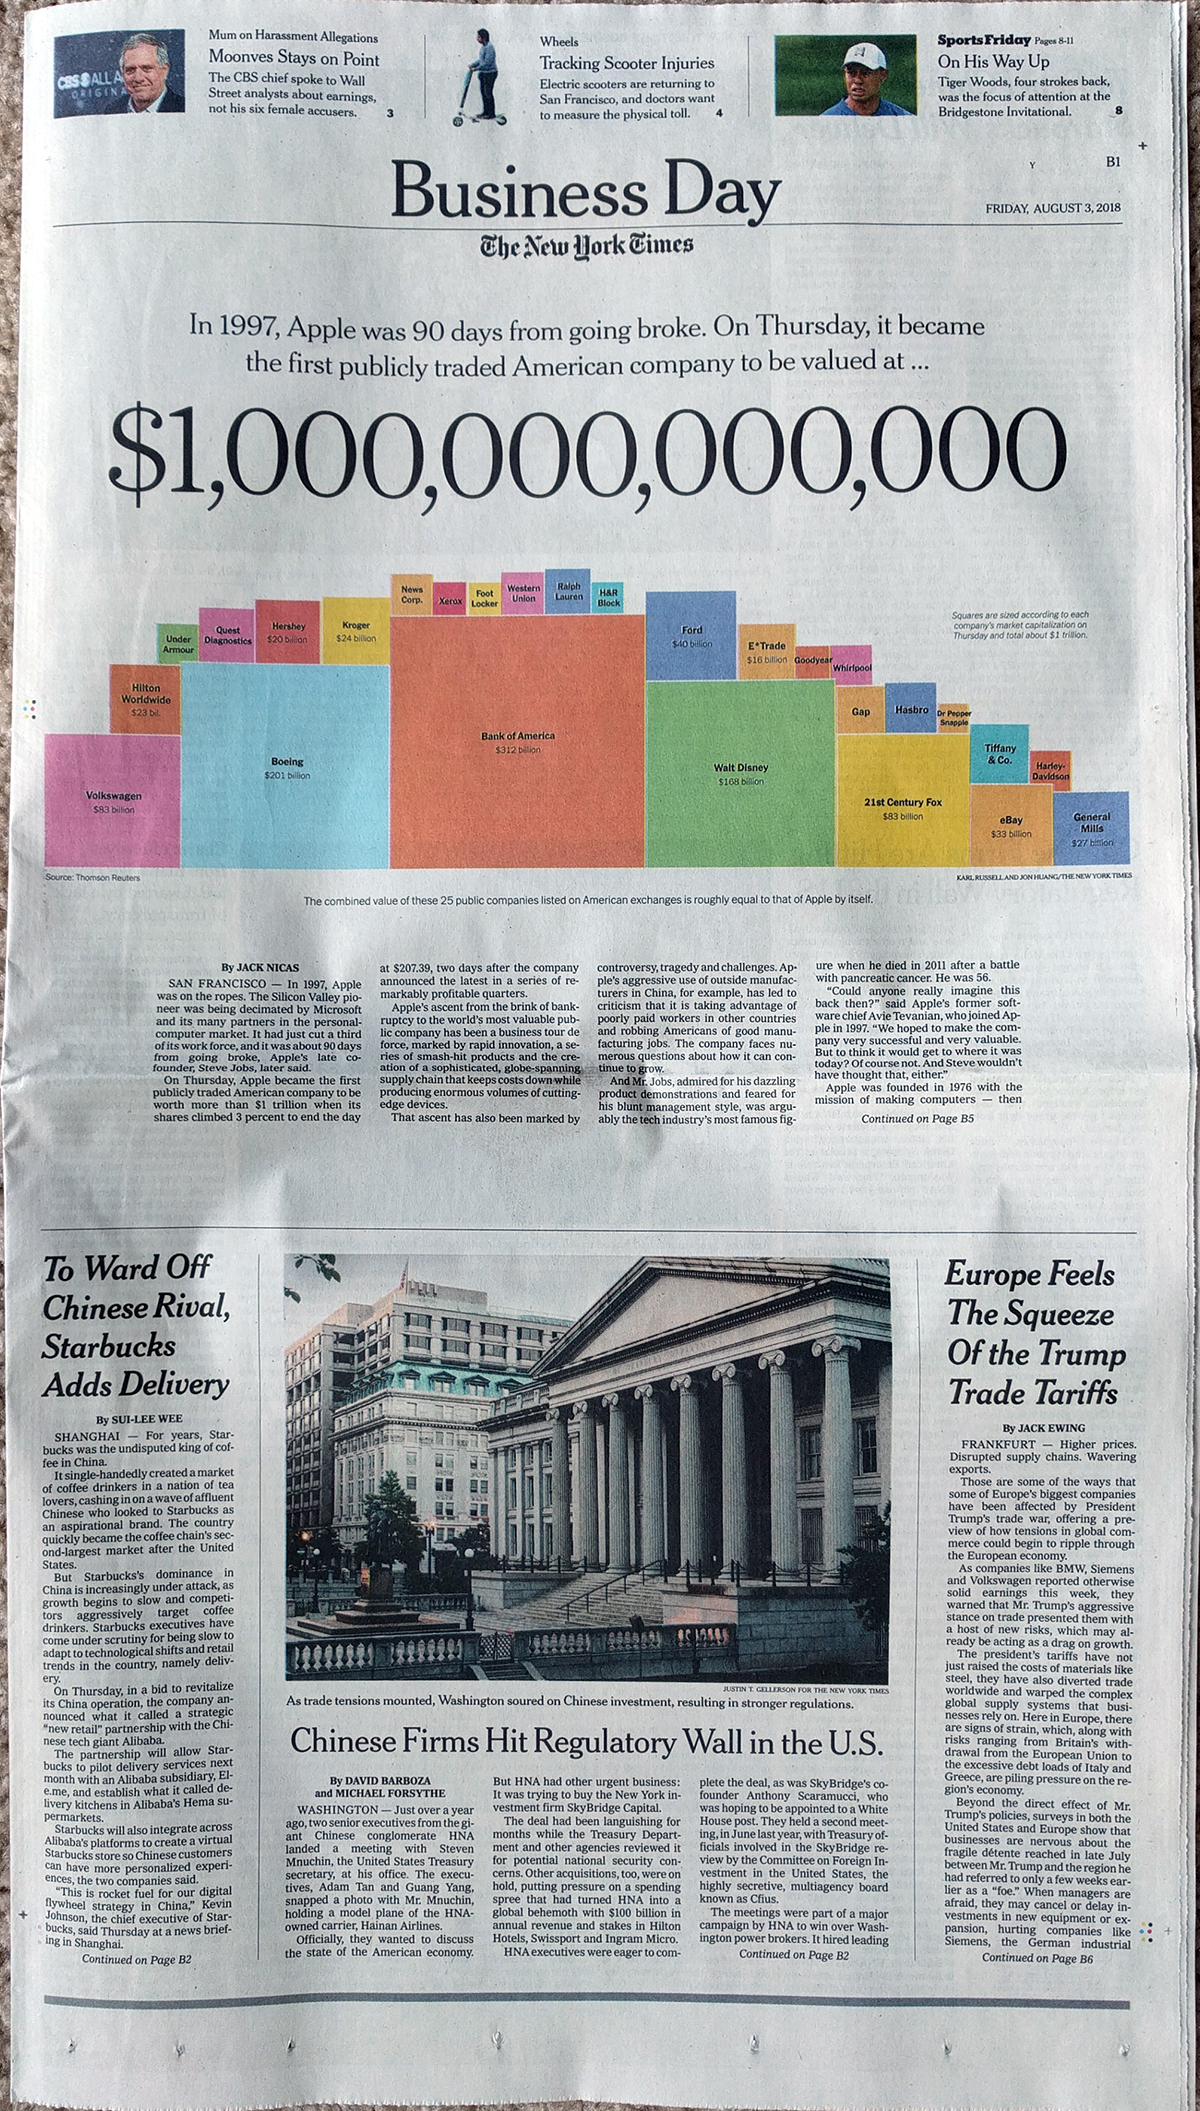
The piece itself is not big on the data visualisation, but it functions much like the Facebook piece, as a blend of editorial design and data visualisation. The graphic falls entirely above the fold and combines a factette and maybe we could classify it as a deconstructed tree map. It uses squares where, presumably, the area equates to the company’s value. And the sum total of those squares equals that of one trillion dollars, or the value of Apple.

Looking at the full page

In terms of design it does it well. The factette is large enough to just about stretch across the width of the page and so matches the graphic below it in its array of colours. Why the colours? I believe these are purely aesthetic. After all, it is unclear to me just what Ford, Hasbro, and General Mills all have in common. In a more straight data visualisation piece, we might see colour used to classify companies by industry, by growth in share price or market share. Here, however, colour functions in the editorial space to grab the reader’s attention.

The design also makes use of white space surrounding the text, much like the Facebook piece last week, to quiet the overall space above the fold and focus the reader’s attention on the story. Note that the usual layout of stories on the page continues, but only after the fold.

When we keep in mind the function of the piece, i.e. it is not a straight-up-explore-the-data type of piece, we can appreciate how well it functions. All in all this was a really nice treat last Friday morning.

Credit for the piece goes to Karl Russell and Jon Huang.

Facebook’s Share Price Plunge

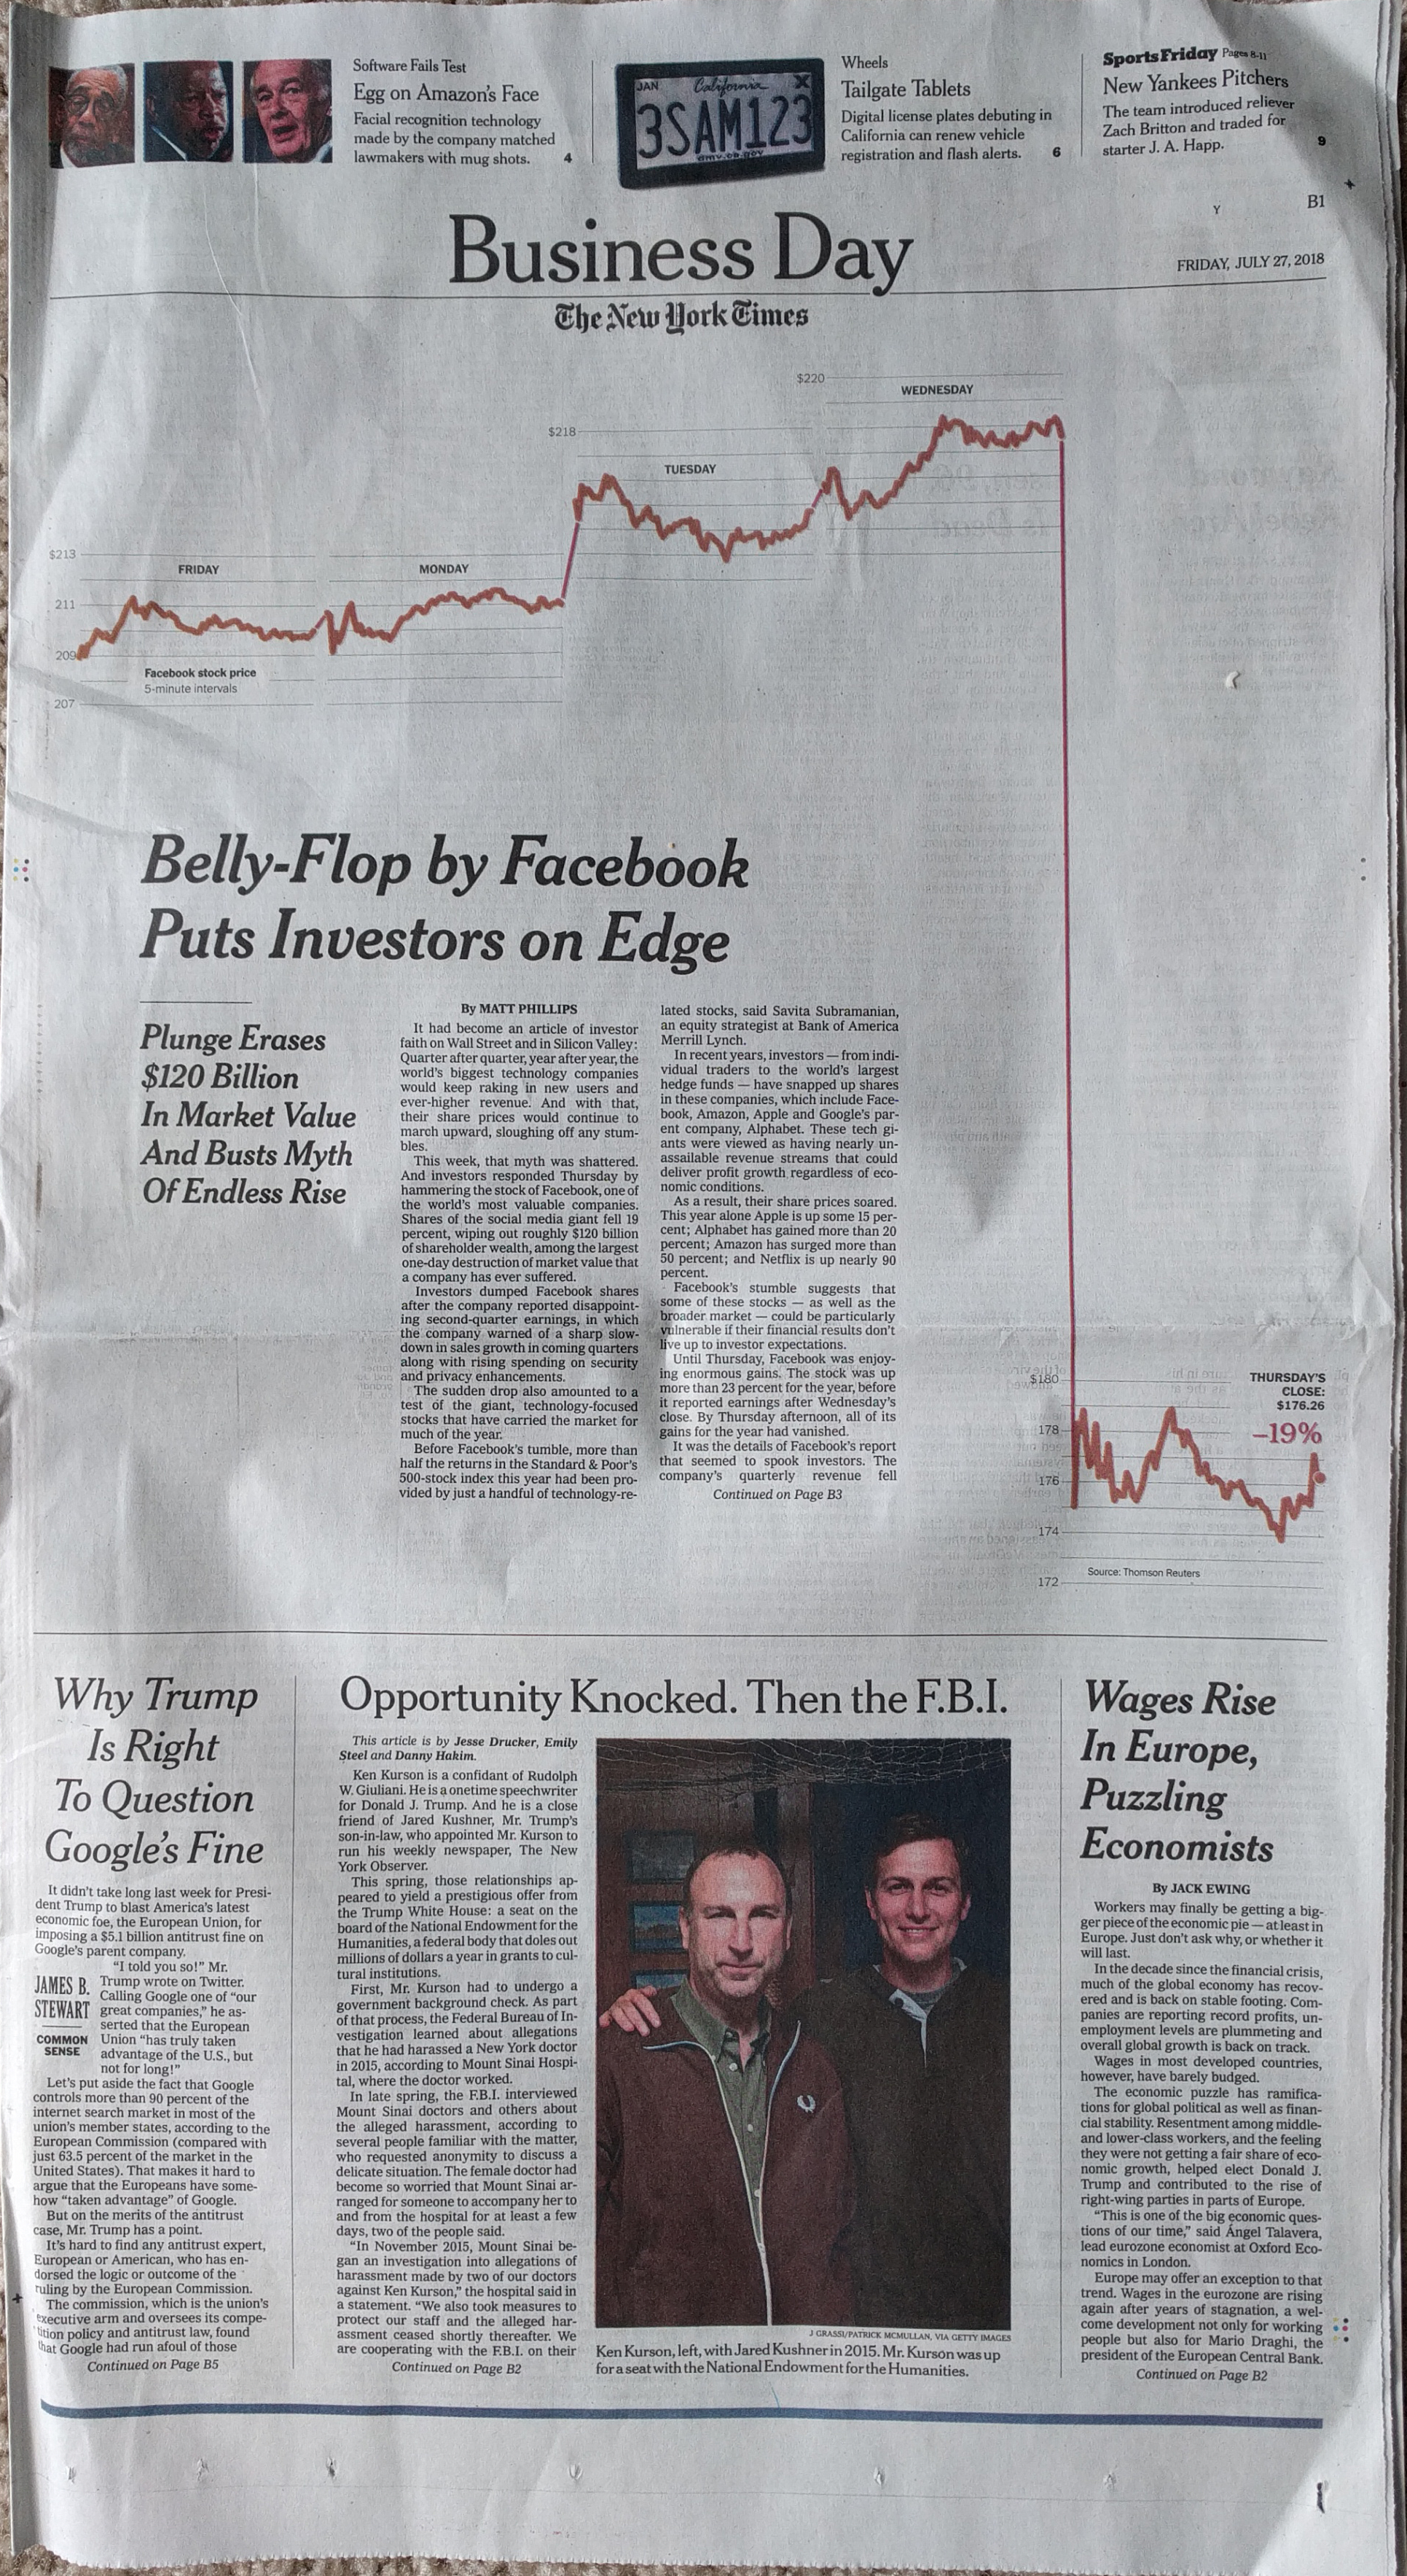
Last Thursday, Facebook’s share price plunged on the news of some not so great numbers from the company on its quarterly earnings report. The data and number itself is not terribly surprising—it is a line chart. But what I loved is how the New York Times handled this on the front of the Business section on Friday morning.

The overall page
The overall page

I found the layout of the page and that article striking. In particular, each day of the share price is almost self-contained in that the axis lines start and stop for each day. I question the thickness of the stroke as something a little thinner might have been a bit clearer on the data. However, it might also have not been strong enough to carry the attention at the top of the page. As it is, that attention is needed to draw the reader down the page and then down across the fold.

Additionally, the designers were sensitive to the need to draw that attention down the page. In order to do that they kept the white space around the graphic and kept the text to two small blocks before moving on to the interior of the section.

Credit for the story goes to Matthew Philips. Although I’m pretty sure the page layout goes to somebody else.

The Evolution of the S&P 500

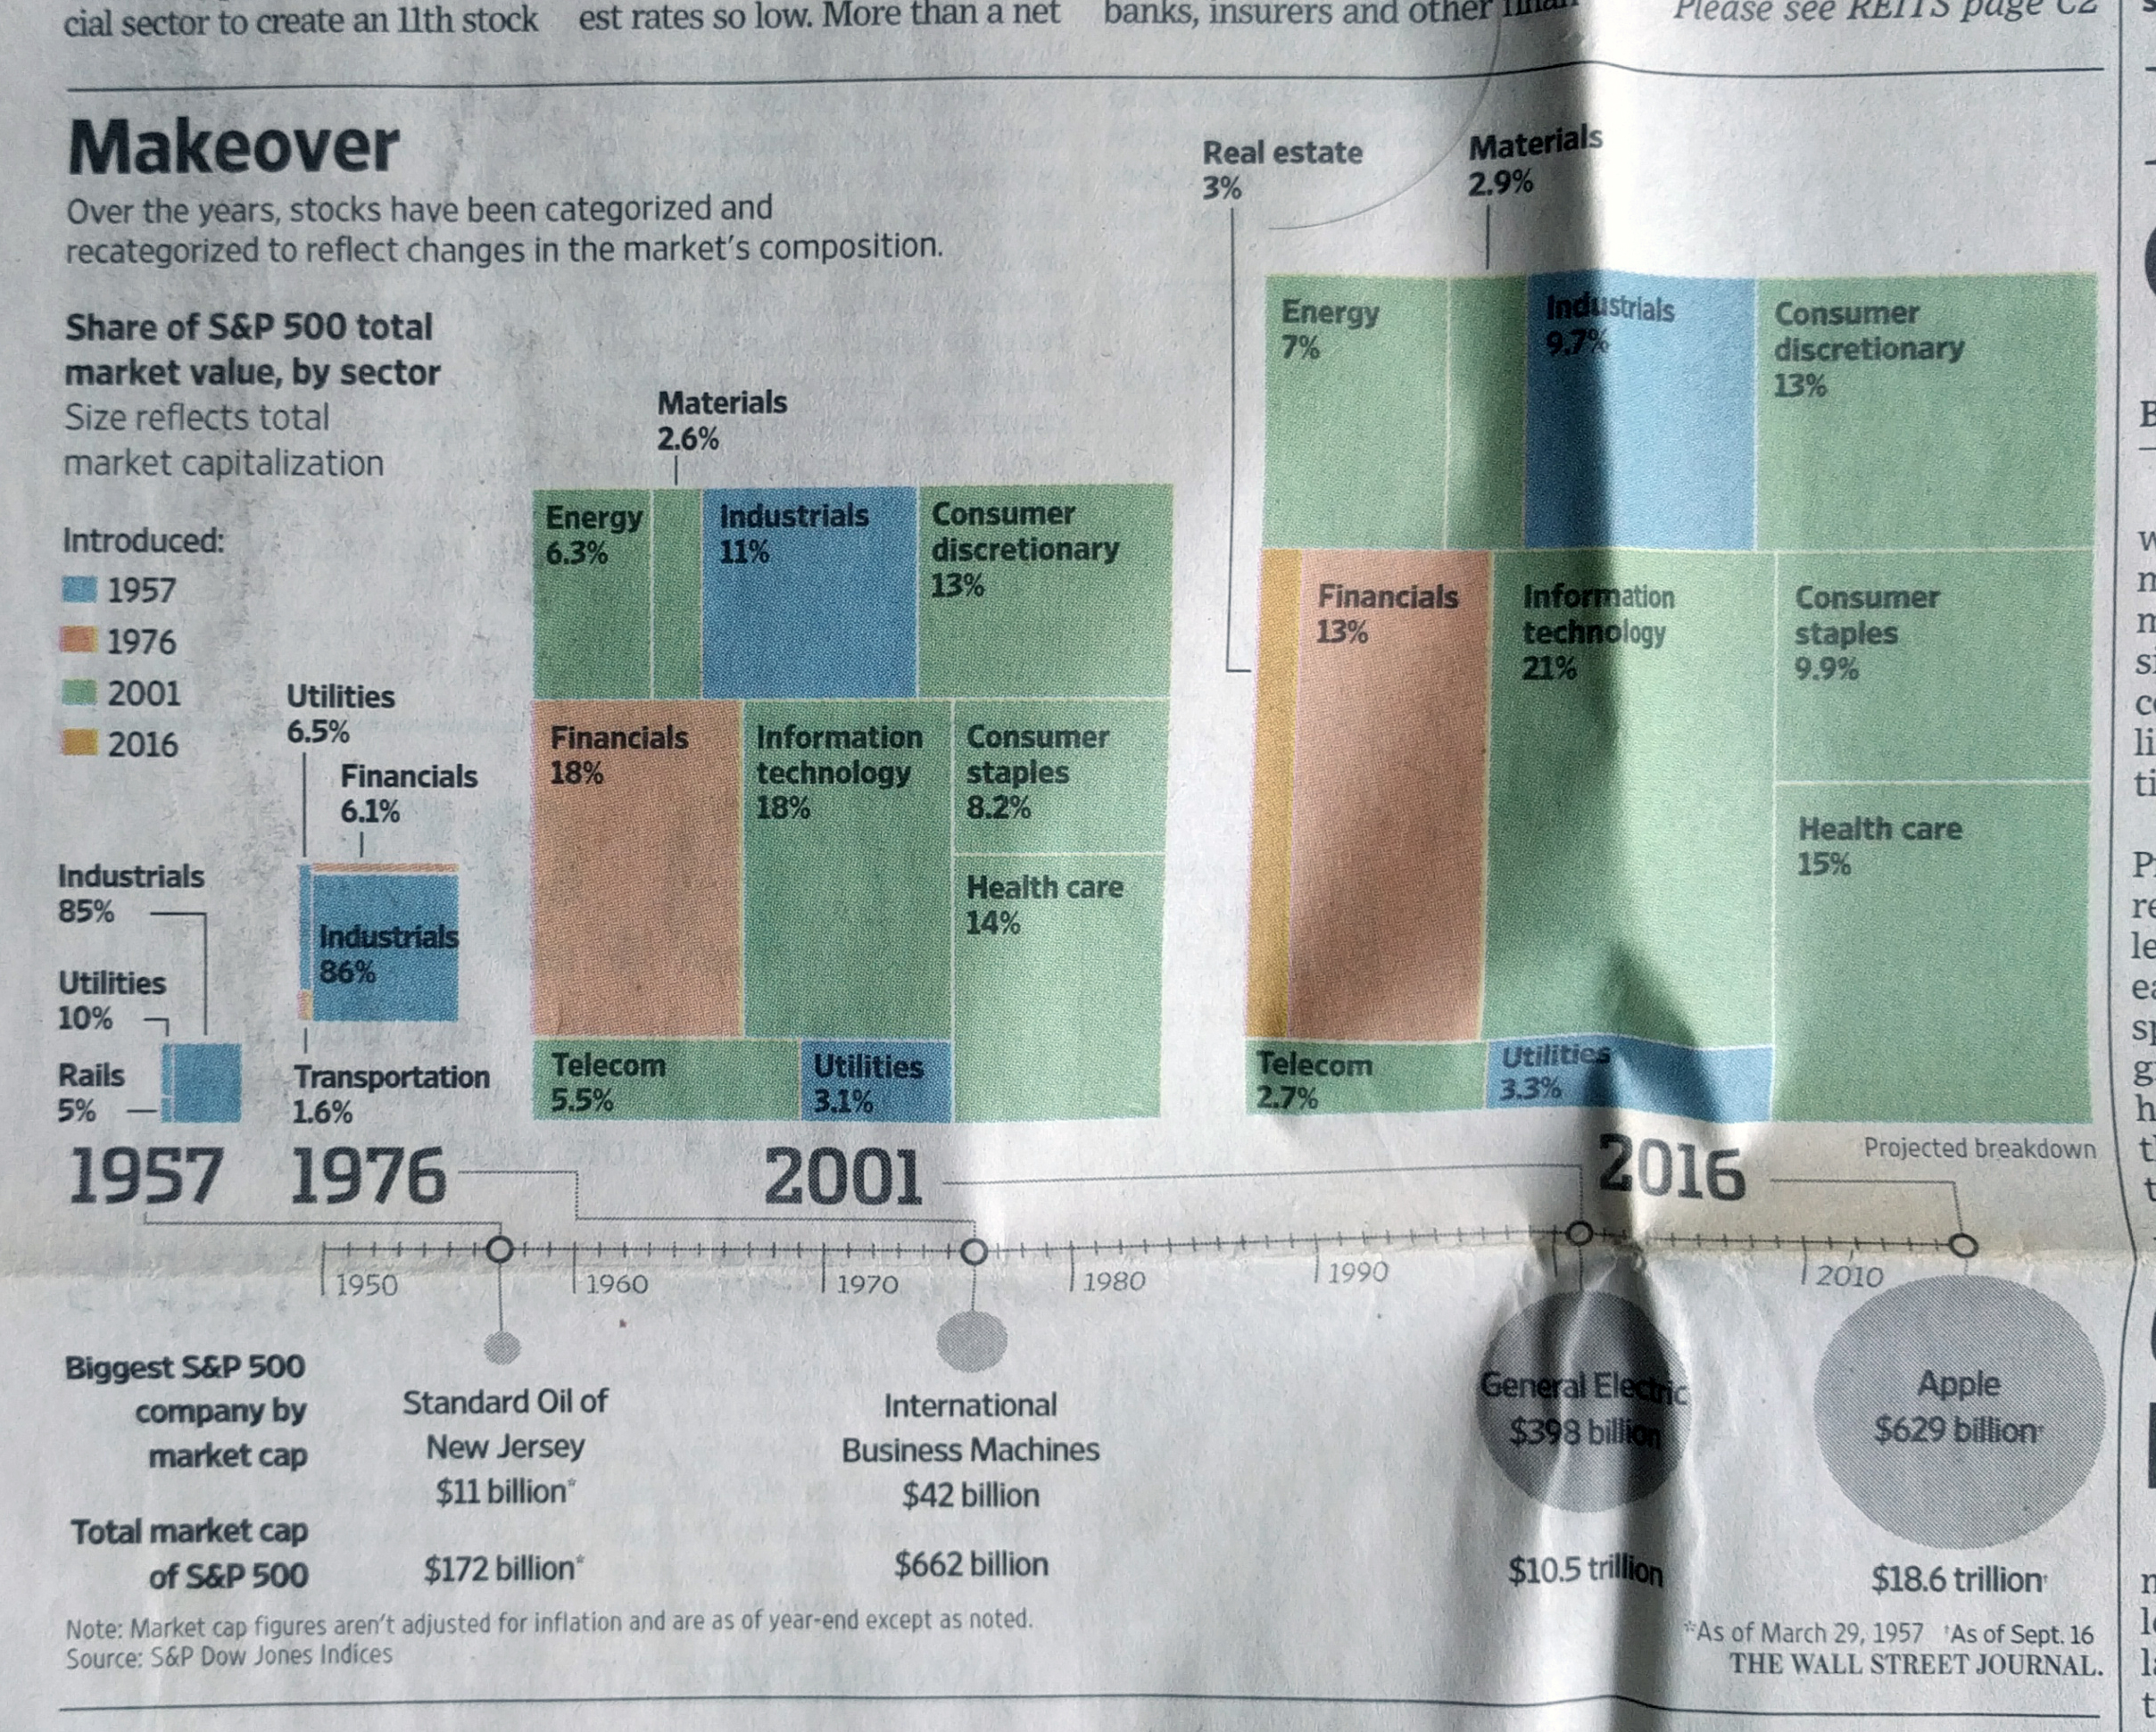
I found myself doing a bit of summer cleaning yesterday and I stumbled upon a few graphics of interest. This one comes from a September 2016 Wall Street Journal article about the changes in the S&P 500, a composite index of American stocks, some of the 500 largest.

In terms of the page design, if it were not for that giant 1/6 page advert in the lower right corner, this graphic could potentially dominate the visual page.  The bulk of it sits above the page’s fold and the only other competing element is a headshot to the upper-right. Regardless, it was clearly enough to grab my attention as I was going through some papers.

The overall page
The overall page

As for the graphic itself, I probably would have some done things differently.

Trees?
Trees?

To start, are these actual tree maps? Or are they things attempting to look like tree maps? It is difficult to tell. In an actual tree map, the rectangles are not just arranged by convenience, as they appear to be here. Instead, they are in descending—or perhaps occasionally ascending—area, within groupings.

The groupings would have been particularly powerful here.  Imagine instead of disparate blue boxes for industrials and utilities in the latter two years that they were combined into a single box. In 2001, that box may have been larger than the orange financials. Then by 2016, you would have seen those boxes switch places—in both years well behind the green boxes of 2001 debuts. If instead the goal was to show the percentages, as it might be given each percentage is labelled, a straight bar chart would have sufficed.

I am not always a fan of the circle for sizes along the bottom. But the bigger problem I have here is the alignment of the labelling and the pseudo-tree maps. One of my first questions was “how big are these years?”. However, that was one of the last points displayed, and it is separated from the tree maps from the listing of the largest company in the index from that year. I would have kept the total market cap closer to the trees, and perhaps used the whole length of line beneath the trees and instead pushed the table labels somewhere between the rather large gap from 1976 and 2001.

Credit for the piece goes to the Wall Street Journal graphics department.

Picking at the Bones

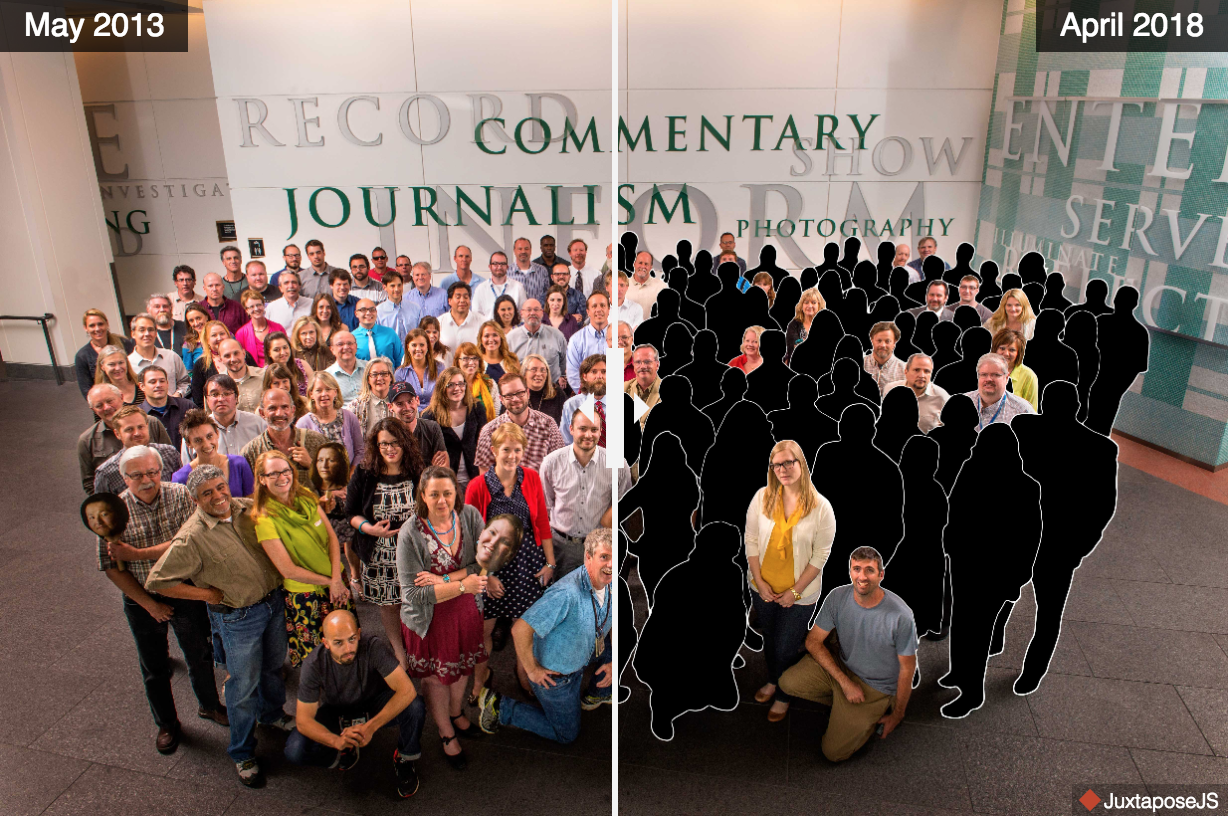
We have all seen the slider that lets you see a pre- and post- or before and after of, usually, the same property, building, landscape, map, &c. Well a few days ago, the Denver Post took the same form and used it to show the before and after of cuts to the staffroom in just five years.

What makes the photo so telling is that in the editorial describing the photo, the paper is successful. But the hedge fund managers of the paper continue to demand cuts to the overhead. And in the journalism environment that often leads to cuts in coverage or quality, and sometimes both. And for the leading—and only large circulation—paper of Denver, that is bad news, pardon the pun, for the community.

Staff before, staff after

What makes the situation worse is that allegedly the cuts are due to poor business investments by the hedge fund, Alden Global Capital, in areas not at all related to the news industry.

Credit for the piece goes to the Denver Post graphics department.

Where to Site Amazon’s HQ2

One of the stories I am interested to work on visualising in that mythical land of free time is a comparison of potential host cities for Amazon’s recently announced HQ2, a second corporate headquarters. In the meantime, I read this piece from the Times that attempted to decide for them.

Where oh where…
Where oh where…

I have some qualms with it, first that it excludes other North American cities—I would not be surprised to see Toronto win the headquarters. I have doubts that Mexico City would work, but it is possible. But my biggest problems are with the exclusionary nature of the selection. That is, within this set, cities that have x. Of the cities that have x, the cities that have y, and so on and so forth.

Personally I suspect Amazon will be looking at which cities not only fit the most requirements, but also which cities will ultimately give them the best business deal. And that I think is a very difficult to describe category.

But it is fun to try.

Credit for the piece goes to Emily Badger, Quoctrung Bui, and Claire Cain Miller.

The Trump Organisation Organisation Chart

Well Christmas is over so now for some of us, it’s time to go back to work. Those of you enjoying your time off through the new year, well…enjoy it.

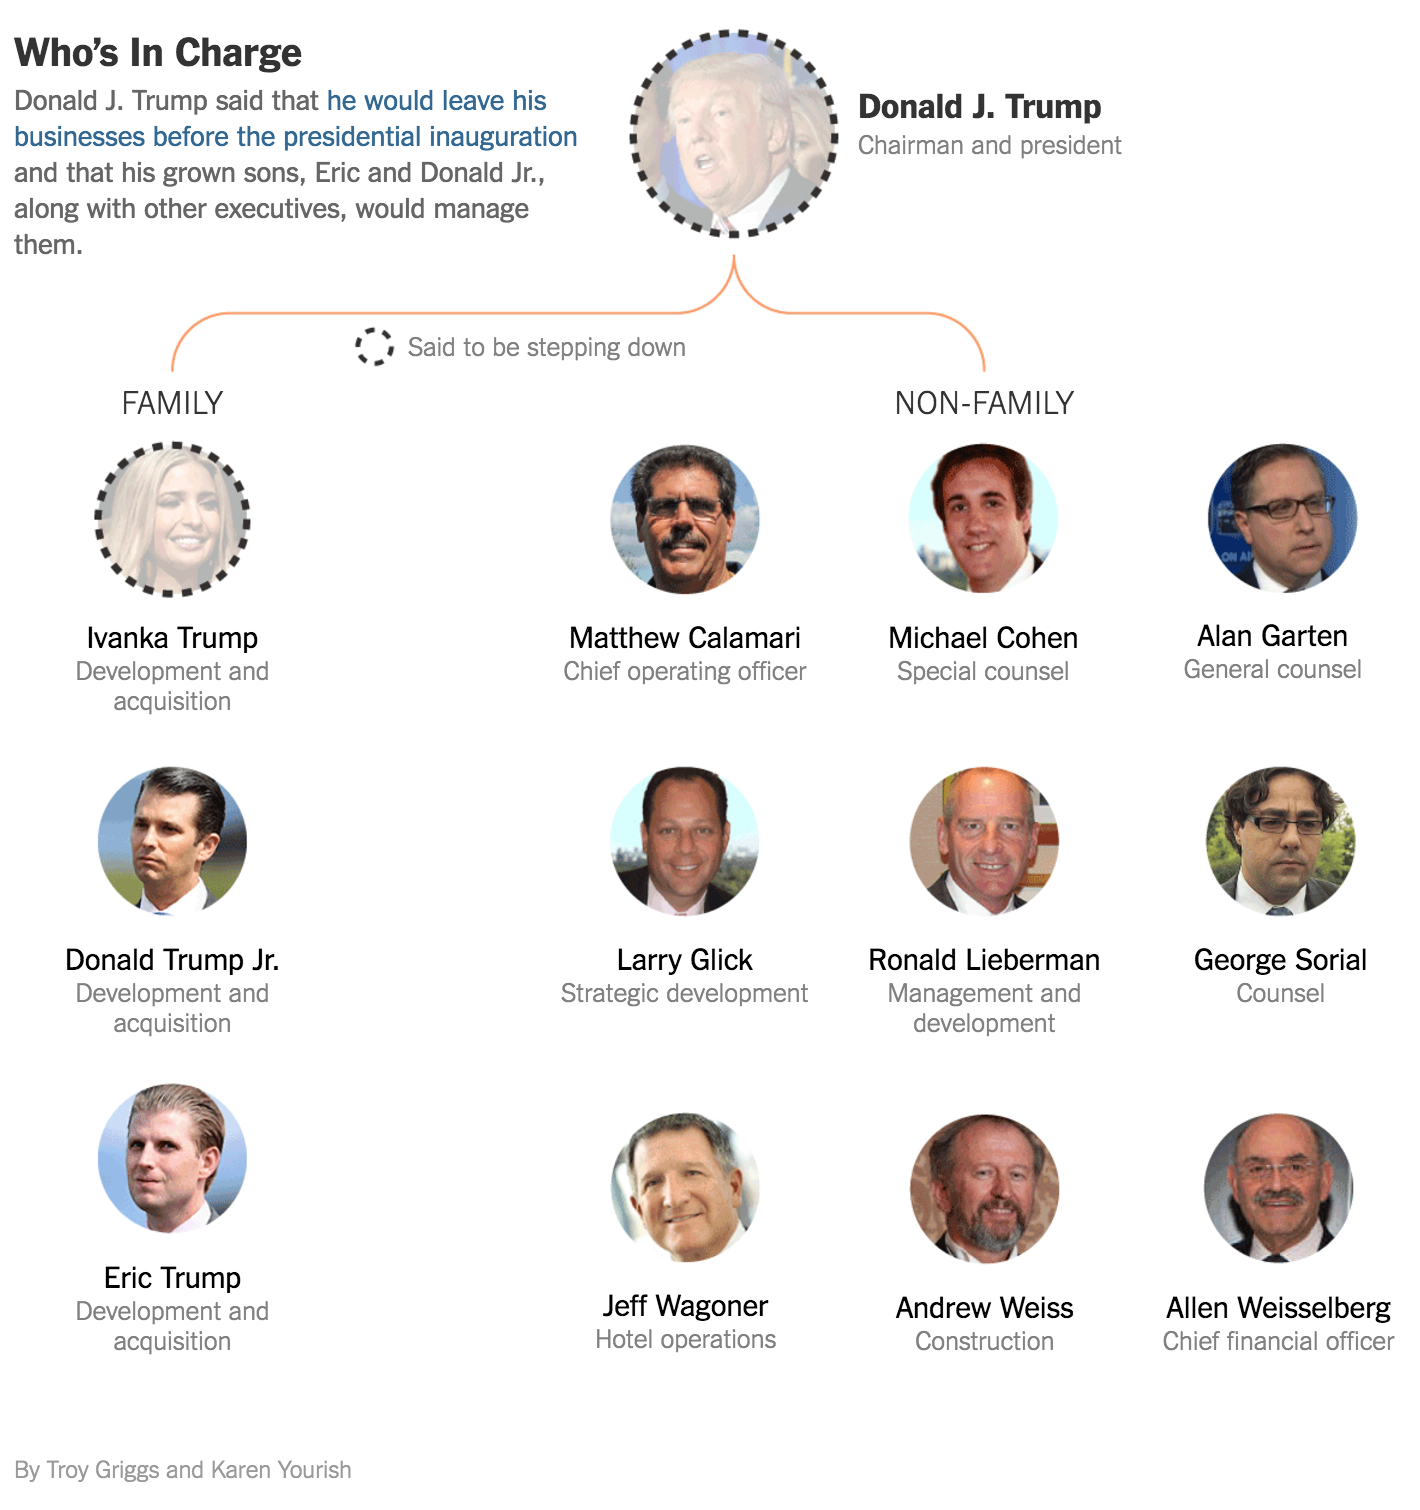
Today’s piece is from the New York Times and explores the structure of Donald Trump’s organisation. A second graphic within the piece then details just what the various parts of the organisation actually do. I found the whole article to be a nice insight into an organisation that will likely be ever more in the news spotlight.

Who runs what
Who runs what

Credit for the piece goes to Troy Griggs and Karen Yourish.

Boston Beer Company

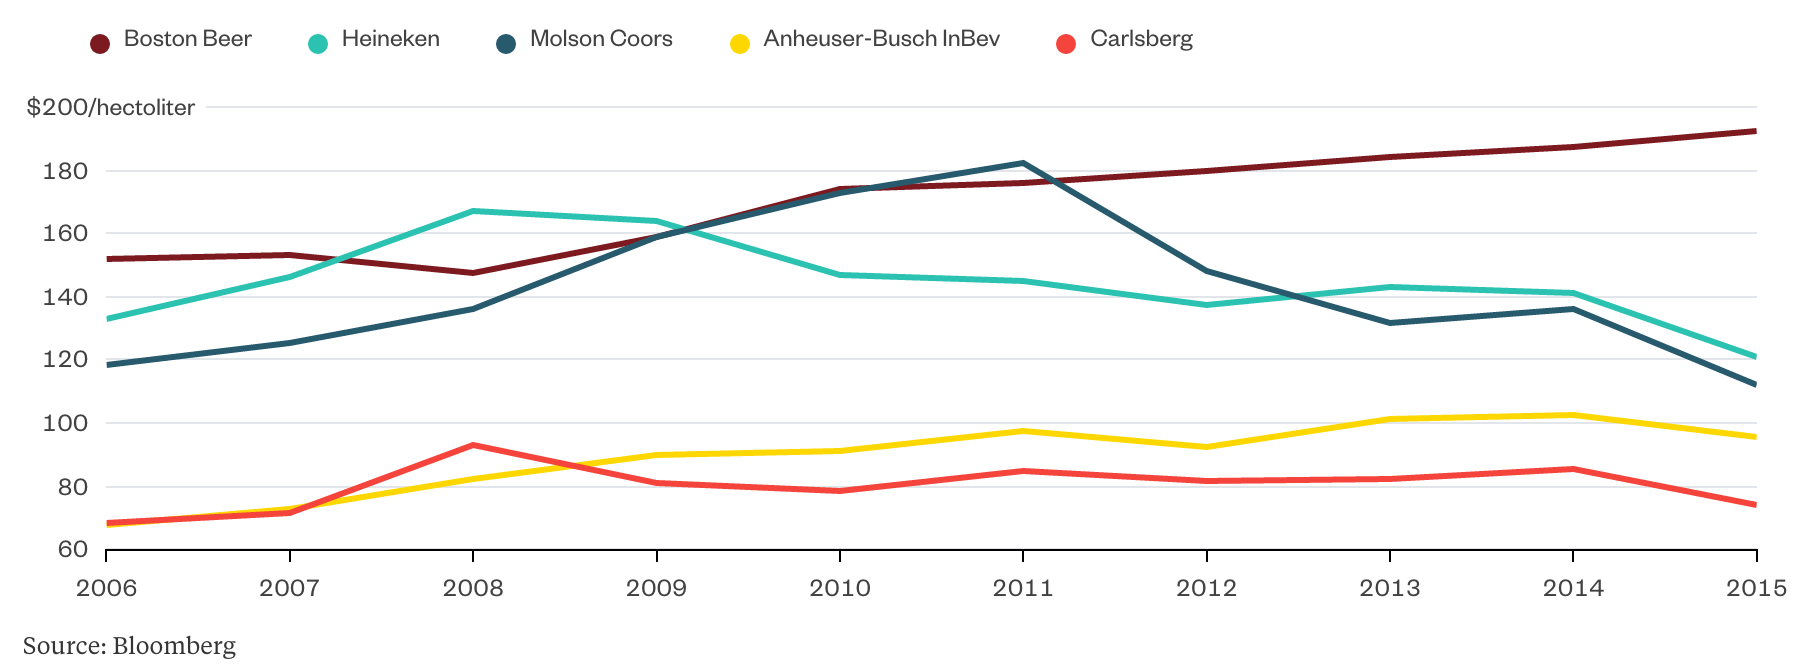
Boston Beer Company is the parent company of Sam Adams, which is definitely one of those beers I imbibe when I visit Boston. But, as one of the larger craft brewers in the United States, it finds itself under immense competition. This article from Bloomberg examines the situation the brewery finds itself in from a share price, growth, and revenue standpoint.

Small but high-margin

Credit for the piece goes to the Bloomberg graphics department.

Tying Up Time Warner and AT&T

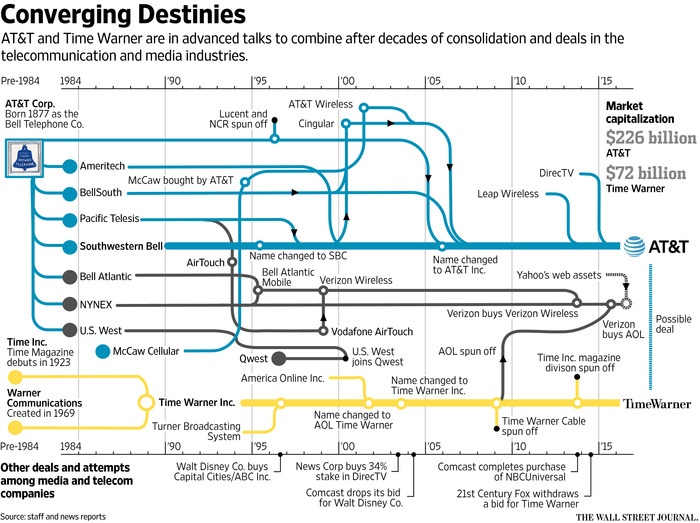
AT&T is attempting to merge with Time Warner in order to have more/better control of a content pipeline. But as this Wall Street Journal article points out, the concept of tie-ups between media and telecoms is not exactly new. Especially since the breakup of the old Bell Telephone company.

Merging Time Warner and AT&T

Credit for the piece goes to the Wall Street Journal graphics department.

Bye Bye, Yahoo

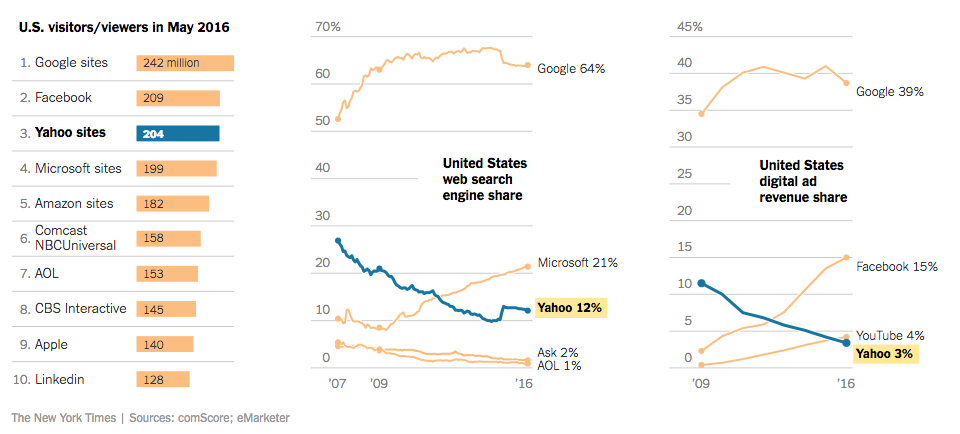
Happy Monday, all. Some big news stories going on today, but I wanted to take a look at this piece from the New York Times. They report on the sale of Yahoo to Verizon for almost $5 billion via a piece that takes short written analysis and blends it with clear and concise charting. The effect is a quickly digestible, but data-driven content piece.

The shares are falling, the shares are falling

Credit for the piece goes to Karl Russell.