Yep, Covid-19 remains a thing. About a month or so ago, an article in City Lab (now owned by Bloomburg), looked at the data to see if there was any truth in the notion that people are fleeing urban areas. Spoiler: they’re not, except in a few places. The entire article is well worth a read, as it looks at what is actually happening in migration and why some cities like New York and San Francisco are outliers.
But I want to look at some of the graphics going on inside the article, because those are what struck me more than the content itself. Let’s start with this map titled “Change in Moves”, which examines “the percentage drop in moves between March 11 and June 30 compared to last year”.

Conventionally, what would we expect from this kind of choropleth map. We have a sequential stepped gradient headed in one direction, from dark to light. Presumably we are looking at one metric, change in movement, in one direction, the drop or negative.
But look at that legend. Note the presence of the positive 4—there is an entire positive range within this stepped gradient. Conventionally we would expect to see some kind of red equals drop, blue equals gain split at the zero point. Others might create a grey bin to cover a negative one to positive one slight-to-no change set of states. Here, though, we don’t have that. Nor do we even get a natural split, instead the dark bin goes to a slightly less dark bin at positive four, so everything less than four through -16 is in the darker bin.
Look at the language, too, because that’s where it becomes potentially more confusing. If the choropleth largely focuses on the “percentage drop” and has negative numbers, a negative of a negative would be…a positive. A -25% drop in Texas could easily be mistaken with its use of double negatives. Compare Texas to Nebraska, which had a 2% drop. Does that mean Nebraska actually declined by 2%, or does it mean it rose by 2%?
A clean up in the data definition to, say, “Percentage change in moves from…” could clear up a lot of this ambiguity. Changing the colour scheme from a single gradient to a divergent one, with a split around zero (perhaps with a bin for little-to-no change), would make it clearer which states were in the positive and which were in the negative.
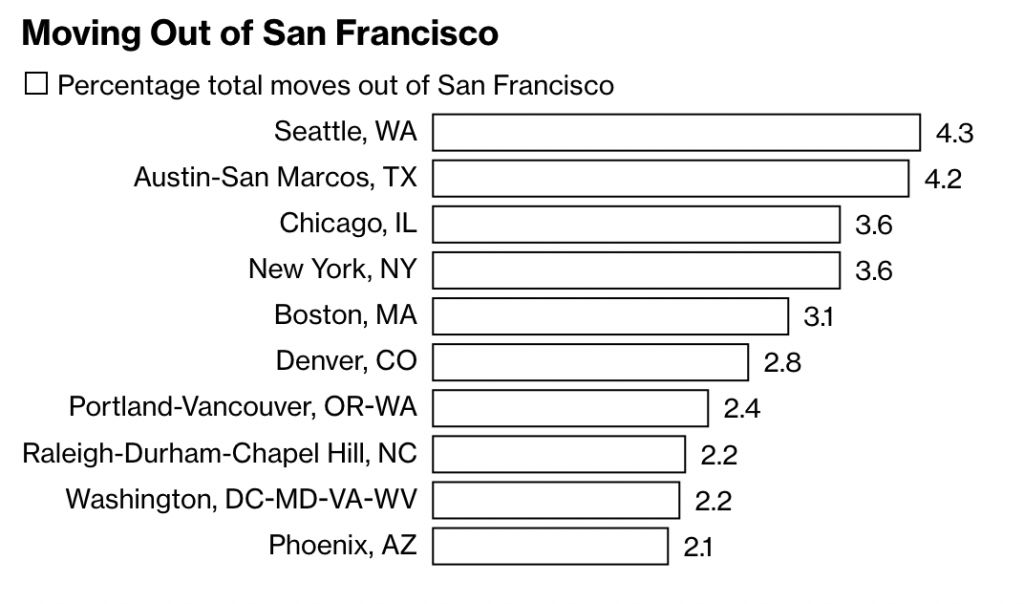
The article continues with another peculiar choice in its bar charts when it explores the data on specific cities.

Here we see the destinations of people moving out of San Francisco, using, as a note explains, requests for quotes as a proxy for the numbers of actual moves. What interests me here is the minimalist take on the bar charts. Note the absence of an axis, which leaves the bars almost groundless for comparison, except that the designer attached data labels to the ends of the bars.
Normally data labels are redundant. The point of a visualisation is to visualise the comparison of data sets. If hyper precise differences to the decimal point are required, tables often are a better choice. But here, there are no axis labels to inform the user as to what the length of a bar means.
It’s a peculiar design decision. If we think of labelling as data ink, is this a more efficient use with data labels than just axis labels? I would venture to say no. You would probably have five axis labels (0–4) and then a line to connect them. That’s probably less ink/pixels than the data labels here. I prefer axis lines to help guide the user from labels up (in this case) through the bars. Maybe the axis lines make for more data ink than the labels? It’s hard to say.
Regardless, this is a peculiar decision. Though, I should note it’s eminently more defensible than the choropleth map, which needs a rethink in both design and language.
Credit for the piece goes to Marie Patino.
