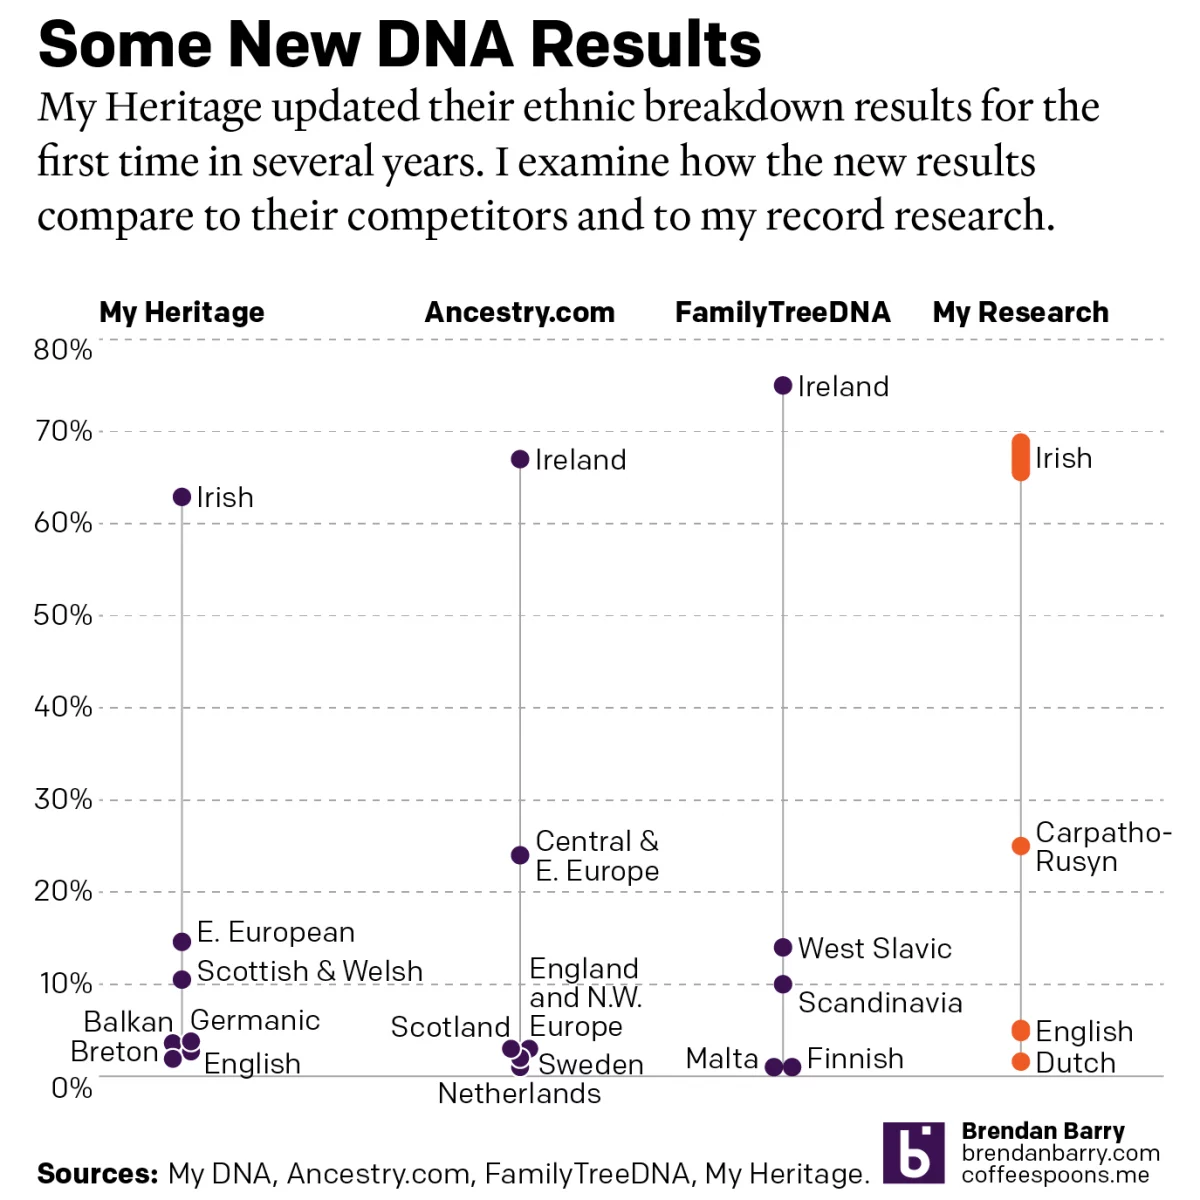
A Refreshed Look at My Ethnic Heritage

Late last week I received an update on my ethnic breakdown from My Heritage, a competitor of Ancestry.com and other genealogy/family history/genetic ancestry companies. For many years, the genealogical community had been waiting for this long-promised update. And it has finally arrived.

For my money, My Heritage’s older analysis, v0.95, did not align with my historical record research—something I have done for almost 15 years now. That DNA analysis painted me with an 85% heritage of Irish, Scottish, and Welsh. Because I have spent a decade and a half researching my ancestors, I know all of my second-great-grandparents, 16 total. 85% means 13–14 of them would be Irish, Scottish, or Welsh. However, four of them are Carpatho-Rusyns from present day eastern Slovakia. And nowhere in my research have I found any connection to the Baltic states or Finland.

Compare that to the update.

Here we have a drastically reduced Irish component that, importantly, has been split from Scottish and Welsh, which now exists as its own genetic group. The East European group appears too low, but perhaps My Heritage identified some of my Slavic ancestry as Balkan—there is a sizeable Carpatho-Rusyn community in Vojvodina, an autonomous oblast in Serbia. Maybe Germanic too? That would start to push it near to 20%.

I do have English ancestry—my Angophilia must come from somewhere—though it is relatively small and I can trace it to the Medieval period. That includes more of the Norman elite than the Anglo-Saxon plebs and so seeing Breton register could be indicative of that Norman/Anglo-Saxon population mixture.

But how does My Heritage results compare to those provided by Ancestry and FamilyTreeDNA, two competitors whose services I have also used. And how does it compare to my actual historical document research?

My Heritage’s newest analysis certainly hits a lot better and is nearer to Ancestry, which aligns best with my research. I do have two questions for my second-great-grandparents. One surrounds Nathaniel Miller, one of whose grandparents (Eliza Garrotson) may not be English but rather Dutch from the Dutch colonisation of the Hudson River Valley in New York south of Albany.

The other question revolves around William Doyle. His mother is identified in the records variously as English and Irish. A family story on that side of the family also suggests one ancestor of English descent. And finally, a recently discovered marriage record for his parents details how his mother (Martha Atkins) was baptised and converted to Catholicism as an adult prior to her marriage. Not all Irish are Catholic, but the vast majority are and that would also suggest Martha was not Irish.

Taking those two questions into account, I have a small range of expected values for my English ancestry and a slightly larger one for my Irish and you can see those in the graphic.

When you compare that to the My Heritage results alongside the Ancestry and FamilyTreeDNA results you can see Ancestry aligns best with my research whereas FamilyTreeDNA aligns the least. My Heritage now falls squarely between the two. And so I consider their update a success. I think the company still has some work to do, but progress is progress.

Credit for the pieces is mine.

Updated DNA Ethnicity Estimates

Earlier this year I posted a short piece that compared my DNA ethnicity estimates provided by a few different companies to each other. Ethnicity estimates are great cocktail party conversations, but not terribly useful to people doing serious genealogy research. They are highly dependent upon the available data from reference populations.

To put it another way, if nobody in a certain ethnic group has tested with a company, there’s no real way for that company to place your results within that group. In the United States, Native Americans are known for their reluctance to participate and, last I heard, they are under-represented in ethnicity estimates. Fortunately for me, Western European population groups are fairly well tested.

But these reference populations are constantly being updated and new analysis being performed to try and sort people into ever more distinct genetic communities. (Although generally speaking the utility of these tests only goes back a handful of generations.)

Last night, when working on a different post, I received an email saying Ancestry.com had updated their analysis of my DNA. So naturally I wanted to compare this most recent update to last September’s.

Still mostly Irish

Sometimes when you look at data and create data visualisation pieces, the story is that there is very little change. And that’s my story. The actual number for my Irish estimate remained the same: 63%. I saw a slight change to my Scottish and Slavic numbers, but nothing drastic. My trace results changed, switching from 2% from the Balkans to 2% from Sweden and Denmark. But you need to take trace results with a pretty big grain of salt, unless they are of a different continent. Broadly speaking, we can be fairly certain about results at a continental level, but differences between, say, French and Germans are much harder to distinguish.

The Scottish part still fascinates me, because as far back as I’ve gone, I have not found an identifiable Scottish ancestor. A great-great-grandfather lived for several years in Edinburgh, but he was the son of two Ireland-born Irish parents. I also know that this Scottish part of me must come from my paternal lines as my mother has almost no Scottish DNA and she would need to have some if I were to have had inherited it from her.

Now for about half of my paternal Irish ancestors, I know at least the counties from which they came. My initial thought, and still best guess, is that the Scottish is actually Scotch–Irish from what is today Northern Ireland. But I am unaware of any ancestor, except perhaps one, who came from or has origins in Northern Ireland.

The other thing that fascinated me is that despite the additional data and analysis the ranges, or degree of uncertainty in another way of looking at it, increased in most of the ethnicities. You can see the light purple rectangles are actually almost all larger this year compared to last. I can only wonder if this time next year I’ll see any narrowing of those ranges.

Credit for the piece is mine.