Earlier, I saw these two graphics floating around the Twitter. They each come from a major financial institution and attempt to place the voting (and non-voting members) of the Federal Open Market Committee (FOMC) on a spectrum of doves to hawks or slightly less dovish. The FOMC, part of the Federal Reserve system, sets interest rates for the US economy. Now, I’m being super simplistic here, but it’s broadly true. I should add, full disclosure, I presently work for the Federal Reserve Bank of Philadelphia.
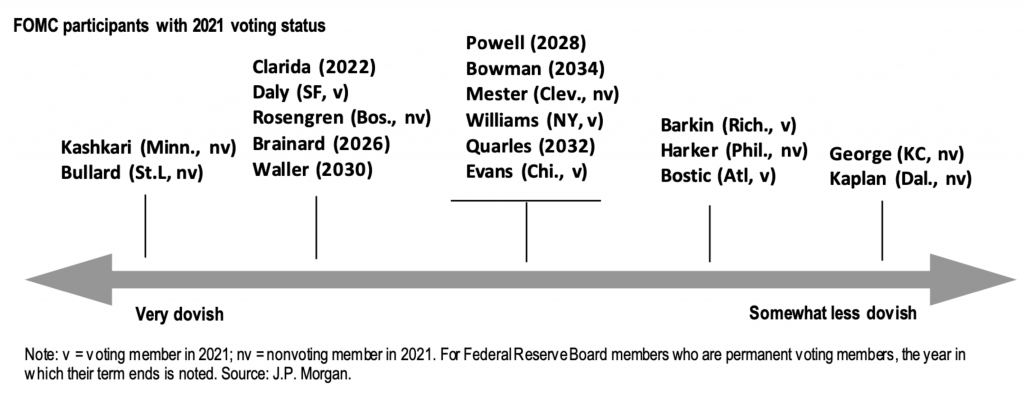
The first graphic is from JPMorgan and plots in one-colour all the voting and non-voting members on a single axis from very dovish to somewhat less dovish. Thin black lines point to evenly spaced points on the axis and people are listed at each interval.

It’s a fairly simple approach, but effective. Nothing revolutionary here. What I find a bit odd is the line underneath the centre tick. What prompts that group to have what I’ll call a summary bar? Is it because Jay Powell, the chair of the Federal Reserve, is placed within that group? It’s a bit unclear.
Now keep in mind the classifications here, very dovish and somewhat less dovish, as we compare JPMorgan’s graphic to that of Bank of America.

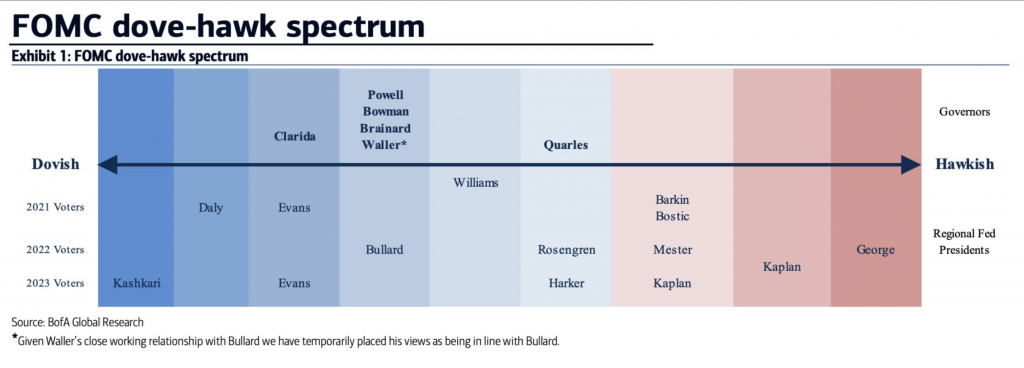
The first thing that strikes me is the use of colour. Here we have a fairly straightforward divergent spectrum of red to blue. Along with other design elements, like typographic scale and contrast for the header, subhead, and labels, this piece strikes me as better designed and more polished.
But I still have questions.
Here we have dovish to hawkish. At the hawkish extreme, we have Esther George of Kansas City and Robert Kaplan of Dallas. In JPMorgan’s chart, both are grouped together as somewhat less dovish. But with Bank of America, they are decidedly hawkish. (Although with nine intervals, the Bank of America graphic has a bit more granularity than JPMorgan’s.)
So the biggest question, unfortunately left unanswered by each graphic, is what defines hawkish and somewhat less dovish? Just by words, they sound not at all alike. But both companies clearly place both individuals at the same end of the spectrum.
Part of the issue stems from the divergence point between red and blue. For most spectra of this type, that would be the demarcation between a committee member who is a dove or a hawk. But we have no similar separation for JPMorgan.
There is, however, one design element for Bank of America’s piece that I really like. My explanation of the FOMC at the top was a bit simplistic. Not every regional Federal Reserve president gets to vote every year. They rotate each year except for New York. These presidents get to vote alongside those on the Board of Governors.
In the graphic, note that everybody above the axis label is a member of the Board, i.e. they get to vote every year until their term expires. Below the axis we have the rotation schedule. Each line represents a bank president who can vote in a particular year. For example, the Philadelphia president, Patrick Harker, was a voting member on the committee in 2020, but falls off in 2021 and will not return to 2023. The Bank of America graphic captures this for each president very well.
I am a bit confused as to why some members, i.e. Kaplan and John Williams of New York, appear to sit between lines. I am unaware of any reasons why they would be between years.
Overall, I prefer the Bank of America piece. It more clearly presents the rotation element of the voting members of the FOMC. Yes, it has colours, but I’m confused as to why the demarcation between doves and hawks happens where it does. And why JPMorgan doesn’t describe anyone as a hawk. So while I prefer it, I think it could still use some additional information or context to make it clearer to readers.
Credit for the JPMorgan piece goes to a designer at JPMorgan.
Credit for the Bank of America piece goes to a Bank of American Global Research designer.

