Frack You, Gas Hole.

And not in the polite Galactica way, but more in the let’s drill you, rocks, and split you open. I could go in further detail about the injection of fracking fluids, but let’s leave the double entendre alone and talk about Marcellus Shale. It’s a layer of rocks in the dirt that contain natural gas. It’s a pain in the gas production industry (sorry) and thus is only economically viable when fuel prices are high.

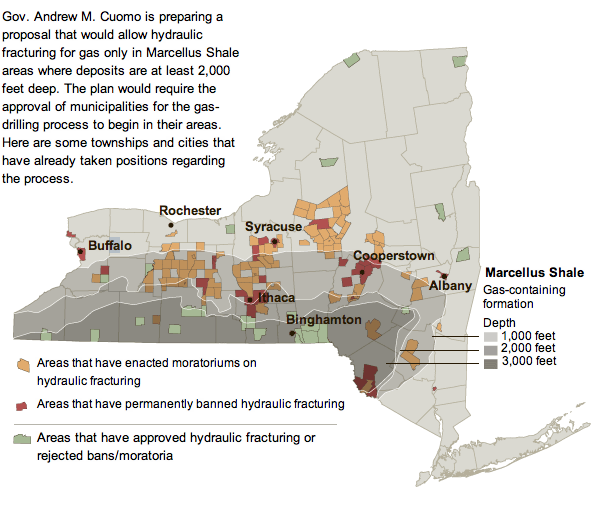
So in the 21st century with high fuel prices, energy companies are hydraulically fracturing (fracking) the rock to suck out all the natural gas. But this might be (probably is) causing environmental problems and thus human health problems. Ergo the controversy. This has now reached New York and so the New York Times created a simple map with some key layers of information to explain the controversy there.
NY Marcellus
NY Marcellus

Note the useful layers of depth of the shale and where those intersect (or do not) with areas that have banned or endorsed fracking.

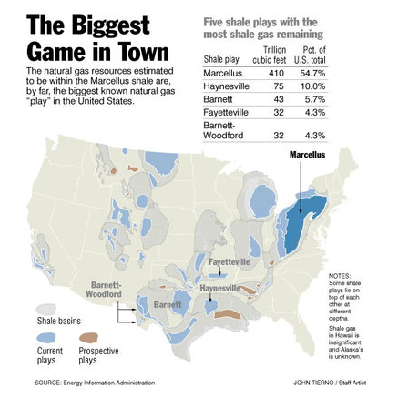
Western Pennsylvania has had similar problems, and the Philadelphia Inquirer has had an interactive special on their website up for a little while now. And by interactive infographic I mean largely just a play-through of static images. Unfortunately, the online content is not of the best resolution and leaves much to be desired. Fortunately the graphics would appear to be quite informative especially as part of a series. A pity they are not entirely legible.
Location
Location

Credit for the Inquirer piece goes to John Tierno.

God Save the Queen

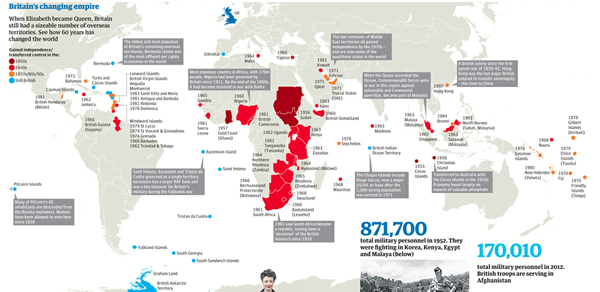
For the Queen’s Jubilee I had been looking for a good infographic or two about how the United Kingdom had changed over the length of her reign, at least thus far. Alas, I found not a great deal of substantial work. This is an infographic from the Guardian that looks at quite a few single figures.

But it also has a map looking at the decline/unravelling of the British Empire.

Decline of the British Empire

God Save the Queen.

The Education Gap

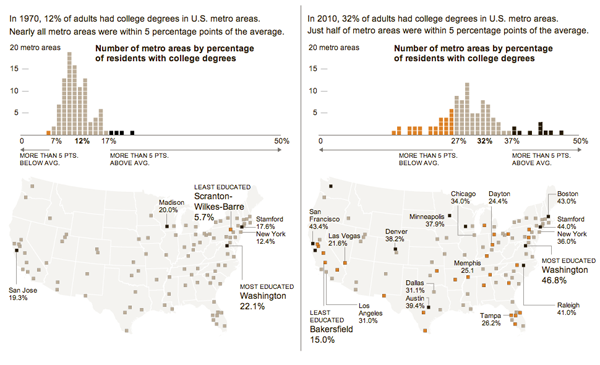
Last week, the New York Times looked at the growing education gap amongst this country’s largest metropolitan areas. The infographic, click the image below to go to the full version, is perhaps a bit more layered, nuanced, and complex than it looks at first. In about forty years, the number of adults with college degrees has doubled, good, but so too has the spread of those numbers across the set of cities, bad. And then to look at any geographic spread, the two datasets are mapped geospatially. By my eye, the Northeast and Pacific Northwest seem to be doing fairly well. Not so much around the rest of the country.

The education gap
The education gap

Credit for the piece goes to Haeyoun Park.

New York Times Lies About Science

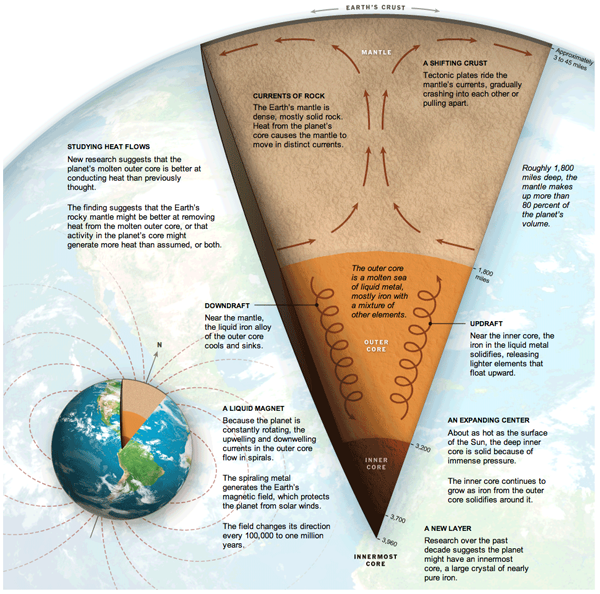
In a rare infographic misstep, the New York Times published an incorrect diagram detailing the centre of the Earth.

Centre of the Earth
Centre of the Earth

Clearly, anyone who knows anything about science knows that it is not a solid core of iron at the centre of the Earth, but dinosaurs. And I see no dinosaurs in this diagram.

Credit for the piece goes to Jonathan Corum, Ritchie S. King, and Frank O’Connell.

Canada Invades the Land of the Mole People

Subways. Home of the mole people. And in the United States an unwanted recipient of government money to build things. Along with being generally unwanted. By those who do not live in cities. Probably because of said mole people. Or something.

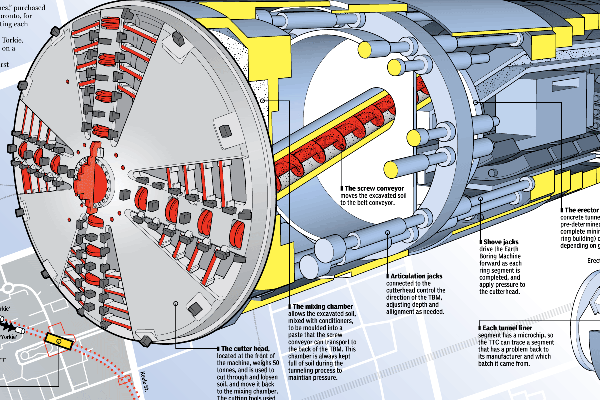
But in Canada, they like subways. At least enough that Toronto is building an extension to a university and from there to a suburb. But the invasion of the mole people homeland is a complex process that, fortunately, the National Post explains in an illustrative infographic, a cropping of which is below.

One of four sibling boring machines: Holey, Moley, Yorkie, and Torkie.

Credit for the piece goes to Mike Faille and Peter Kuitenbrouwer.

Nope, It’s Just Clouds in the Shapes of Birds and Planes.

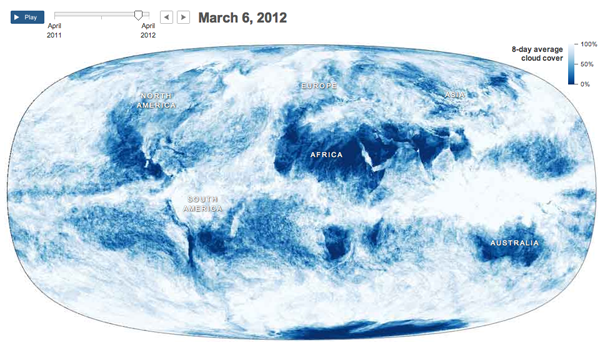
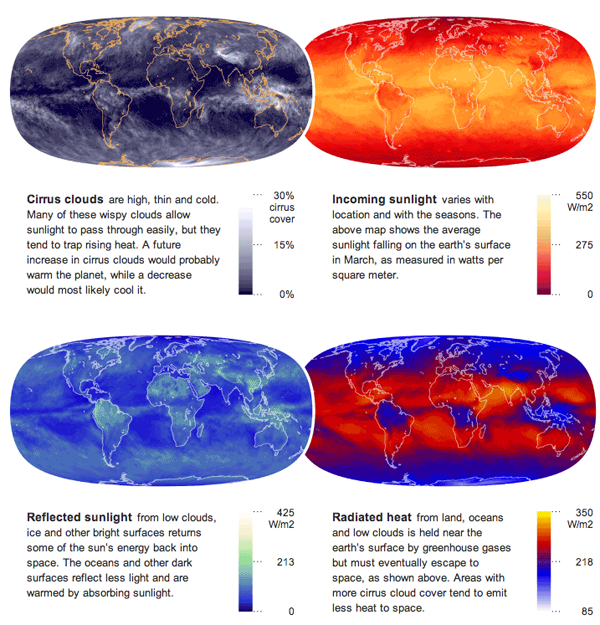
Supporting an article about how the clouds are the last great hope for the climate change skeptics, the New York Times published an interesting infographic that looks at cloud cover and insolation, the amount of solar energy that irradiates the planet.

The main feature is an animation of a year’s worth of cloud cover. The mapped data begins to clearly show the difference between air circulation over the oceans and over land, with the interface between the two creating the rough outlines of the continents.

Cloud map
Cloud map

Supplementing the animation are four small multiples of different measures that look at energy and its conservation across the planet.

Energy maps
Energy maps

Credit for the piece goes to Jonathan Corum.

Exporting the Sun

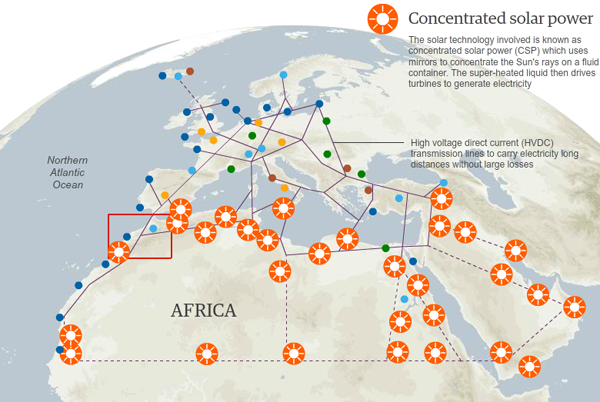
Plans are afoot to harness the power of the sun in the deserts across northern Africa. The electricity generated in Morocco is planned to turn on light switches in Madrid and throughout the rest of Europe.

The Guardian created a map to show how the solar facilities could be connected to each other and to other renewable power sources in Europe—from Icelandic geothermal plants to North Sea wind turbines to Alpine hydroelectric plants.

Renewable Power Map
Renewable Power Map

Credit for the piece goes to Christine Oliver.

The Bottom of the Ocean (and the World)

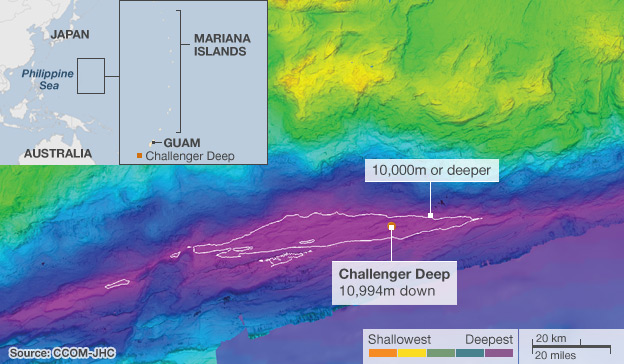
There have been a lot of interesting maps of late that map out continents and planets, but today is one for the sea—the bottom of which we know less about than the surface of the Moon.

According to a story covered by the BBC, the US State Department backed an exploration of the Mariana Trench, a subduction zone where one oceanic plate is slipping underneath another. The result is an inward-folding crumple and then a bunch of volcanos—the Mariana Islands. The US wants to know if it can extend its economic zone further, but can only do so if certain geographic conditions are met. Hence, the study.

The topography of the Mariana Trench at Challenger Deep

Challenger Deep is the deepest, lowest point on the planet. Though one can argue that because the Earth is not a perfect sphere, points in the Arctic and Antarctic may yet be deeper/nearer the centre of the Earth. If one were to Mount Everest, the tallest mountain on the planet, inside the Mariana Trench at Challenger Deep, the very tip of the mountain would still not break the surface of the ocean.

Rule, Britannia

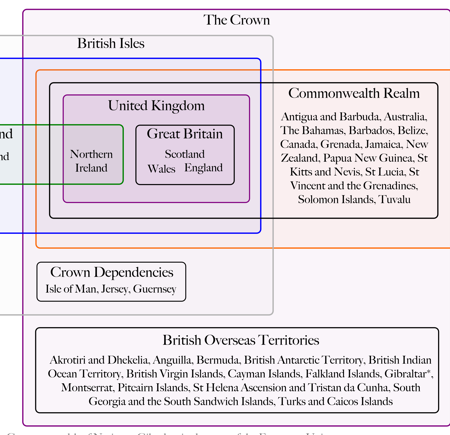
The United Kingdom. England. Britain. All pretty much mean the same thing, right? No. But, if you do not believe me, might I recommend going to Glasgow or Edinburgh and calling a local an Englishman. It may very well be a quick education.

Colin Grey attempts to untangle the constitutional and jurisdictional mess in both a video and an accompanying chart. The video takes about five minutes and is largely correct with most of the errors I have picked up on being rather small in nature, e.g. Ireland is not the Republic of Ireland but just Ireland…not a big deal unless one wants to be enraged by minutiae.

The chart is simple and effective in delineating the structure of the UK and expands about how the UK fits into Europe.

Breaking Down the United Kingdom

Credit for the piece is to Colin Grey and thanks to Kim Nguyen for the tip.