Who Has Won the Tour de France

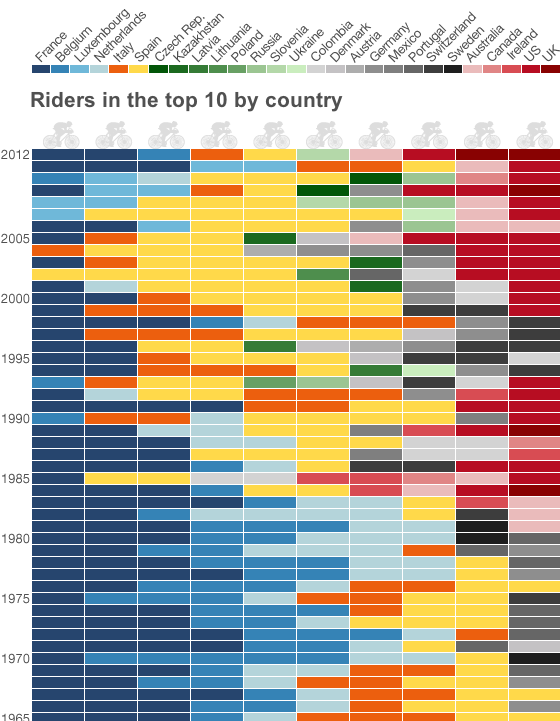
Bradley Wiggins won the Tour de France over the weekend; he is the first Briton to do so since the Tour began in 1903. (But to be more accurate, Wiggins was born to an Australian man and English mother in Belgium.) Naturally the BBC covered this topic in an infographic focusing on the nationality of those who finished in the Top-10 of the Tour over the course of its history.
Historical Performance

Except when I first saw this I was confused. So far as I understood, the Tour is not run by individuals (as in the Olympics) or by national teams (as in European “football”). Rather, it is more like Formula 1 racing with individuals as part of a corporate team. So naturally I expected to see which teams had won. Instead I was looking at “by country”.

This I then figured meant by position within the Top-10 as each person/position is clearly segmented. That sort of made sense as I looked at the first few rows and saw red (America) and I recalled the success Lance Armstrong enjoyed. But that sense fell away when I reached the end of the list that should have had Frenchman in the top. It turns out that the legend for the piece dictates the order of the nationality of the winners of the Top-10 without respect to their actual placement. That perhaps could be a bit clearer.

The colours sort of make sense as groupings of countries. Blue groups the Benelux + France whereas red groups English-speaking countries. Orange for Italy and yellow for Spain while green groups former Soviet states and grey/black appears to be a collection of the rest.

Further down the rows, I ran into a smaller problem in that the number sequence seemed a bit out of sorts. The Tour was cancelled during the World Wars, but no mention of that is made in the graphic itself.

A worthwhile graphic—after all who does not want to see their country winning?—but its labelling could stand a bit higher finish.

Your Central Visual Field

From XKCD comes an informative infographic about your central visual field. As always, it’s quite informative. It’s not quite light hearted for Friday, but you’ll probably get an odd look or a laugh when you move your face really close to your monitor…

Central Visual Field

Also as always, credit for the piece goes to Randall Munroe.

2012 Olympics: What Makes a Winner (and Will the UK Be One)?

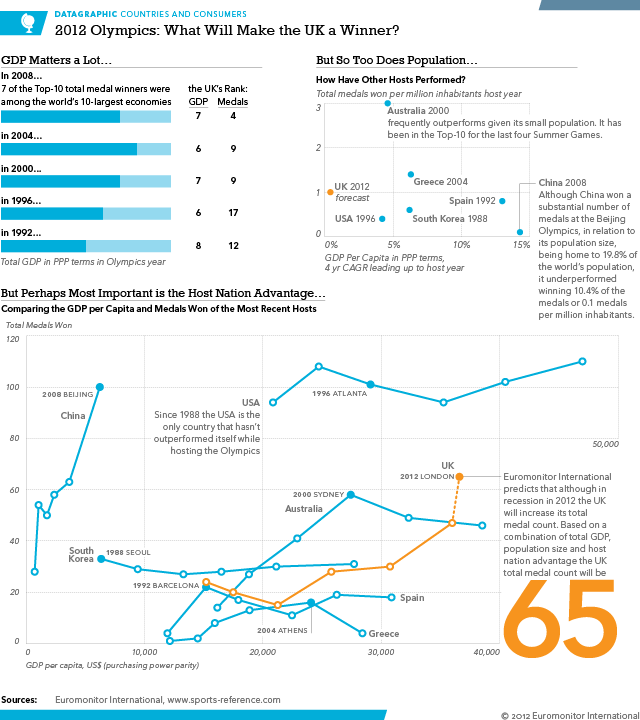
The Olympics are coming, the Olympics are coming. (As if you didn’t know.) In a rare moment of seeing my work outside of my company’s paywall, I can post a few infographics I have created for the 2012 Summer Games in London. The series looks at a few different non-Olympic variables like GDP per capita and mean BMI and sees whether they impact total medal counts in the Olympics.

This first datagraphic (to use my company’s internal language) looks at what makes a winner and will the UK be one this summer. The main chart in the piece compares GDP per capita performance to total medal count in each Olympic year from 1988 to 2008. And yes, we are predicting the UK to win a total of 65 medals this summer.

What Makes an Olympics Winner

In the interest of full disclosure, I work as the senior graphic designer for Euromonitor International. This series was not intended to be used as part of marketing/promotional piece (I probably need to include the link to download that document here), but instead I designed them all as client-only content. But since others decided to use my work as marketing material, I am fortunately allowed to share it with all of you via my blog. So yeah, that’s pretty cool. Enjoy.

USS Iowa

Battleships are cool. Pointless in the 21st century, but they’re still cool. And now the USS Iowa is open as a museum in Los Angeles. Around the opening of the museum earlier this month, the LA Times put together a few graphics that were collected in one infographic piece that illustrated some of those parts of the ship open to the public. But what’s cooler than the guns that fire shells as big as trees (wrong ship in the song, but the point stands).

The turret
The turret

Credit for the piece goes to Tom Reinken, Raoul Ranoa, and Anthony Pesce.

England and Wales: 500k More People Than Expected

Census data fascinates me from a data visualisation perspective; one can look at it so many different ways. Last week I looked at some of the Slovakian census data on the Carpatho-Rusyns that live in the northeastern mountains of Slovakia. But yesterday, the British Office of National Statistics released the results from their census of England and Wales (Scotland reports later and Northern Ireland did so already, yay devolution.) One of the big news stories was that England and Wales had 500,000 more people than had been expected. That doesn’t sound like a lot of people, but to put it roughly into American proportions, that would be like finding that there was a whole new city the size of Chicago somewhere in the United States.

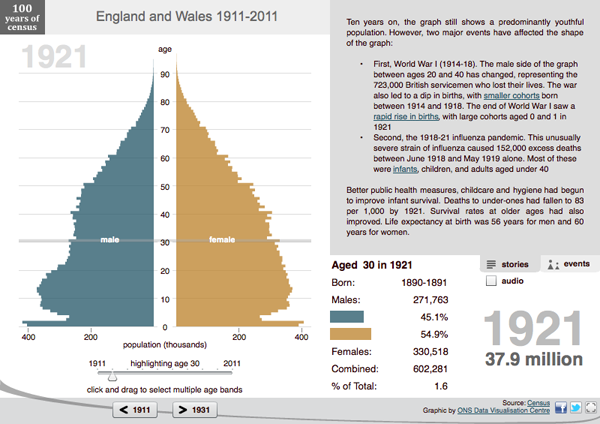
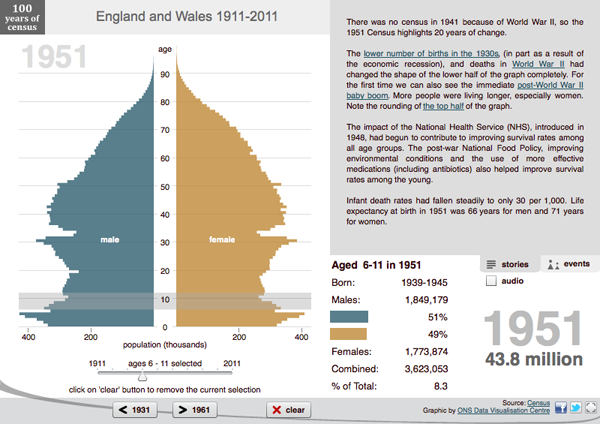
But while many organisations and individuals will certainly be looking at the census data in the coming days, weeks, and months, the ONS released its own interactive application. Basically it looks at the population pyramid for England and Wales from 1911 to 2011, a century’s worth of data. But what makes this different from the GE population pyramids, for example, is the context that the ONS has added that strict data pulls lack.

1921 pyramid
1921 pyramid

Here in 1921, rolling over a particular cohort reveals the details of those aged 30 in 1921. There is a clear difference between the number of men and women. But why? The text block’s first note details how 700,000 men aged 20–40 died during World War I and thus altered the basic structure of the English and Welsh population.

1951 pyramid
1951 pyramid

And in 1951 we begin to look at the British baby boom in the post-war era. Again, while the Baby Boom might be expected, the ONS also points out that the NHS, the British National Health Service, had also recently started and was positively affecting life expectancy and the general health of the British public. These are again things that would not likely appear in more data-focused pieces.

But everybody loves to compare things to other things. So, the ONS also released a more data-focused application that allows the user to select two different census geographies and compare them. This is more as one would expect, comparing overlays vs. side-by-side looks at different population pyramids. The example below compares London to Birmingham.

Credit for the pieces go to the ONS Visualisation Centre.

How Fat Are You?

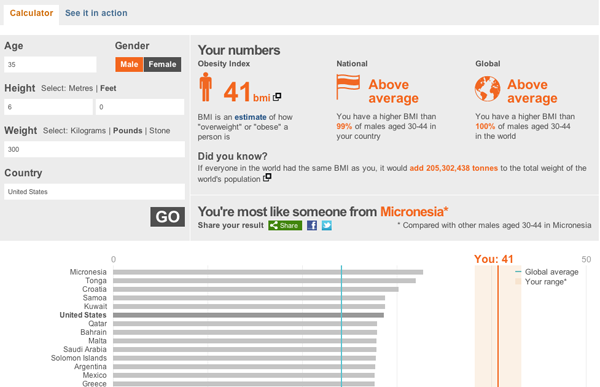
The BBC is letting you see how fat you are. They take inputs of age, weight, gender, and then your country of residence to compute your BMI and compare that across multiple countries for which the data exists. It compares you to your national average and then provides a country whose average best fits your BMI.

BMI comparison
BMI comparison

My 300lb., 6’0″ avatar is apparently overweight. And most like someone from Micronesia.

Rusyns of Slovakia

The Slovakian government has published the results from its 2011 census. The census looked at many things, including nationality and language. This should allow the government in Bratislava to better fund and support the ethnic minorities in Slovakia.

Of course, some of my ancestors were one of the small ethnic minorities in Slovakia. Ergo, I have a personal interest in the data. The result is a quick infographic about the Carpatho-Rusyns of Slovakia. Click on the cropping below to learn more, meaning, see a bigger and fuller version.

Cropping of the Rusyns of Slovakia

Credit for the work goes to me. For the data, the statistics office of Slovakia.

It’s Been Hot

In case you missed it, the weather the past few weeks has been hot across much of the United States. Last week the Washington Post published an infographic on temperatures in the District of Columbia.

It's Been Hot
It's Been Hot

As it turns out, it has been hot. But it appears that in mid-June a few years ago, the temperature was below 70 degrees. Why can we not have some of that?

Credit for the piece goes to Todd Lindeman.

Blowing Things Up (Or Shooting Them Down)

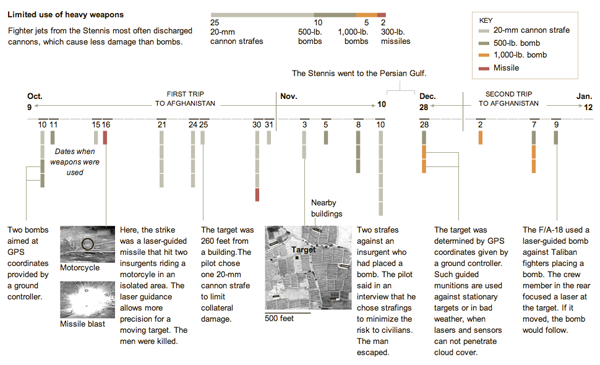
After an odd two short weeks—imagine two weeks with each only having a Monday and a Friday—we (in the royal sense of I) are back to the routine. So what better way than to look at American awesomeness in blowing things up. Through air strikes launched from US aircraft carriers.

This graphic comes from the New York Times and looks at the changed nature of air warfare in Afghanistan. No longer are US fighters dropping bombs all over the place—during the early days of the war, aircraft would take off laden with so many bombs that they needed to drop some before returning to the carrier—instead they use cannon fire and use it far more sparingly.

Carrier strikes
Carrier strikes

Credit for the piece goes to Sergio Peçanha.

Venn Diagrams. Let’s Go Back to Grade School.

Last week Mitt Romney’s campaign released a series of infographic adverts. They were Venn Diagrams with messages attacking President Obama by highlighting what the Romney campaign called gaps between what the president has said he would do and what he has in fact done.

Debt Gap
Debt Gap
Deficit Gap
Deficit Gap
Healthcare Gap
Healthcare Gap
Unemployment Gap
Unemployment Gap

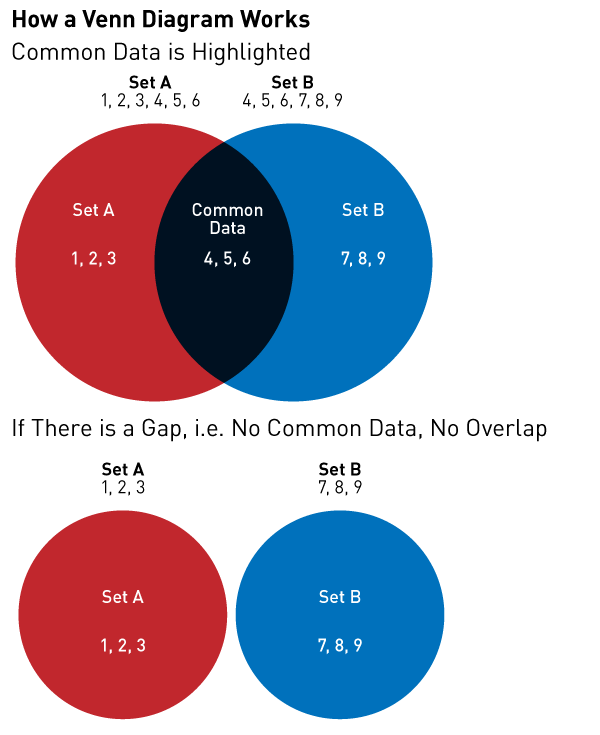
The problem with these is that they are all wrong. Do not misunderstand me, the Romney campaign certainly has valid points in these statements. And to use an infographic to communicate their points is a valid approach. But whoever designed these adverts clearly did not know how a Venn Diagram works.

Here is a brief refresher course for those interested.

How Venn Diagrams Work

Unfortunately, the Romney campaign’s message is being lost in a failed medium. It’s like watching a clown give a doctoral thesis in rocket science. He sure might be making a good point. But it’s a clown. People laugh at clowns. People won’t take the clown seriously. The Romney campaign is making good points, but that message is being lost because the campaign cannot master one of the simplest types of charts.

Credit for the originals go to the Romney campaign. The bit on How Venn Diagrams Work is mine.