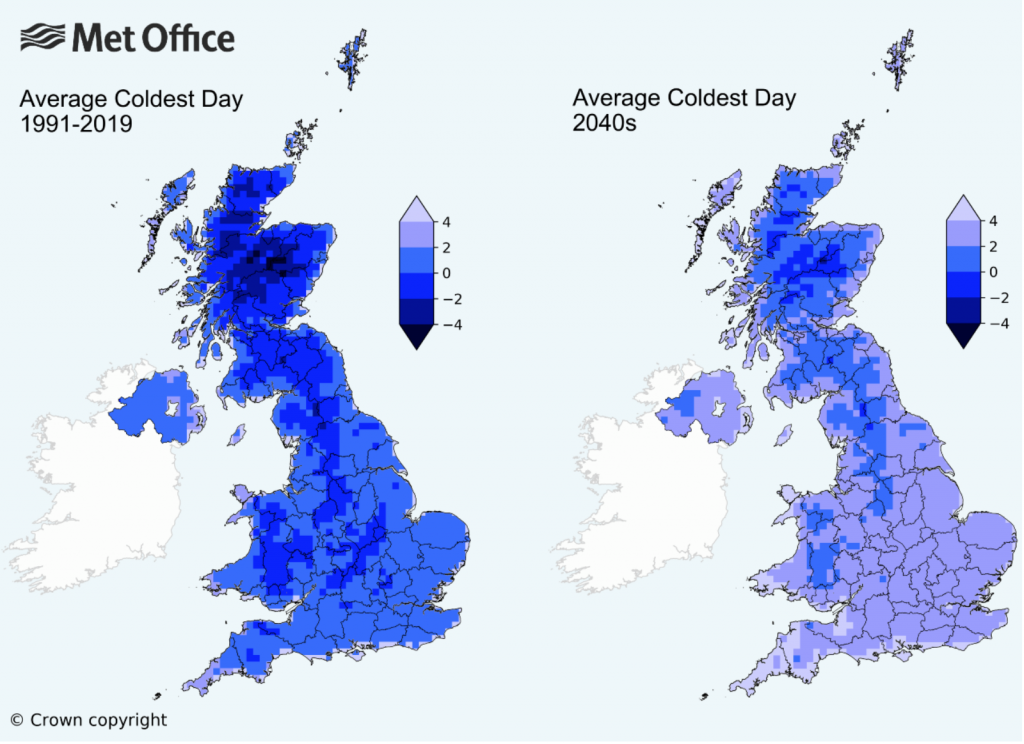
I remember hearing and reading stories as a child about the Thames in London freezing over and hosting winter festivals. Of course most of that happened during what we call the Little Ice Age, a period of below average temperatures during the 15th through the early 19th century.
But those days are over.
The UK’s Meteorological Office, or the Met for short, released some analysis of the impacts of climate change to winter temperatures in the United Kingdom. And if, like me, you’re more partial to winter than summer, the news is…not great.

Broadly speaking, winters will become warmer and wetter, i.e. less snowy and more rainy. Meanwhile summers will become hotter and drier. Farewell, frost festivals.
But let’s talk about the graphic. Broadly, it works. We see two maps with a unidirectional stepped gradient of six bins. And most importantly those bins are consistent between the maps, allowing for the user to compare regions for the same temperatures: like for like.
But there are a couple of things I would probably do a bit differently. Let’s start with colour. And for once we’re not dealing with the colour of the BBC weather map. Instead, we have shades of blue for the data, but all sitting atop an even lighter blue that represents the waters around the UK and Ireland. I don’t think that blue is really necessary. A white background would allow for the warmest shade of blue, +4ºC, to be even lighter. That would allow greater contrast throughout the spectrum.
Secondly, note the use of think black lines to delineate the sub-national regions of the UK whilst the border of the Republic of Ireland is done in a light grey. What if that were reversed? If the political border between the UK and Ireland were black and the sub-national region borders were light grey—or white—we would see a greater contrast with less visual disruption. The use of lines lighter in intensity would allow the eye to better focus on the colours of the map.
Then we reach an interesting discussion about how to display the data. If the purpose of the map is to show “coldness”, this map does it just fine. For my American audience unfamiliar with Celsius, 4ºC is about 39ºF, many of you would definitely say that’s cold. (I wouldn’t, because like many of my readers, I spent eight winters in Chicago.)
The article touches upon the loss of snowy winters. And by and large, winters require temperatures below the freezing point, 0ºC. So what if the map used a bidirectional, divergent stepped gradient? Say temperatures above freezing were represented in shades of a different colour like red whilst below freezing remained in blue, what would happen? You could easily see which regions of the UK would have their lowest temperatures fail to fall below freezing.
Or another way of considering looking at the data is through the lens of absolute vs. change. This graphic compares the lowest annual temperature. But what if we instead had only one map? What if it coloured the UK by the change in temperature? Then you could see which regions are being the most (or least) impacted.
If the data were isolated to specific and discrete geographic units, you could take it a step further and then compare temperature change to the baseline temperatures and create a simple scatterplot for the various regions. You could create a plot showing cold areas getting warmer, and those remaining stable.
That said, this is still a really nice piece. Just a couple little tweaks could really improve it.
Credit for the piece goes to the UK Met Office.
