Replacing the Bay Bridge for the Long Term

Bridges are vital parts of infrastructure networks connecting two separate pieces of territory, but often they can be choke points. Damage to a bridge can result to isolation at worst and at best long, circuitous reroutes that add significant time to travel. In the San Francisco area authorities are building a new bridge to replace the current Bay Bridge. But as everyone knows, buildings and infrastructure in that area can be significantly damaged during earthquakes. And the area is waiting for the ‘Big One’ that shall come some day or another.

So how to build a new bridge for the long-term that will also survive a major earthquake? The New York Times explains it in an interactive piece accompanying an article. The interactive piece includes an animation with voiceover explaining the details of the design, with diagrams illustrating the components placed next to the video player. At the bottom, anchoring the piece (pun intended), is a photo-illustration of the new bridge’s design.
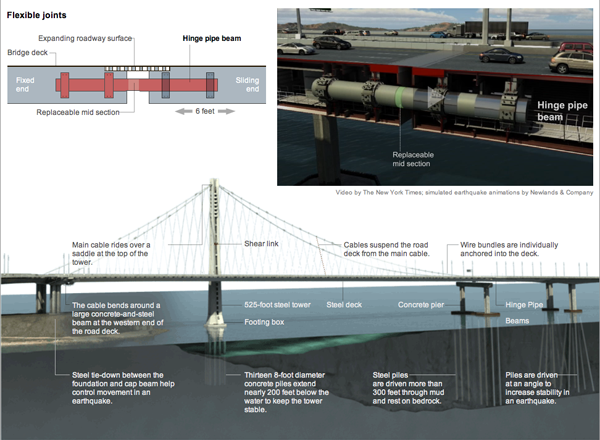
Diagram explaining the Bay Bridge replacement

Credit for the piece goes to Mika Gröndahl and Xaquín G.V.

Fresh Water Bulge in the Arctic Ocean

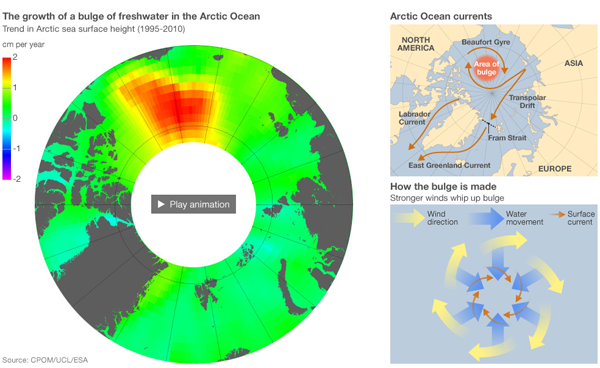
The BBC has an article on a discovery of a growing bulge of fresh water in the Arctic Ocean. The top of the article includes a large set of graphics that explains the story below and links to an animation. The animation depicts the growth of the Arctic ice sheet from the pressure beneath and plots the height of the ice.

The fresh water bulge in the Arctic Ocean

The New York City Marathon

Something I’ve been meaning to put up for a little while, the New York Times’ coverage of that city’s marathon and changes in the socioeconomic composition of the neighbourhoods through which the course winds.

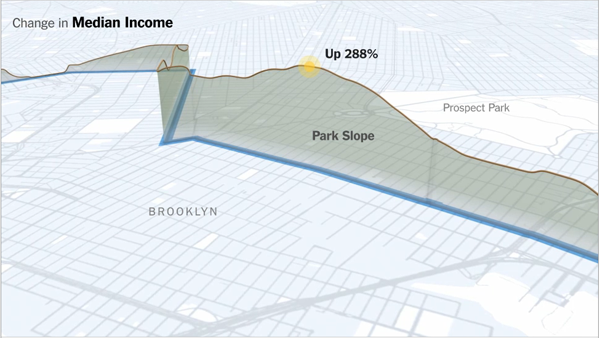
The piece includes a narrated motion graphic explaining the changes along a map of the course, while a series of charts look at those factors from a static perspective. The horizontal axis being the route of the course.

Brooklyn segment of the NYC Marathon

Credit for the piece goes to Graham Roberts, Alan McLean, Archie Tse, Lisa Waananen, Timothy Wallace, Xaquin G.V., Joe Burgess, and Joe Ward.

Curiosity

In just a few days, NASA’s next Martian rover, Curiosity, will lift off for a 2012 date with the Martian surface. The Washington Post has a two-part motion graphic piece to look at the rover’s landing and scientific components.

A look at Curiosity and its mission

Credit for the piece goes to Alberto Cuadra, Sohail Al-Jamea, and Andrew Pergram.

363 Days

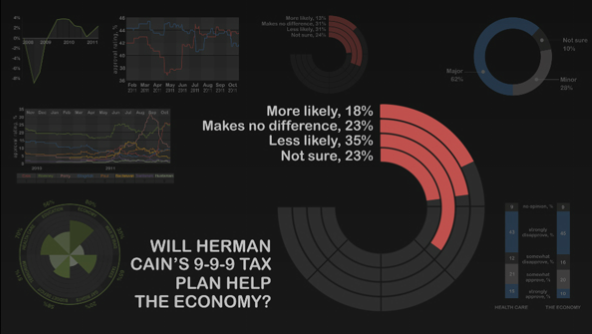
We are now just under 365 days away from Election Day 2012. Without a doubt, I shall have many politically-themed graphics coming. People just have to start making them. But for now, the Economist kicked it off Monday—when it was 365 days—with a motion graphic piece that outlines some of the polling numbers and challenges to the Republicans vying for power and President Obama determined to keep it.

365 days until Election Day 2012

Certain types of the chart are very much not helpful in determining the actual numerical comparisons. But, with the voiceover keeping our attention and explaining what is going on with the charts, it is as always interesting to experience a story told in charts and graphs for nearly three minutes. And about a story with real significance.

Riding the Rail to London?

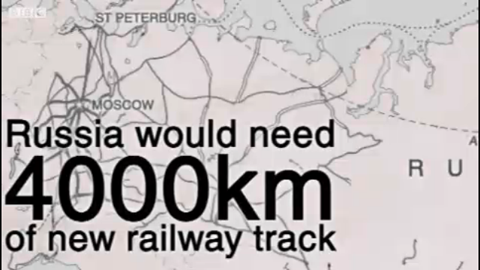
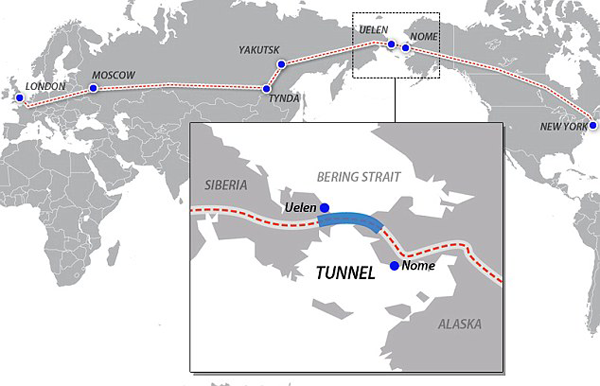
Long time readers know by now that I advocate high-speed rail and similar transport infrastructure investment. The following screenshot was taken from a BBC News video about the Russian proposal to build an underground passenger/freight tunnel beneath the Bering Strait to connect eastern Siberia to Alaska.

Screenshot from the video explaining the plan

The video is not an infographic, strictly speaking, but as a motion graphic it depicts the routes needed and compares the length of the proposed tunnel to that of the Chunnel, the tunnel beneath the English Channel. Back in August the Daily Mail also reported on the story and provided the following map showing how exactly the system would then link the Eastern Hemisphere to the Western Hemisphere.

Map of the Proposed Route

Of course the big questions that remain are can Russia afford to build the tunnel, will the United States build the rails necessary to link it to the main US–Canadian rail network, and would anyone really use it?

The Greek Tragedy

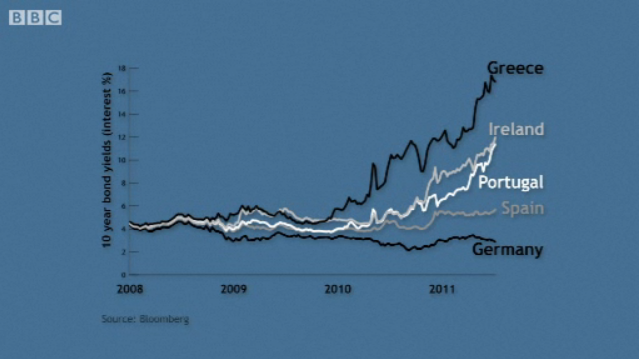
The Euro…yeah, that pesky bugger and all of the complications it is causing for the European Union at the moment. In July, the BBC released this animation explaining the Greek debt crisis. It’s worth a check, though some of the graphics could use improvement…like the one using scaled buildings in a bar chart.

10 year interest rates compared, from the animation

Critically for US readers, who have to put up with all this talk about how we cannot run a deficit, pay close attention to the bit about lenders. Deficits are not expensive until interest rates go up. And they only go up when lenders fear the inability of a government to repay its loans.

Rule, Britannia

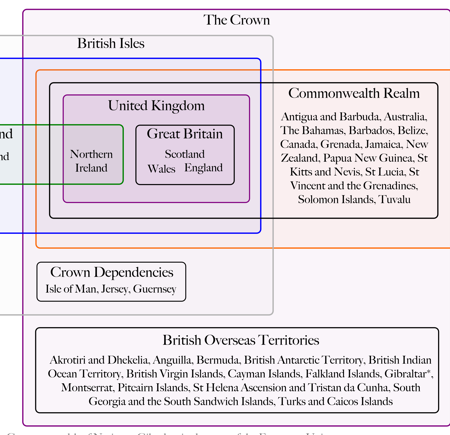
The United Kingdom. England. Britain. All pretty much mean the same thing, right? No. But, if you do not believe me, might I recommend going to Glasgow or Edinburgh and calling a local an Englishman. It may very well be a quick education.

Colin Grey attempts to untangle the constitutional and jurisdictional mess in both a video and an accompanying chart. The video takes about five minutes and is largely correct with most of the errors I have picked up on being rather small in nature, e.g. Ireland is not the Republic of Ireland but just Ireland…not a big deal unless one wants to be enraged by minutiae.

The chart is simple and effective in delineating the structure of the UK and expands about how the UK fits into Europe.

Breaking Down the United Kingdom

Credit for the piece is to Colin Grey and thanks to Kim Nguyen for the tip.