The Summary of the Mueller Report

When Robert Mueller submitted his report a few weeks ago, some interested parties declared it a witch hunt that had wasted time and money. Except, it had done the opposite of that. It had laid bare Russia’s interference in our elections and the contacts between Russian government and quasi-government officials and Trump campaign officials. Said officials then lied about their contacts and, along with other crimes discovered during the course of the investigation, either pleaded guilty or were convicted. And while a few trials are still underway, we also now know 12 other cases have been referred to prosecutors but they remain under wraps.

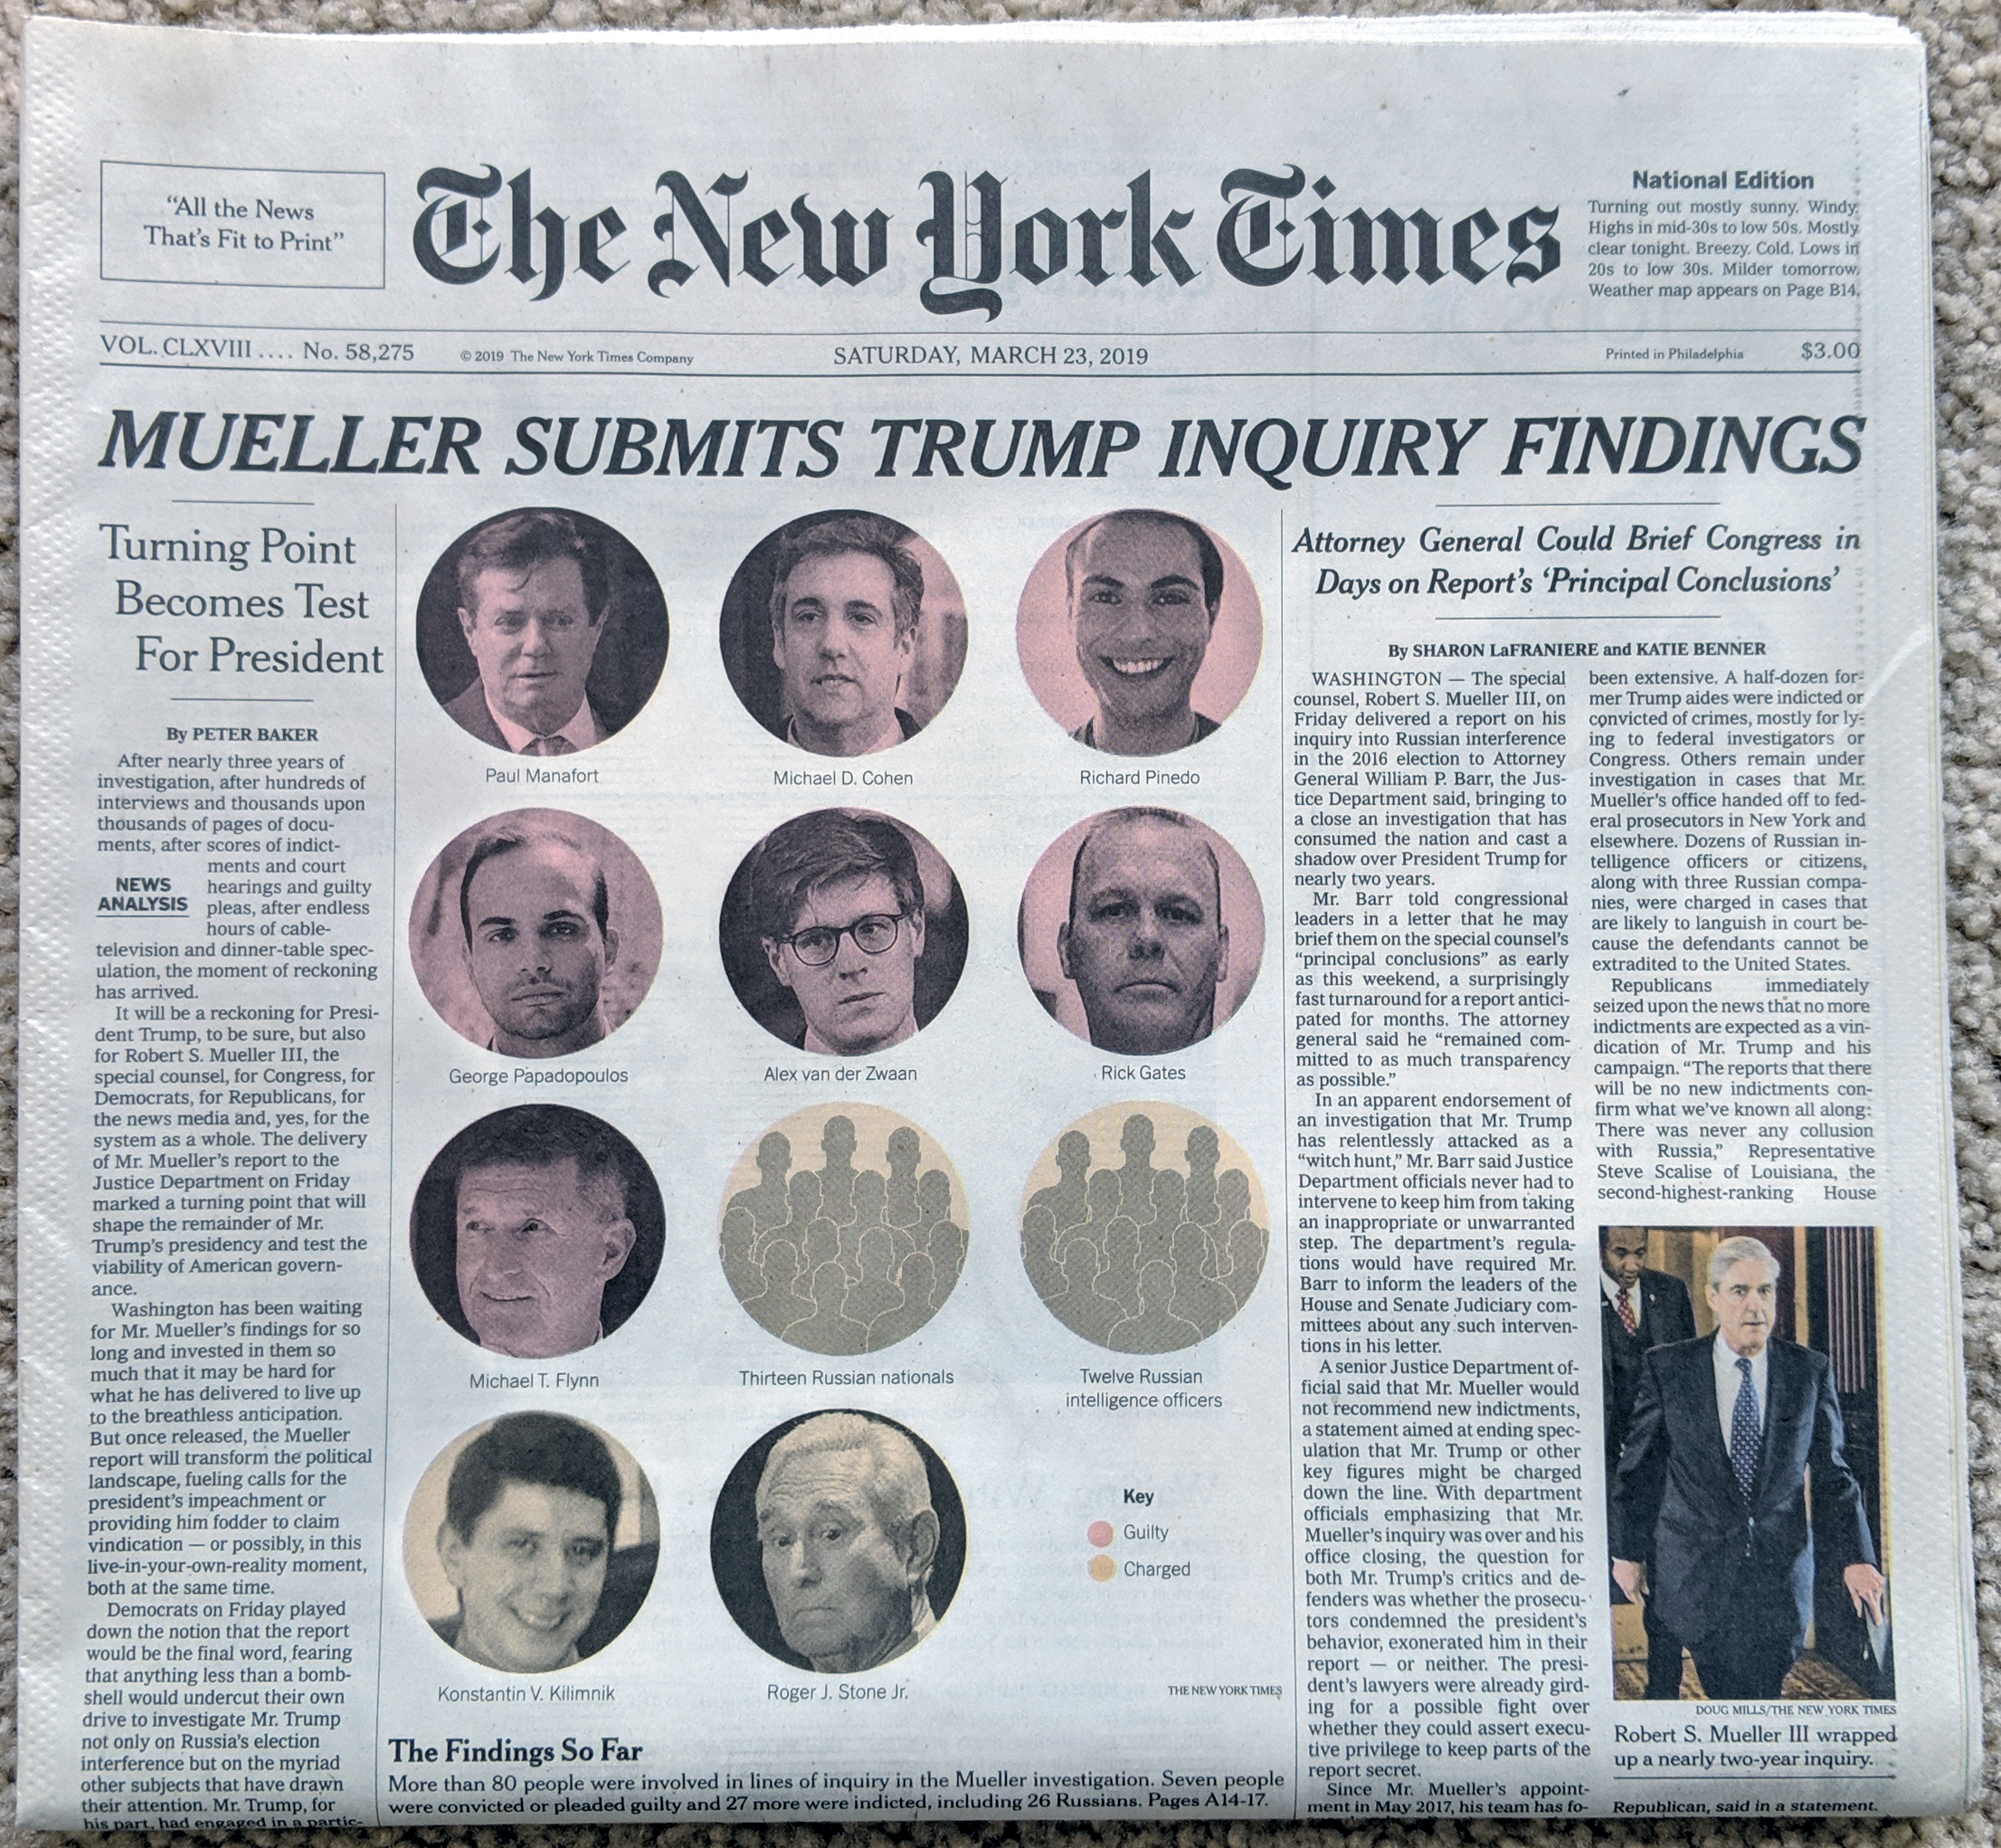
At the time of submission, the New York Times was able to create this front page graphic.
There's some shady shit going on here.
There’s some shady shit going on here.

It highlighted the key figures in the report’s investigation and identified their current status. Many of those charged, essentially all the Russians, are unlikely to ever stand trial because Russia will not extradite them.

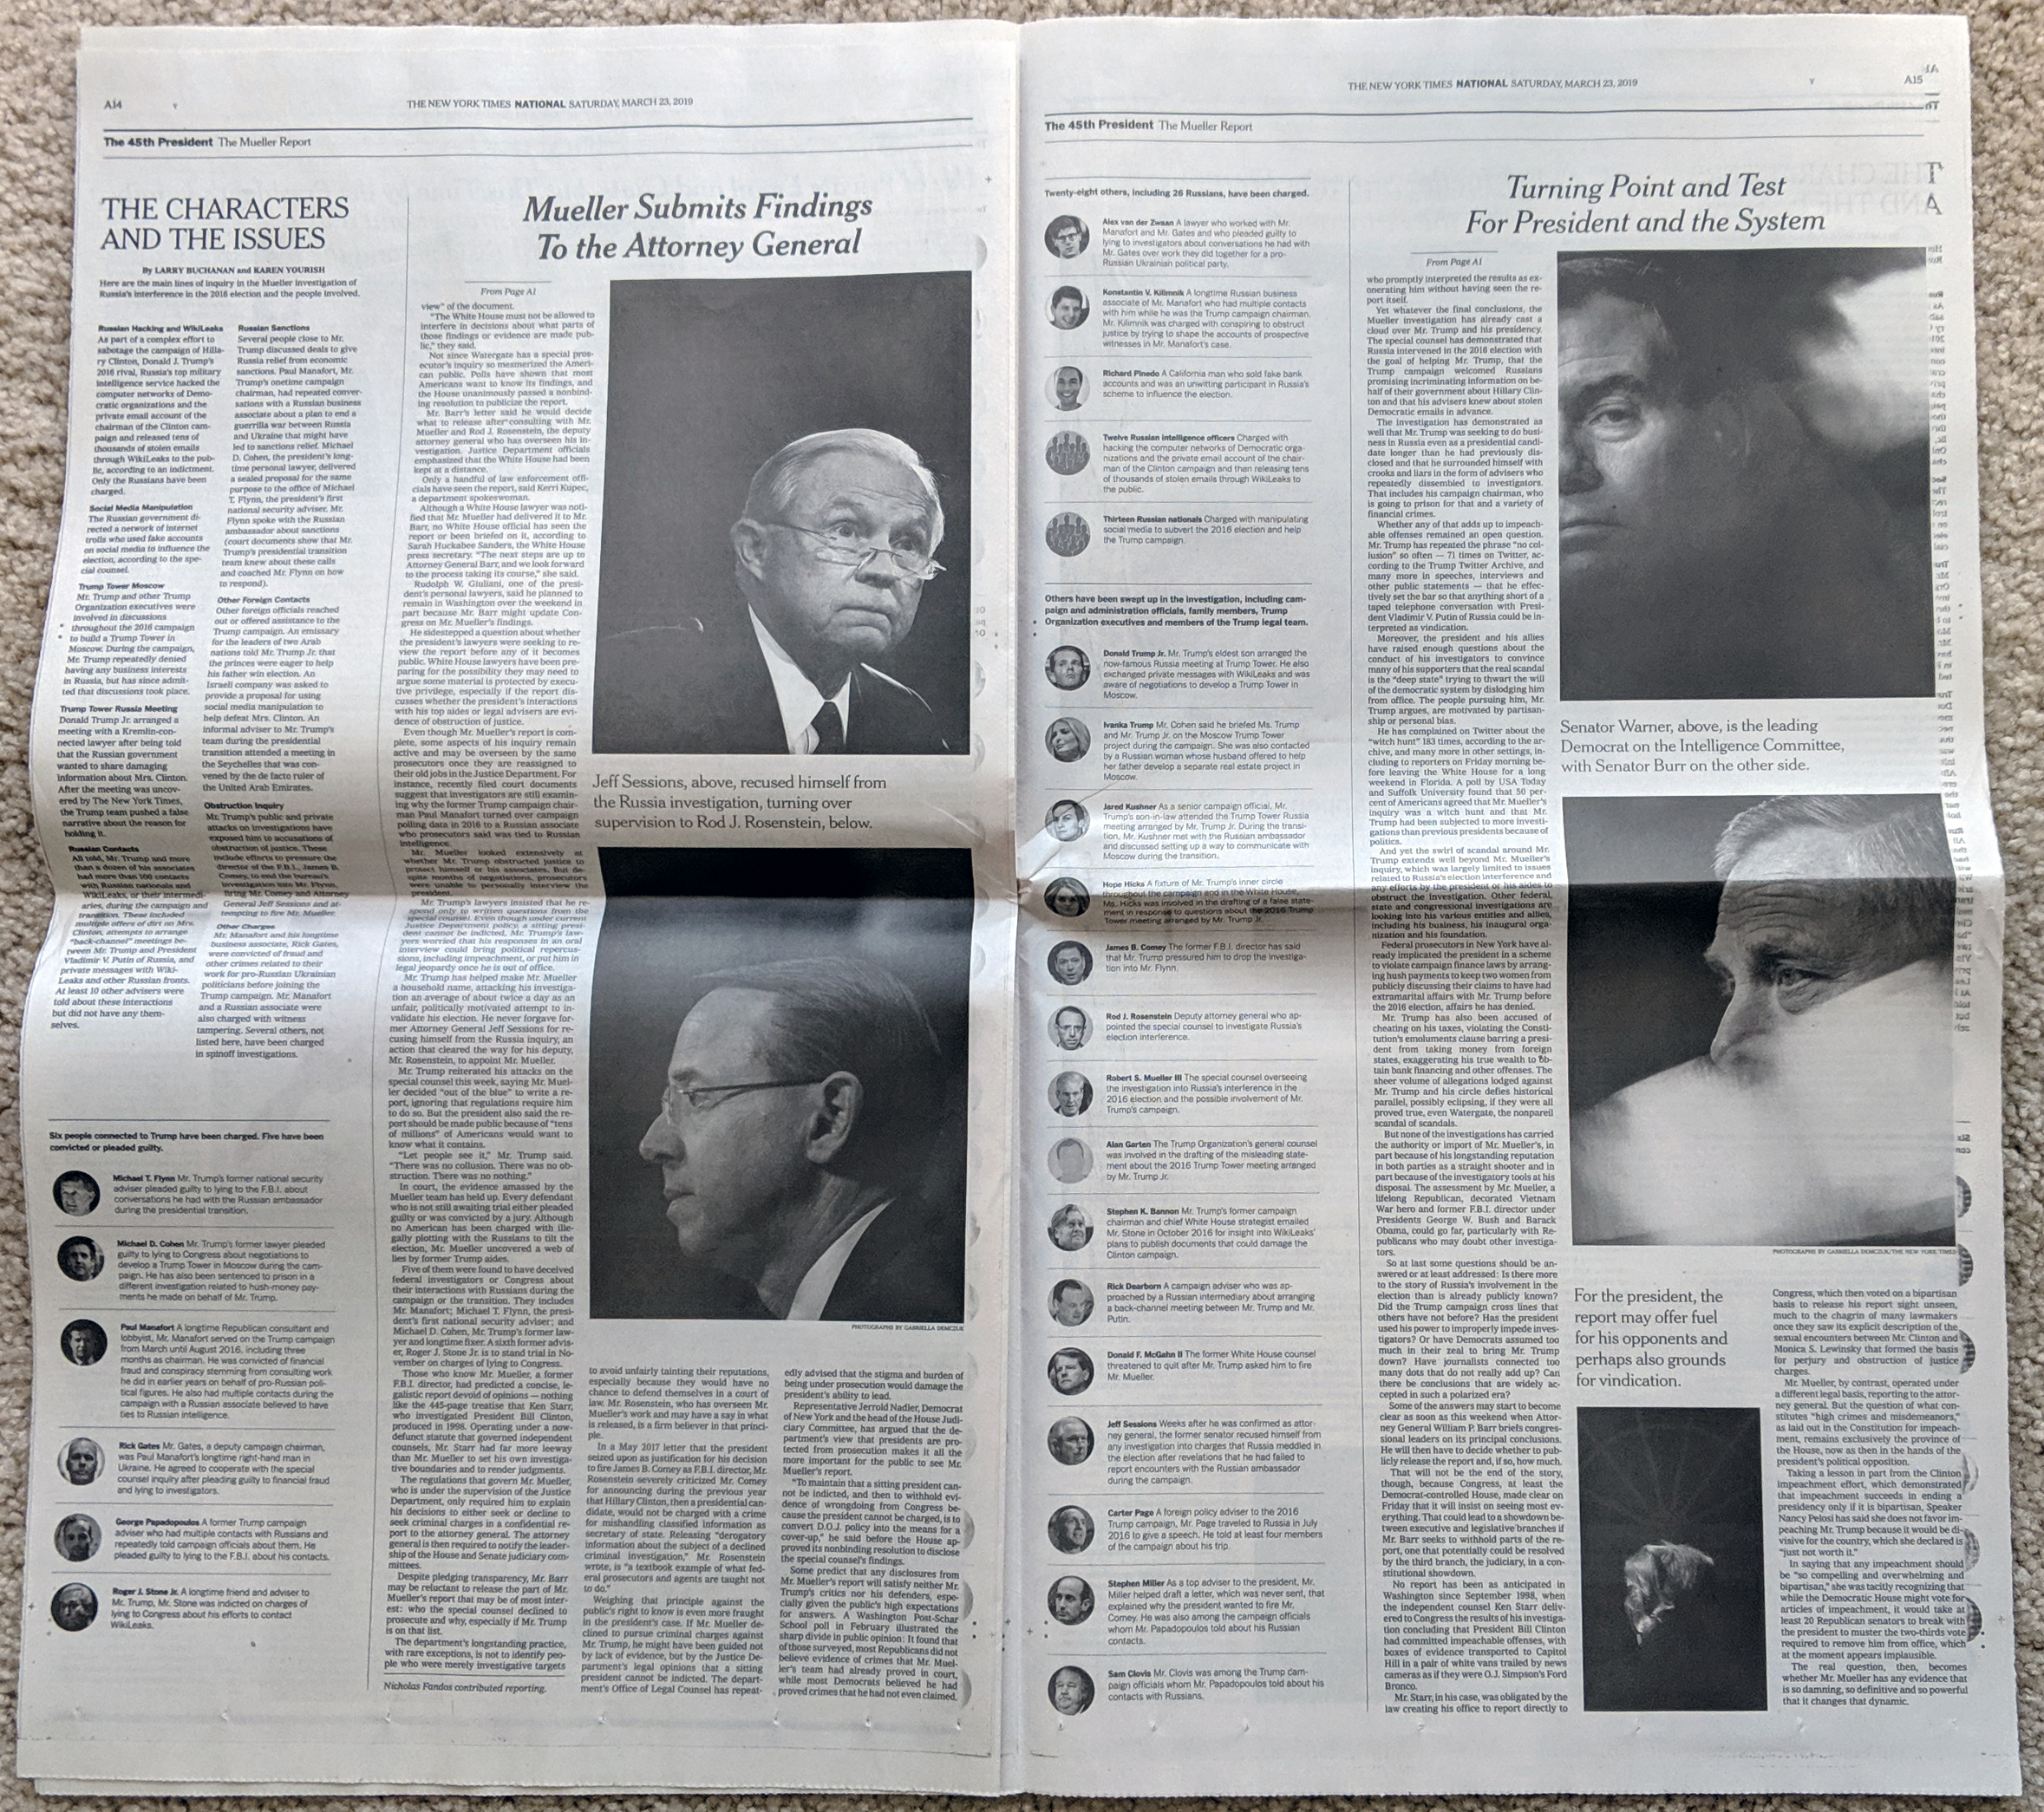
Inside the piece we had two full pages covering the report. The graphics were rather simple, like this, although as these were black and white pages, colouring the photographs was not an option. Instead, the designers simply used headers and titles to separate out the rogues’ gallery.
Not exactly the pages on which you want your name…

This wasn’t a complicated piece, but it made sense as one of the first pieces. For months we had been told the investigation was “wrapping up soon”, or words to that effect. Then, out of nowhere, it finally did. In one day, and crucially without the actual report yet, work like this reminded us that the report had, in fact, achieved its purpose.

Credit for the piece goes to the New York Times graphics department.

The Bill Barr Bifurcation

So today’s piece is not a revolutionary piece of information design, but it is fascinating. For two or so years now, we have all heard about the Robert Mueller investigation into potential contacts between the Trump campaign, early administration, and the administration of Russian president Vladimir Putin.

To be clear, thus far, this has been an incredibly productive special counsel.

34: the number of indictments

6: guilty pleas from associates of the Trump campaign

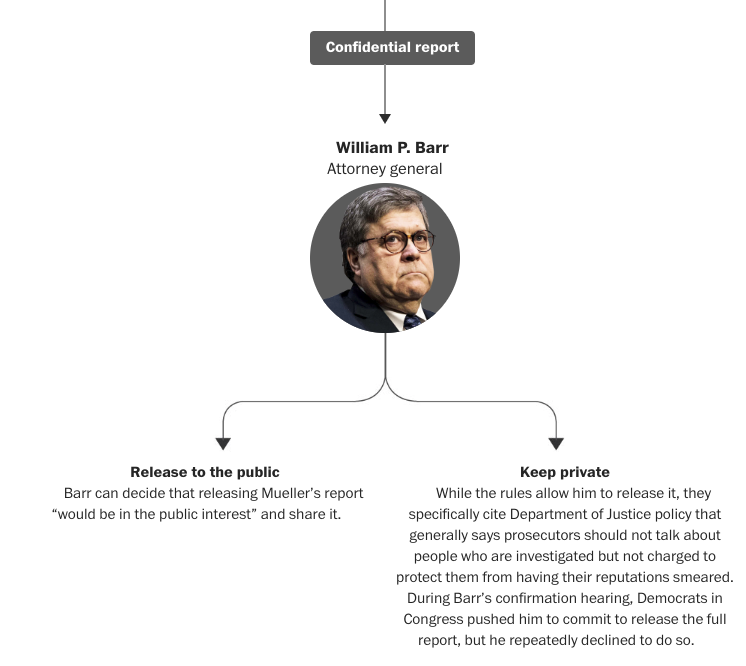
But what happens when the whole thing is done, especially since prevailing Justice Department rules state sitting presidents cannot be indicted? Well to answer that, we have this piece from the Washington Post.

I'm hoping the report isn't…Barred…
I’m hoping the report isn’t…Barred…

Ultimately it is nothing more than a flow chart broken into pieces, separated by a textual narrative explaining the process. Now, I’m not certain how critical to the design each headshot is—especially Barr’s that looks especially frowny faced. However, the context in the above screenshot is crucial. The public does not necessarily have the right to the findings of the report if individuals in the report are not charged.

This means that design wise, we are looking at snippets of a larger chart interspersed with text. I would be interested to see the entire thing stitched together, but the textual breaks make a lot of sense. Overall, much like the sports pieces we looked at recently, this does a nice job of weaving textual story together with information design or data-driven content.

Credit for the piece goes to Dan Keating and Aaron Steckelberg.