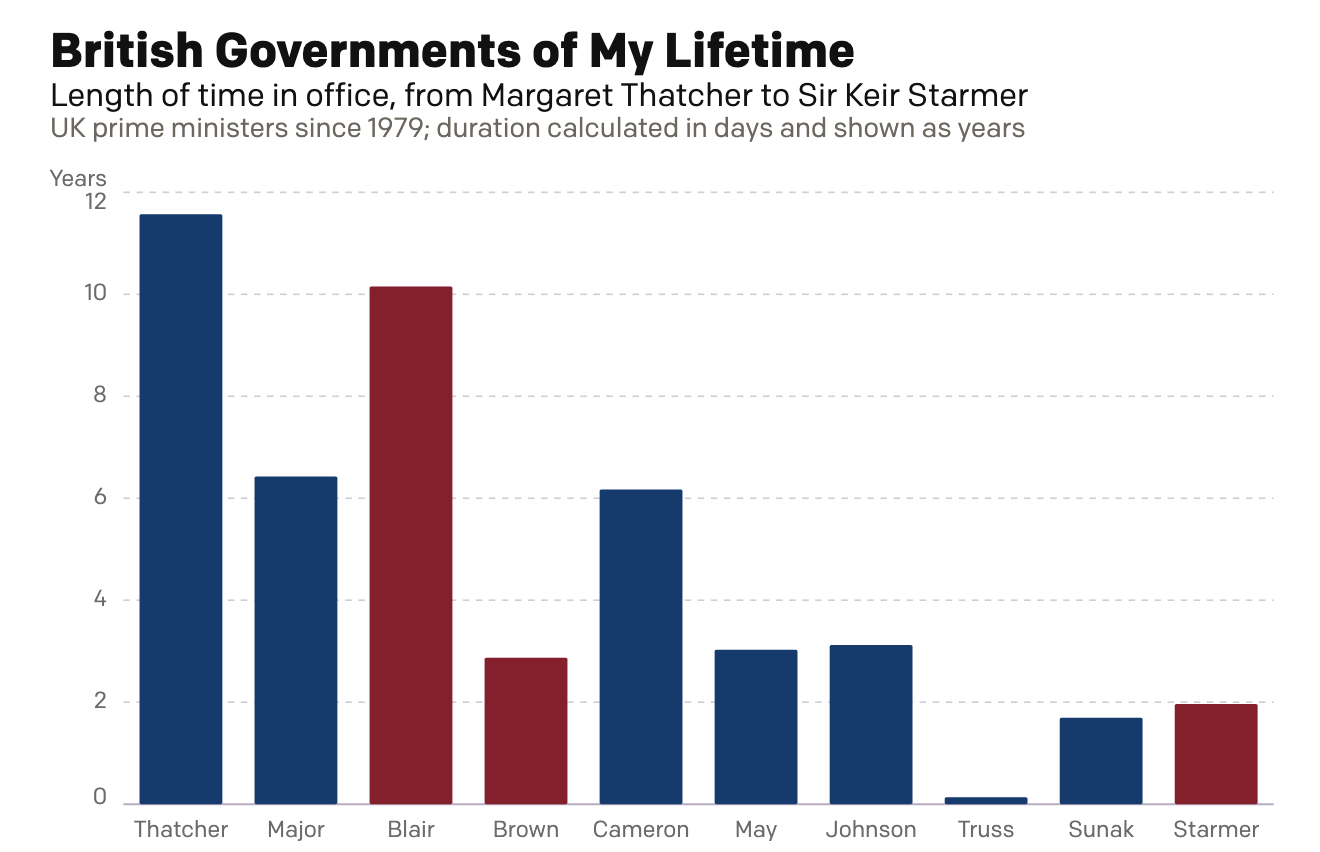
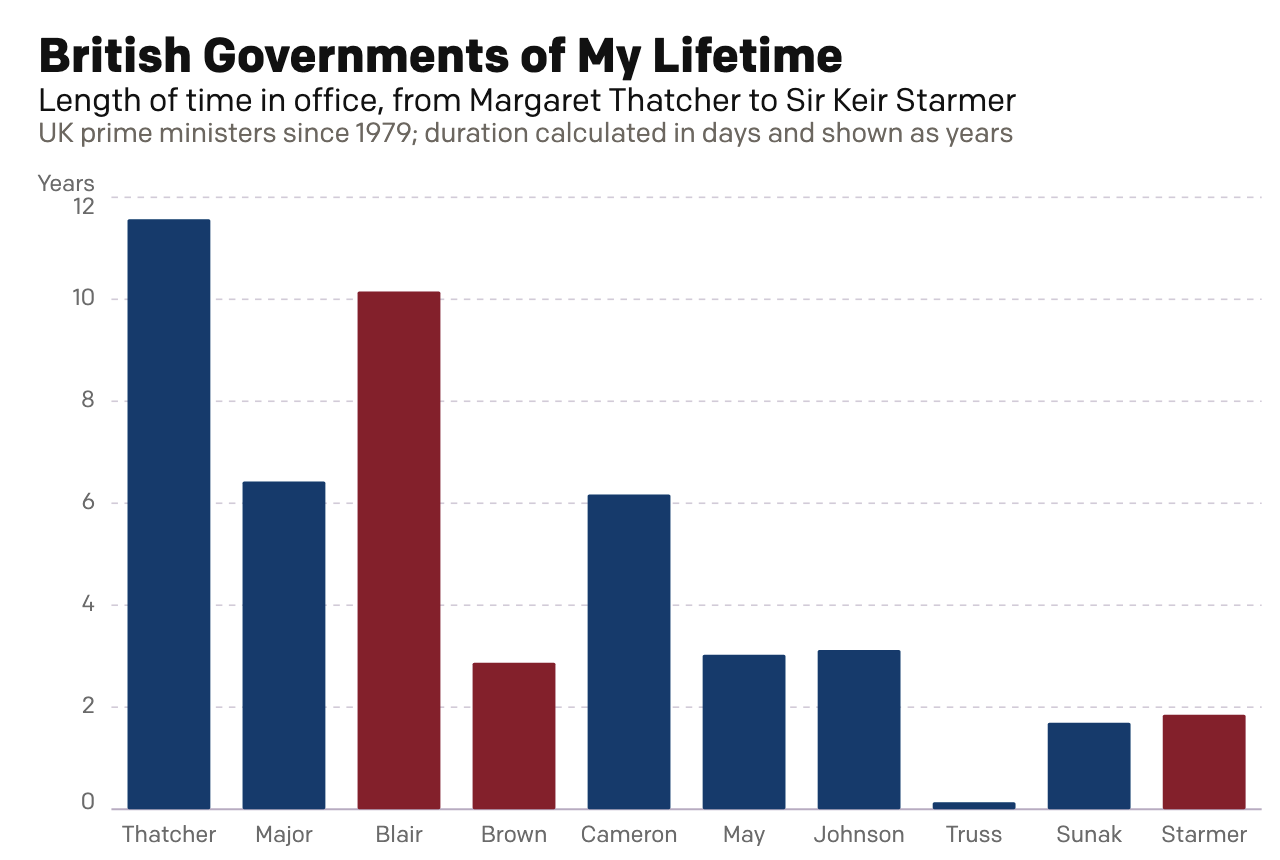
How Does the UK View Their Political Parties?

The United Kingdom crashes out of the European Union on Friday. That means there is no deal to safeguard continuity of trading arrangements, healthcare, air traffic control, security and intelligence deals, &c. Oh, and it will likely wreck the economy. No big deal, Theresa. But what do UK voters think about their leading political parties in this climate? Thankfully Politico is starting to collect some survey data from areas of marginal constituencies, what Americans might call battleground districts, ahead of the eventual next election.

And it turns out the Tories aren’t doing well. Though it’s not like Labour is performing any better, because polling indicates the public sees Corbyn as an even worse leader than Theresa May. But this post is more to talk about the visualisation of the results.

Of course I naturally wonder the perception of the smaller parties like the Liberal Democrats or Change UK (the Independent Group)

The graphics above are a screenshot where blue represents the Conservatives (Tories) and red Labour. The key thing about these results is that the questions were framed around a 0–10 scale. But look at the axes. Everything looks nice and evenly spread, until you realise the maximum on the y-axis is only six. The minimum is two. It gives the wrong impression that things are spread out neatly around the midpoint, which here appears to be four. But what happens if you plot it on a full axis? Well, the awfulness of the parties becomes more readily apparent.

Neither party looks very good here…

Labour might be scoring around a five on Health, but its score is pretty miserable in these other two categories. And don’t worry, the article has more.  But this quick reimagination goes to show you how important placing an axis’ minimum and maximum values can be.

Credit for the piece goes to the Politico graphics department.

The UK General Election

Well for those of you among my British audience, today is the big day. Can Malcolm Tucker save Nicola Murray from—wait, nope, that’s fictional British politics. But that doesn’t mean today’s results won’t be exciting. For those of you now from the UK, a majority of my readers, the UK is looking at what is called a hung parliament. In other words, nobody will win a majority of seats, which means that smaller parties will need to be included in a coalition government, a sort of fairly new—but also not really—development in British politics.

We could dive deep into all of these, but I have not the time. But, let’s start with the Guardian. They have a nice set of polling and prediction guesstimators. What is really nice, however, is the seat changing graphics. These show you where the gains and losses are predicted to originate.

The Guardian's predictions
The Guardian’s predictions

The BBC has a much less involved piece. This is the only thing I can find. However, the BBC will undoubtedly have interesting visuals during their live broadcast of the results. Jeremy Vine can always be counted on for weird presentational things. Oh, and they have the swingometer.

The BBC's poll tracker
The BBC’s poll tracker

Back in April we looked at the Fivethirtyeight predictions. And we might as well throw the latest screenshot up and compare that to the Guardian and the BBC.

Fivethirtyeight's updated predictions
Fivethirtyeight’s updated predictions

The Economist has a nice poll tracker with some simple controls for some simple filtering. But, these are, like the BBC’s, without an impact of number of seats. The Economist does, however, offer a separate build-your-own-majority calculator. 

What the Economist shows on their Election homepage

The New Statesmen has built a site dedicated to May 2015, and their current predictions are as follows below.

New Statesmen's predictions
New Statesmen’s predictions

The only drawback to all of these pieces is that I will be busy coaching softball tomorrow night. So I will be unable to watch the BBC’s coverage of election results. And that is most unfortunate, because British politics are far more fascinating than the bland and boring two-party politics of the United States.

Credit for the Guardian piece goes to Caelainn Barr, Helena Bengtssoni, Chia-Jung (Apple) C.Fardel, Seán Clarke, Cath Levett, Alberto Nardelli, and Carlo Zapponi.

Credit for the BBC piece goes to the BBC graphics department.

Credit for the Fivethirtyeight piece goes to Matthew Conien and Ritchie King.

Credit for the Economist piece goes to the Economist’s graphics department.

Credit for the New Statesmen piece goes to the May 2015 graphics team.

British Parliament Timeline

For those of you who don’t know, the British Parliament was dissolved today ahead of the 7 May elections. In other words, it is now election time. Last week the Economist published a small interactive piece that allows you to look at the composition of the British Parliament from 1870 through today.

Parliament over the years

While many (some?) of us would remember times from recent history, e.g. the 1997 electoral victory of Tony Blair, the memory might be a bit foggier one hundred years in the past. But to help you, if you click on a particular year, the view changes from an overview to a focus on Parliament in that particular year.

Parliament in 1915
Parliament in 1915

Credit for the piece goes to the Economist’s Data Team.

The UK’s Two-party System Continues to Decline

If you missed it, last week the United Kingdom held a few by-elections. For we Americans, those are like special elections for seats in the Senate or the House that are not part of the regular Congressional elections. Anyway, the big news was that the United Kingdom Independence Party (UKIP)—think Tea Party wanting out of the European Union…kind of—won a by-election for Clacton-on-Sea (not surprisingly located on the sea) from the Tories (think establishment Republicans). UKIP almost won a by-election away from Labour (kind of think Democrats?). The former was shocking but not surprising, the latter was both.

Anyway, one of the drivers of the results was the fact that British voters are no longer consistently voting for either the Tories or Labour. The Telegraph used a nice graphic to show just how far the British two-party system has declined from its peak in 1951. The piece is not very fancy, but it does the trick.

Tory–Labour vote share since 1951

Credit for the piece goes to the Telegraph’s graphics department.