In murders. Not the best of news, no. But this past March London saw more murders than New York. But as I was reading the BBC article this weekend, I wondered why the graphic they chose to use received as much prominence in the article as it did.
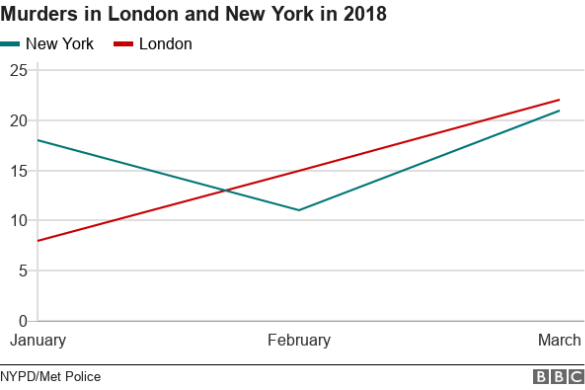
The chart as you can see occupied a full column width. But keep in mind, we are looking at a total of six datapoints: the murders for two cities in three months. While the story and data is significant, does the display of the data need to be?
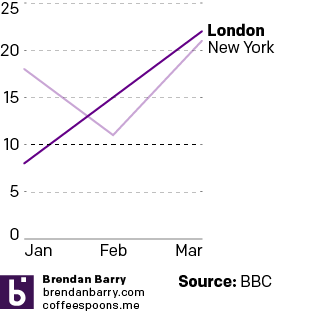
The important point in the story is that in the past three months, London has surpassed New York in the number of murders. But the graphic supporting those six data points should not be overwhelming the significance of the text explaining the trend. After all, the data consists of only three points for two cities. If the data is displayed on an extended horizontal axis, it flattens the change and minimises the increase. To counteract that, the y axis should be increased, but then the amount of screen real estate being devoted to six data points is enormous. The better approach is to use a smaller graphic that displays the data in a better proportion, but also in a proportion that does not blow out the text of the story. The graphic to the right (and maybe above this blurb of text) shows how that can be done in a smaller space.
Credit for the original goes to the BBC graphics department.
Leave a Reply
You must be logged in to post a comment.