Drinking by Decile

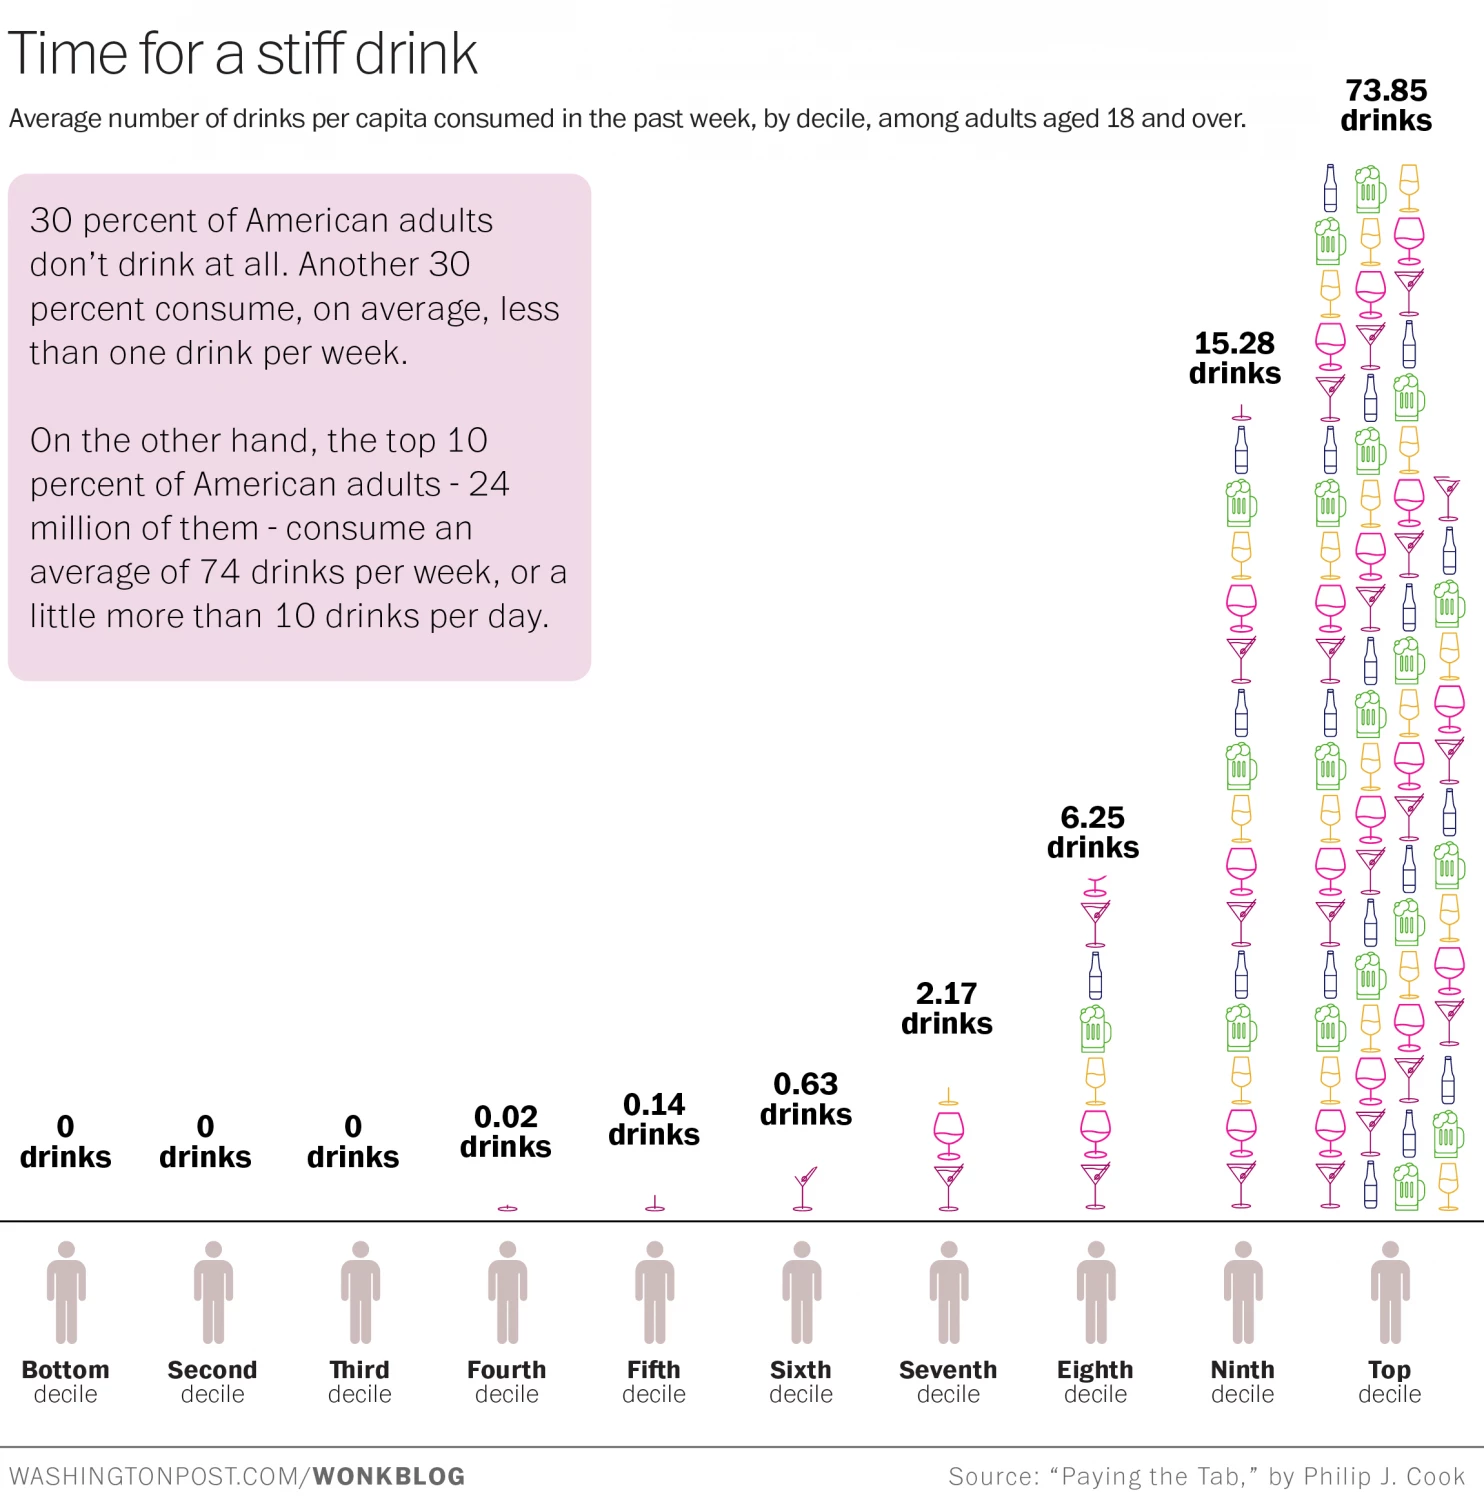
Happy Friday, everybody. I’m looking forward to a pint. But thanks to some research, as an American, I might actually be looking forward to 10 pints if I fall within the highest decile of American drinkers. They imbibe on average over 73 alcoholic drinks per week. Yep, that means over 10 per day. Bottoms up, Merica. The Washington Post brings up the graphic summary of the study.

Drink deciles

Credit for the piece goes to Christopher Ingraham.

Which Countries Do You Drink Like?

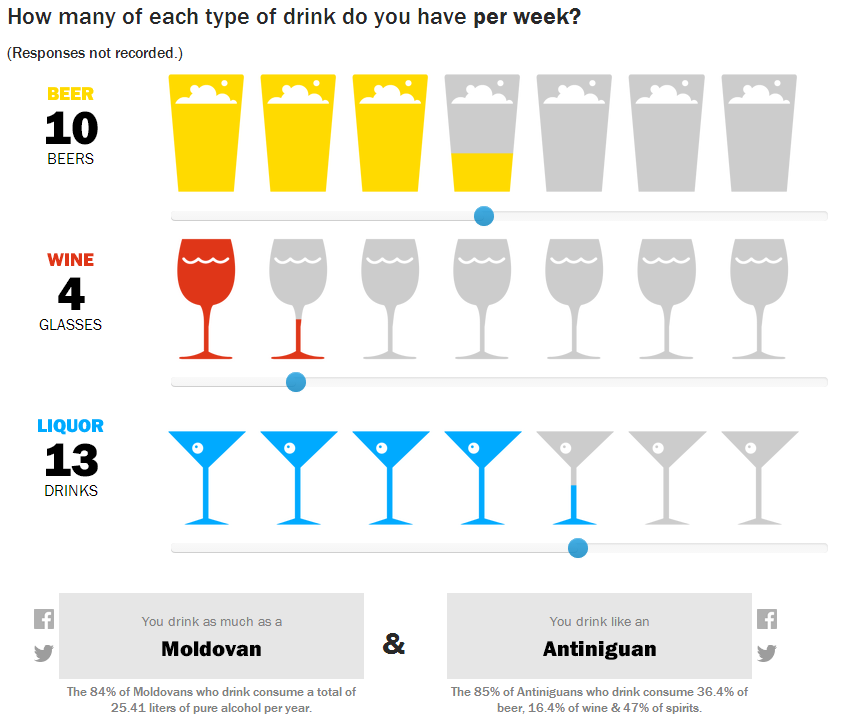
Happy Friday. Happy Memorial Day Weekend. Happy Summer. Just about all of those things mean a drink of some kind. And thanks to Time, we can look at ourselves and find out what drinking culture each of us best reflects. The data comes from the WHO and looks at both total consumption and then share of consumption.

The countries which I drink like

So last week I drank like a Moldovan and most nearly like an Antiniguan. Of course, they meant Antiguan. It just so happens I caught the spelling error. But since most of last week can be chalked up to a house party, I did the week before too. Then I drank like a Belarusian in the style of Guyanese person.

And for those of you who know me, yes, things like this are exactly why I record all the drinks I consumer in my little black book.

Credit for the piece goes to Pratheek Rebala.

Where’s the Wine?

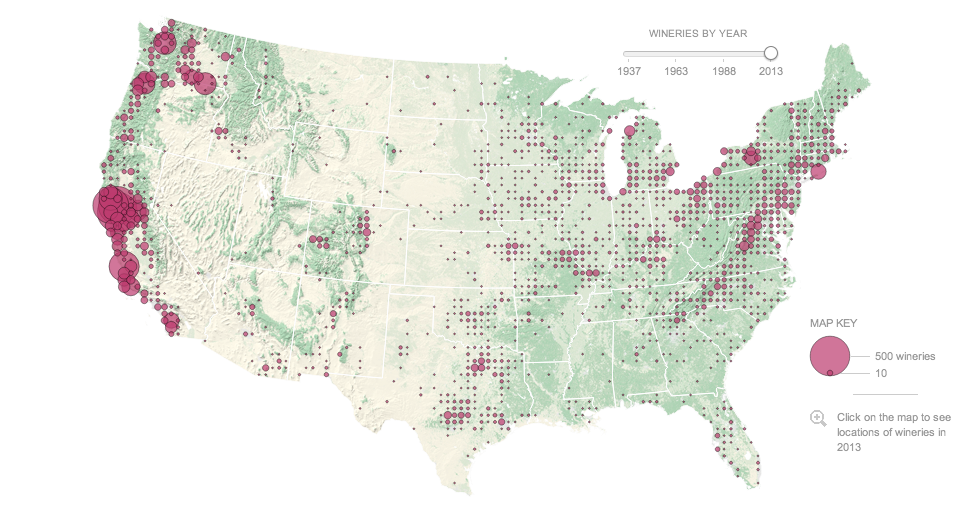
So my wine palate is neither as refined nor sophisticated as it was before I moved to Chicago. (Oh hi, whisky.) However, wineries are springing up all over the country—and not just in California. This interactive graphic from the New York Times details the country, mapping out wineries up top and then exploring the growth in several key states near the bottom. In particular, note the chart for the number of wineries in California that runs down the right-hand side.

Map of US wineries
Map of US wineries

Credit for the piece goes to Kevin Schaul, Tim Wallace, and Adrienne Carter.

Periodic Table of Beer Styles

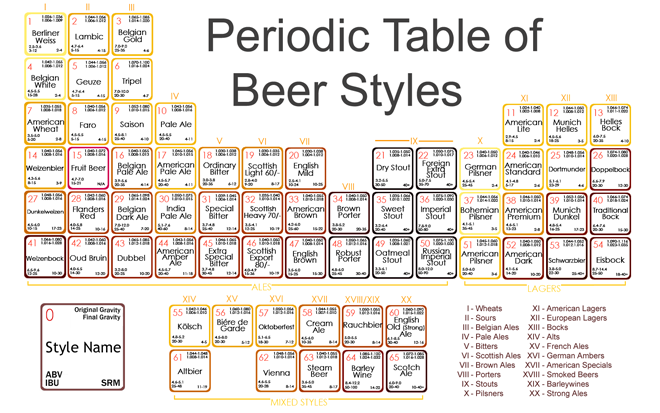
Today’s post comes via a friend and is about beer. What else do you need for a Friday post? Here’s one of the several versions of the chart. It appears to have been based off an original design, but now variations of the re-interpretation are floating around the internet. More importantly though, I’m a whisky guy so I have no idea how true this  work is.

Periodic Table of Beer

Credit for the original piece goes to Mantis Design.

It’s Five O’clock Somewhere

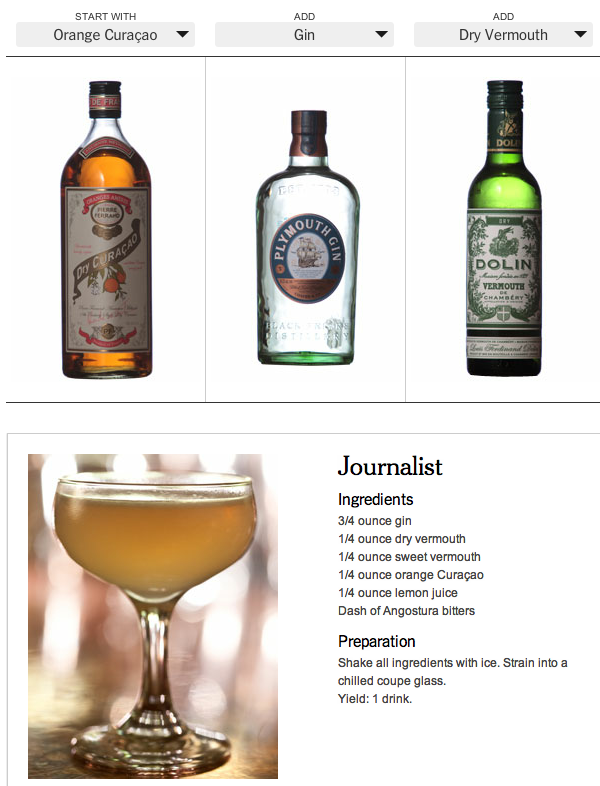
Infographics and interactive pieces need not always be about data. Sometimes they can help you find things far more practical than levels of Canadian defence spending or changing demographics. Sometimes they can help you find new summer cocktail recipes. Like this piece from the New York Times.

Journalist
Journalist

And if you’re me, you can add the experiments to your running tally of drinks as new data points.

Credit for the piece goes to Jacky Myint, Emily Weinstein, Des Shoe, and Tony Cenicola.