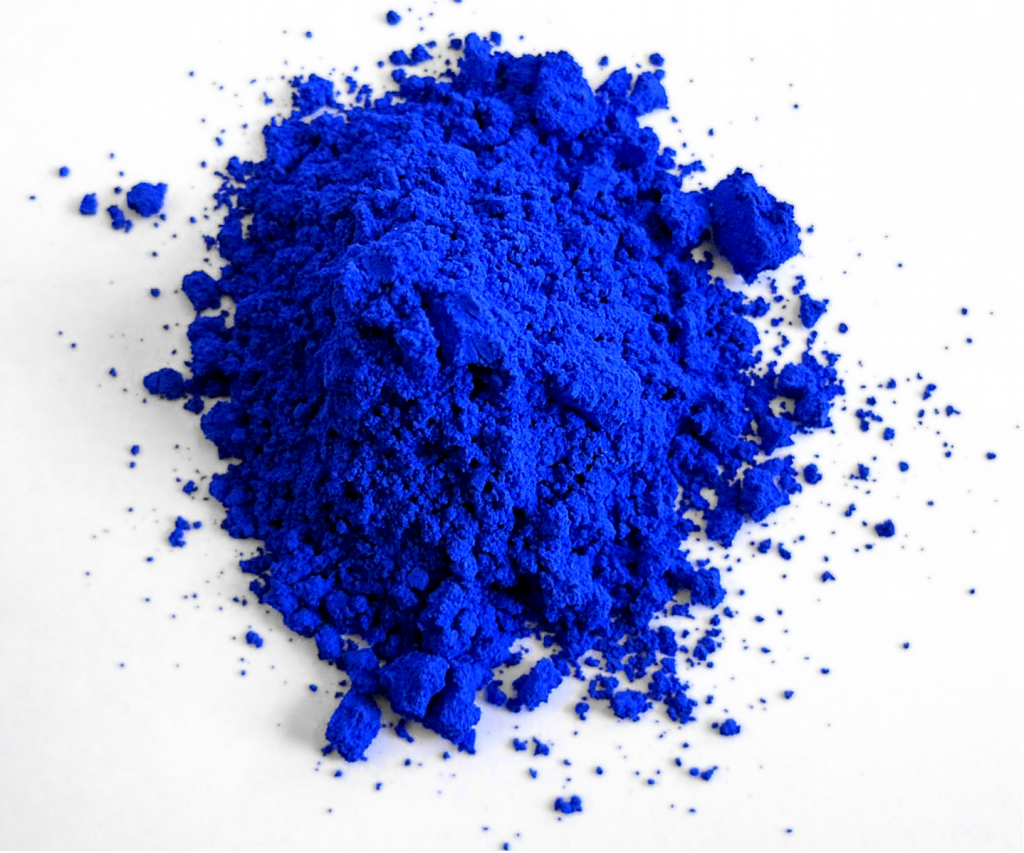
Today’s post is not about data visualisation per se, but rather an element of it: colour. Two weeks ago, the Times reported on the creation of a new artificially made pigment of the colour blue.

You can read the article for the full details, but the new pigment contains yttrium, indium, and manganese. Combine the symbols for those elements, Y, In, and Mn, and you have YInMn Blue. In particular, the colour exhibits permanence and thus does not fade, say when mixed with water.
And it’s non-toxic, because for those who don’t know, some of the most popular paint colours in history have turned out to be toxic. White paint? Made with lead. Some of your bright, rich reds? Turns out cadmium can kill. And with blues we often see cobalt or chromium as part of the mixture and, guess what, they’re both toxic. But not YInMn.
Last summer, the Environmental Protection Agency (EPA) approved the pigment for commercial use. And so we can begin to use it in oils and watercolour paints. (The EPA had approved its use for industrial purposes back in 2017. Check out this article for an image of the blue used to make an electric guitar.)
For data visualisation and design purposes, for web stuff, colours work differently. The blue in the screenshot above from the Times article, that is made by photons emitted by your computer or mobile phone. Whereas, when you view that pile of pigment in person, or a guitar body, or a painting—all in person—what you are seeing is the absorption and reflection of light waves striking the objects. What you see is the portion of the light wave that is reflected, i.e. not absorbed, by the object.
So it’s possible that we could see YInMn Blue as the basis for a paint used in printing and therefore tints of it used to make a choropleth map of freshwater availability. But if your work is strictly digital/web based, this probably won’t make too much of an immediate impact.
