Water Level on Lake Michigan

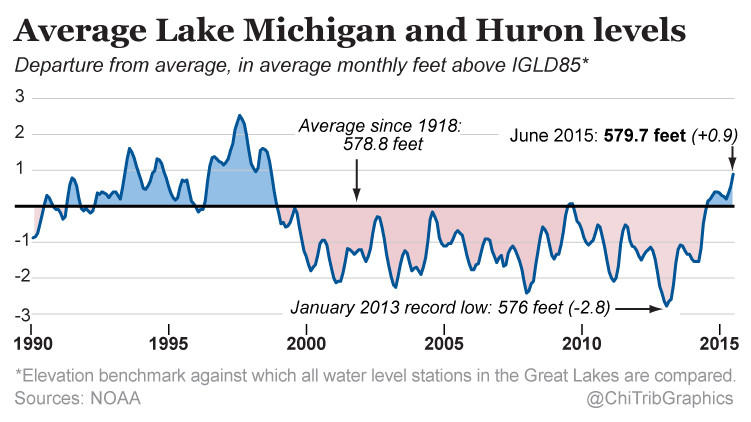
Today’s a little piece for those of you who follow me from the Chicago area. It turns out that in the last 30 months, the water level of Lake Michigan has risen three feet. Despite what some people think, Lake Michigan is not an ocean—I have overheard conversations in my neighbourhood about people who went “swimming in the ocean today” and want to show them a map that points out the Atlantic is almost a thousand miles away—and is not under the same threat as the coast via melting icecaps. The Great Lakes are instead impacted by other regional and cyclical patterns, e.g. El Niño. This article by the Chicago Tribune makes use of this small but clear line chart in its discussion of those very factors.
Water levels for Lakes Michigan and Huron

Credit for the piece goes to the Chicago Tribune’s graphics department.

When the Baltimore Oriole Abandons Baltimore

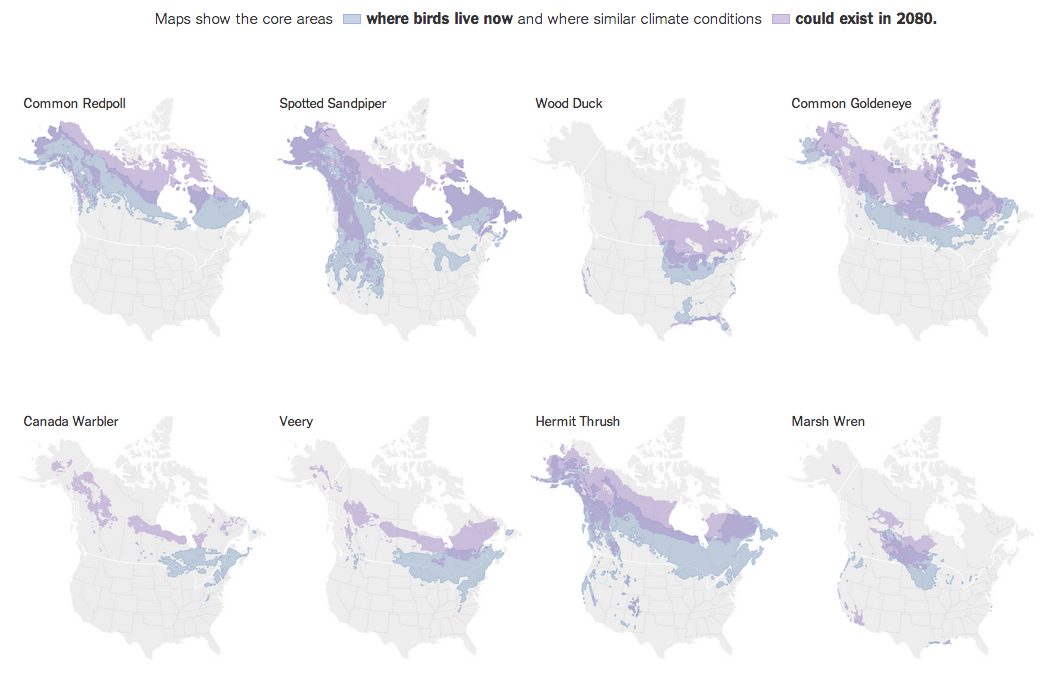
Climate change has more of an impact than just extreme weather. For one, not all weather will necessarily be warmer. Two, animals and plants will be affected in terms of their natural habitat. The New York Times recently put together a piece about the impact of climate change upon birds. And it turns out that in less than a century, it is projected that the Baltimore Oriole will no longer find its preferred climate in Baltimore, but rather further north.

Where the birds are and aren't
Where the birds are and aren’t

Credit for the piece goes to K.K. Rebecca Lai, Larry Buchanan, and Derek Watkins.

Impact of Climate Change

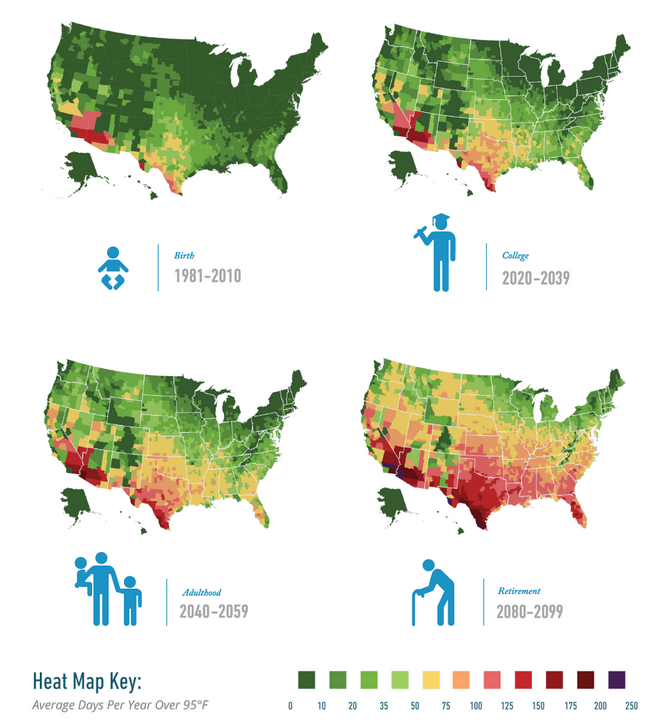
As someone who likes cooler weather, climate change sucks. Because that generally means warmer weather. Yes, yes, I know it means equally good chances for extreme cold temperatures and in general more extreme weather, but mostly I hate hot weather. So a new report by Risky Business Project, a group led by former New York mayor Michael Bloomberg, Henry Paulson, and Tom Steyer, looks to quantify some of the impact.

But in short, nothing good is going to happen. And basically, I will never move to the South.

Impact of climate change

Credit for the piece goes to the graphics team behind Risky Business.

Spilling the Oil

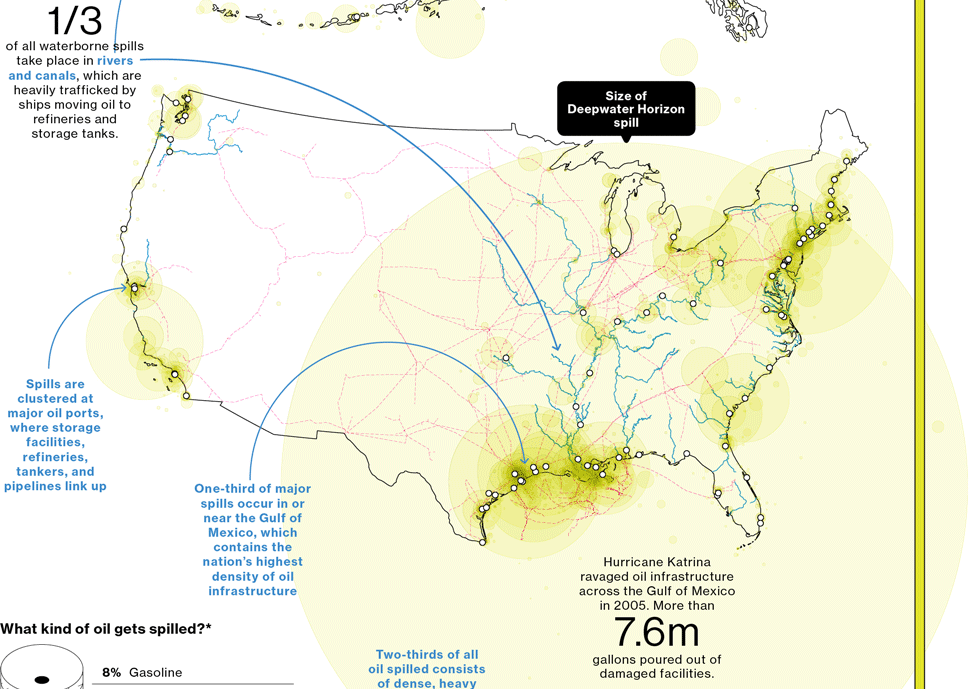
A few weeks ago, Bloomberg Businessweek published a nice graphic that summarised the last 25 years of oil spills. I’m finally getting around to posting it. But what it does really well is show just how bad the Deepwater Horizon spill was compared to the other big name disaster: Exxon Valdez. Of particular note is the bar chart at the bottom right comparing the millions of gallons of oil spilled.

Oil spills
Oil spills

Credit for the piece goes to Evan Applegate.

It’s Cold Outside

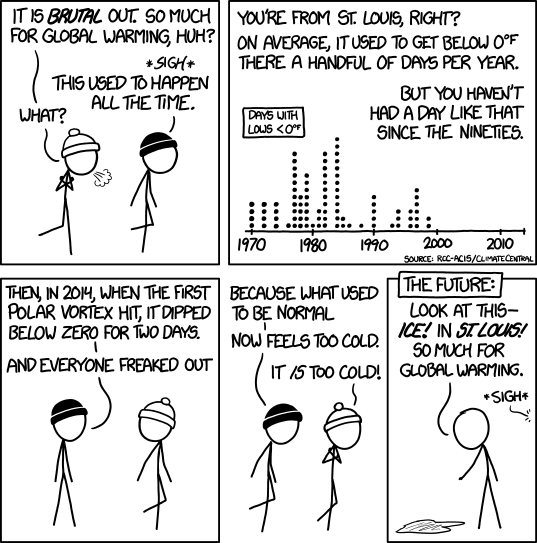
I have spent this past week in Lithuania for work. And it was cold. But it was colder still in Chicago. Thankfully on a Friday we have xkcd to put all this cold into a bit more perspective. Although his example uses St. Louis, I presume it holds for most cities.

It's cold outside
It’s cold outside

Credit for the piece goes to Randall Munroe.

Winds Across the World

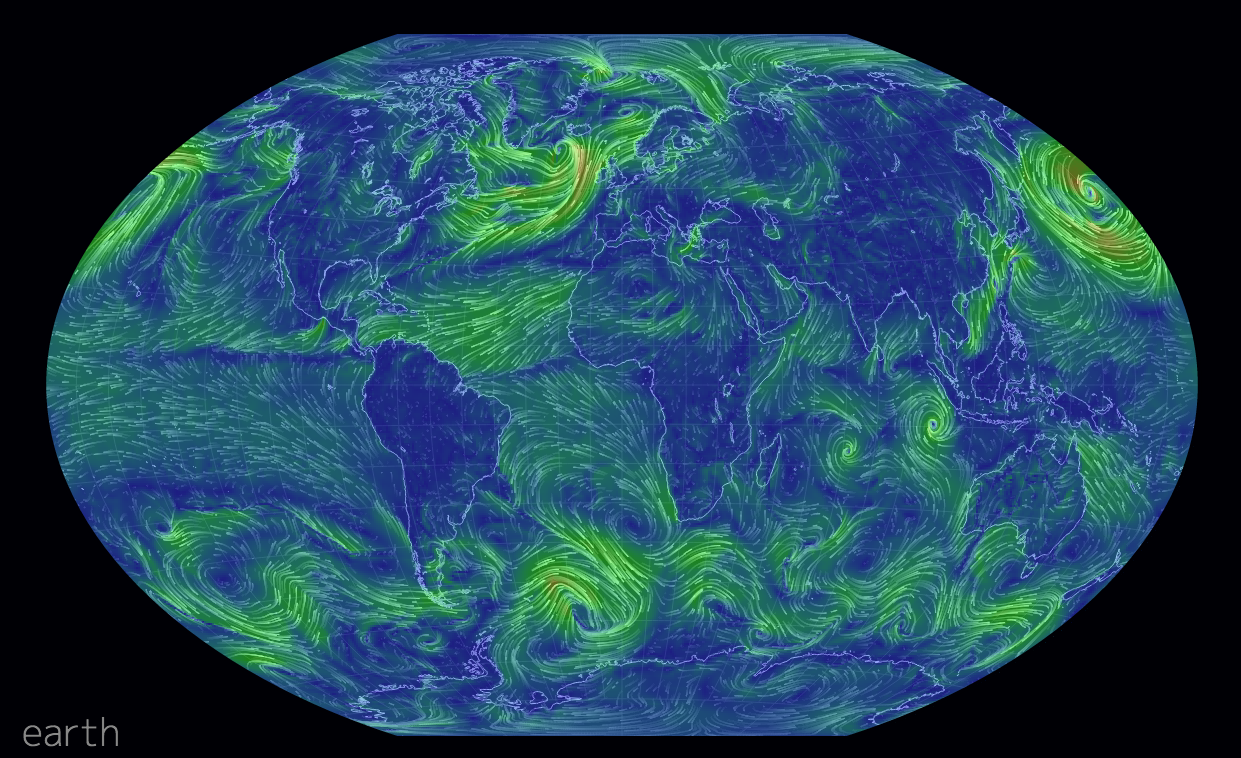
Most of us have likely seen the wind map by Fernanda Viegas and Martin Wattenberg. However, this new wind map takes the idea and makes it a bit more useful. It offers the user the opportunity to look at winds at different levels of the atmosphere. Or you can look at different projections. Some projections show wind patterns better than others. You can also see wind across the world, not just the United States.

Wind map
Wind map

Credit for the piece goes to Cameron Beccario.

Haiyan’s Destruction in Tacloban

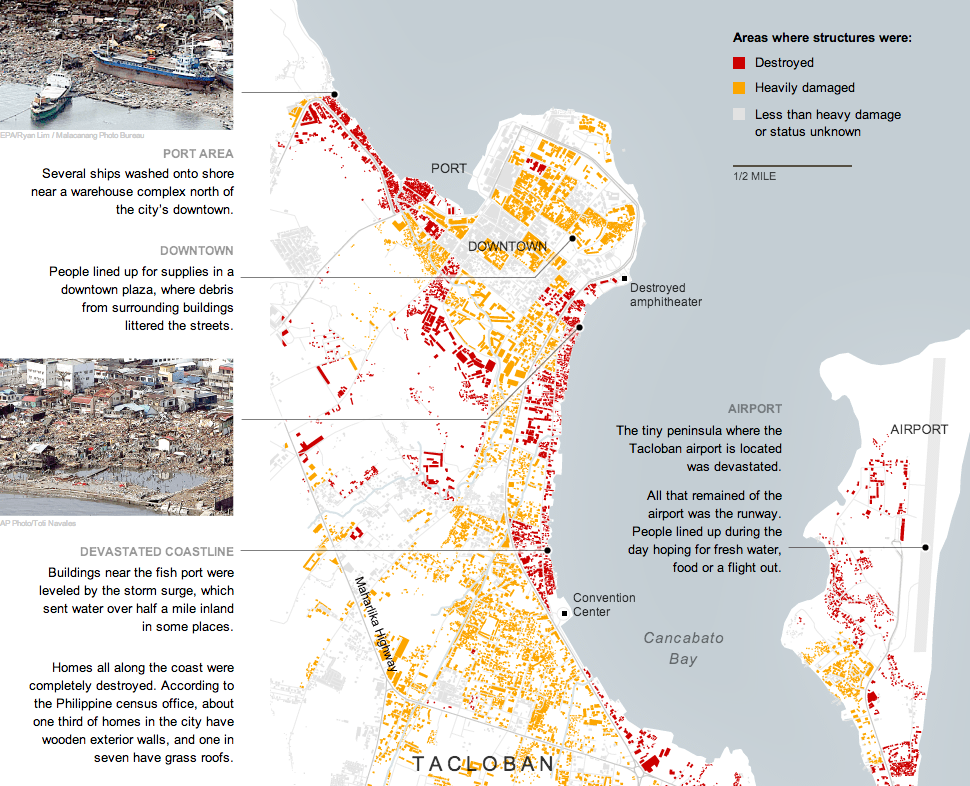
On 8 November, Typhoon Haiyan made landfall in the Philippines, killing what may well be 10,000 people. The New York Times covered much of the damage in Tacloban, perhaps the hardest hit city, in this interactive graphic.

Structural damage in Tacloban

Credit for the piece goes to the New York Times graphics department.

Is it Getting Warmer in Here?

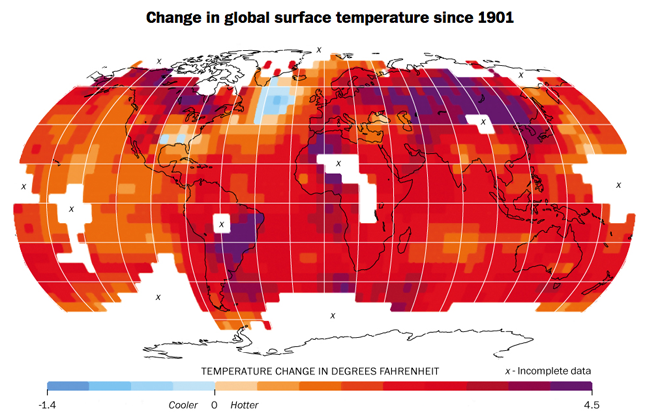
Yes, yes it is. This map from the Washington Post looks at global temperature change since 1901. The article it supports is about how scientists are now all but certain mankind is responsible for global warming. Personally I prefer the term climate change because global warming sounds as if everything warms and as this map shows, clearly that is not the case.

Global temperature change

Credit for the piece goes to Patterson Clark.

Boston’s Rising Tide

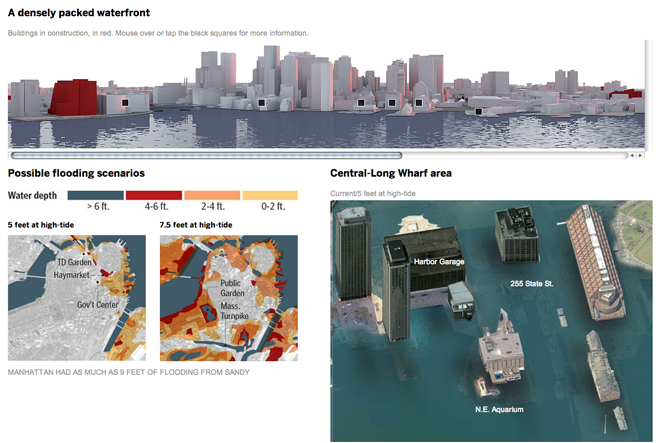
Sometimes maps just do not carry the visual weight of the potential impact of climate change, specifically rising tides. Swathes of blue over city maps from high altitude are intellectual exercises. Who works where? Where do I live? But when you can begin to see familiar buildings and sites swallowed up by a modest rise in the sea level, the hope is that people feel the impact.

A flooded Boston
A flooded Boston

My guess is that was the intention of the Boston Globe in this piece, which lets you explore a bit of an underwater Boston waterfront.

Credit for the piece goes to Chiqui Esteban.