The Ebola Outbreak in the Congo

Ebola, which killed 11,000 people in West Africa in 2014 (which I covered in a couple of different posts), is back and this time ravaging the Congo region, specifically the Democratic Republic of the Congo (DRC). The BBC published an article looking at the outbreak, which at 1,400 deaths is still far short of the West Africa outbreak, but is still very significant.
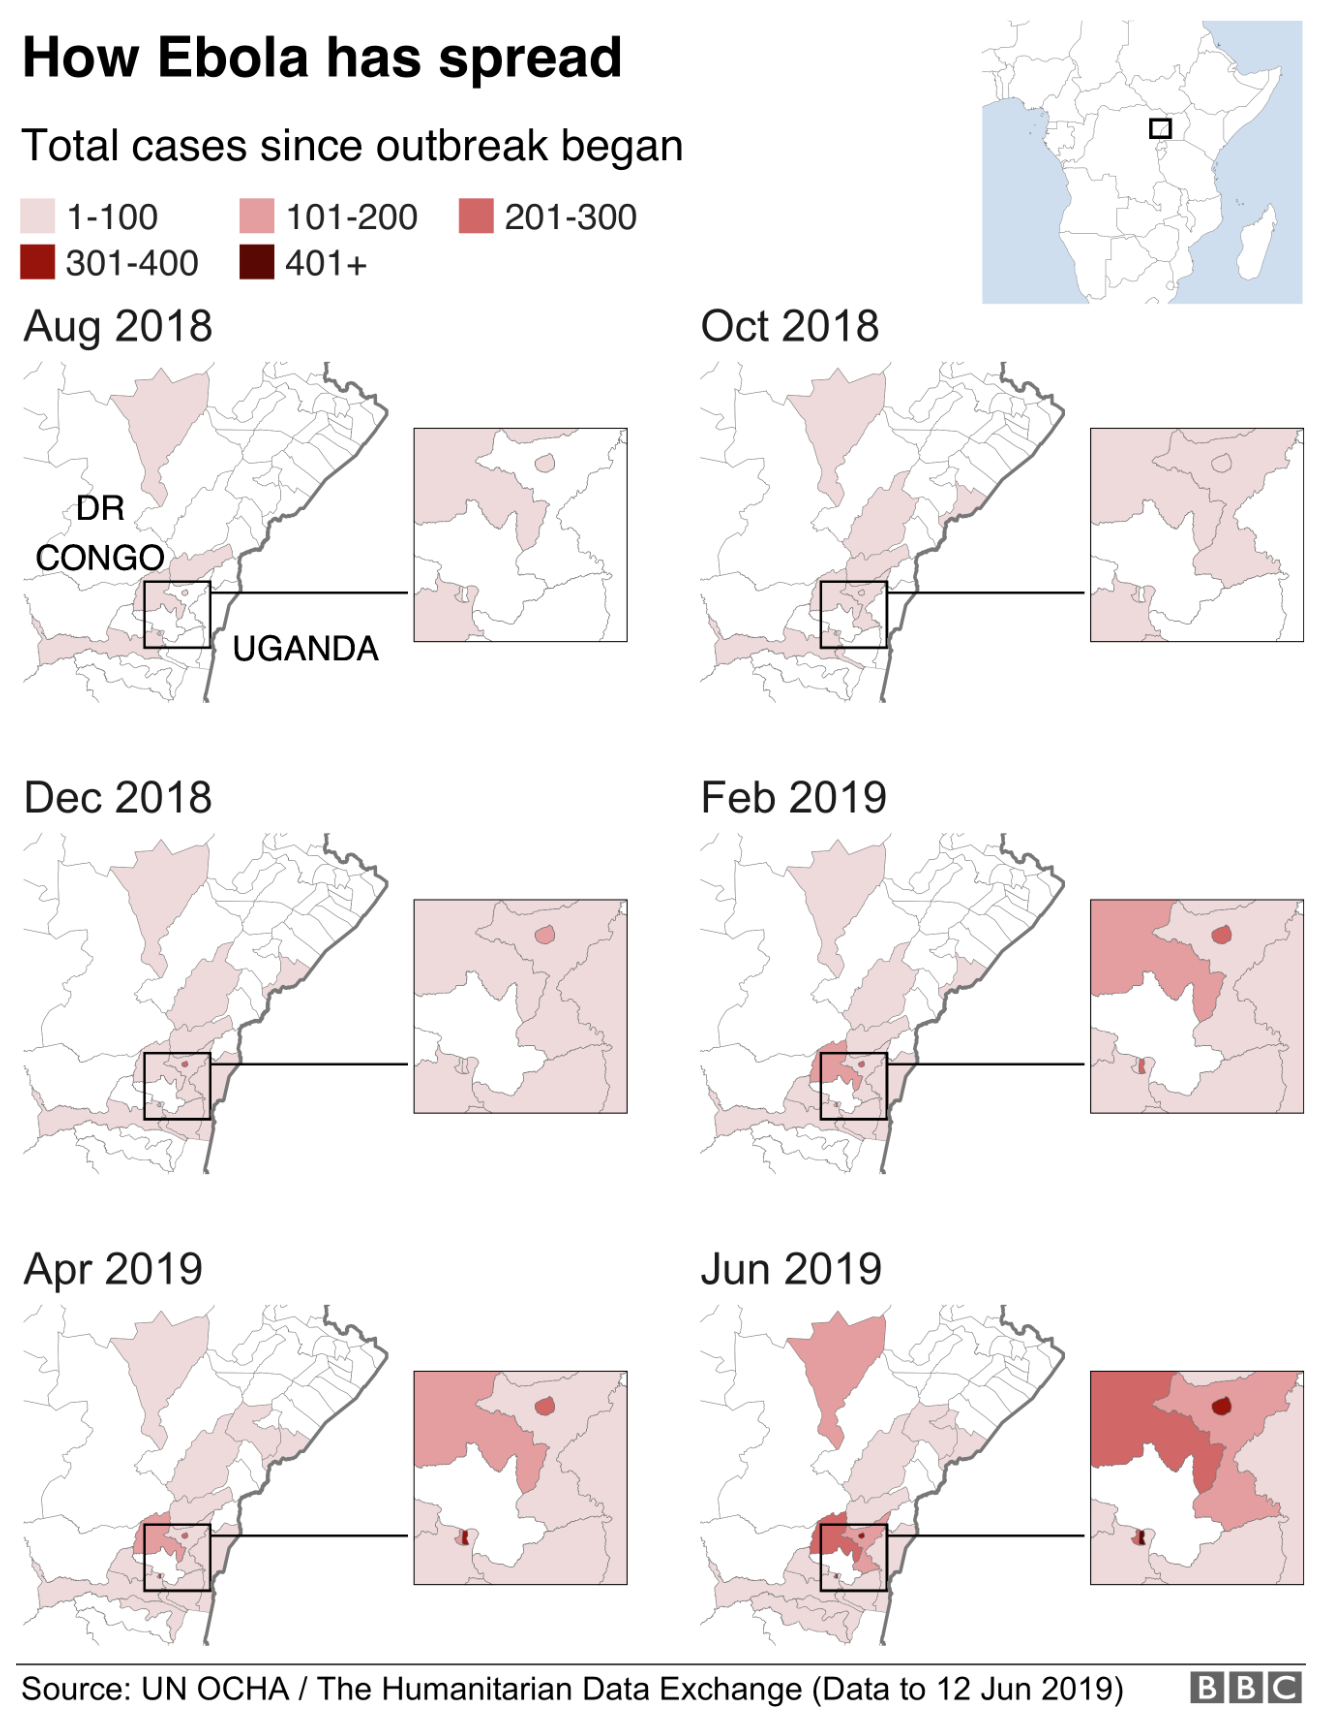
That's looking like a tenuous border right now…
That’s looking like a tenuous border right now…

The piece uses a small multiples of choropleths for western Congo. The map is effective, using white as the background for the no case districts. However, I wonder, would be more telling if it were cases per month? That would allow the user to see to where the outbreak is spreading as well as getting a sense of if the outbreak is accelerating or decelerating.

The rest of the article features four other graphics. One is a line chart that also looks at cumulative cases and deaths. And again, that makes it more difficult to see if the outbreak is slowing or speeding up. Another is how the virus works and then two are about dealing with the virus in terms of suits and the containment camps. But those are graphics the BBC has previously produced, one of which is in the above links.

Credit for the piece goes to the BBC graphics department.

The 2014/5 Ebola Outbreak in Context

Spoiler alert, it’s big. Thankfully Scientific American has attempted to put the West African outbreak in the context of all other Ebola outbreaks. I think the one thing missing, rather the one thing I would have done differently, is to include some kind of background element to show the difference in scale. A giant circle behind the whole graphic. Or a giant diamond. Of course the designer may not have had the space to do that, because the scale difference is just that extreme.

Putting the ongoing outbreak in context

Credit for the piece goes to Pitch Interactive for Scientific American.

We All Have to Die…But How?

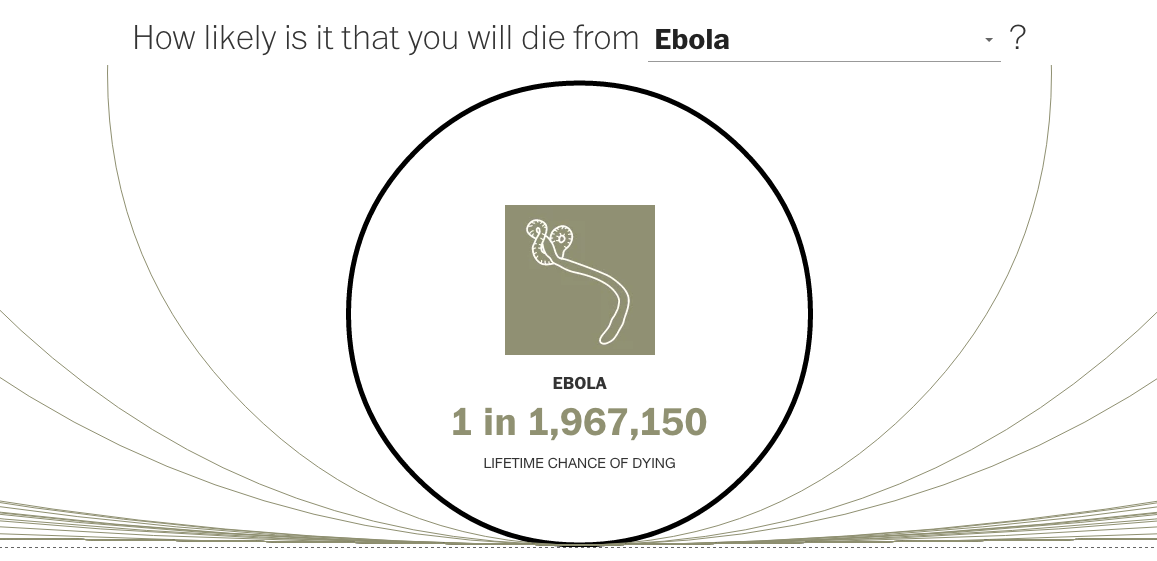
As the title says, we are all going to die one of these days. But what are the odds that Ebola will kill you? Turns out it is fairly small. Smaller than your pyjamas catching on fire and killing you. Or even your regular clothes catching fire. How did I know that? Well, the Washington Post put together a nice interactive piece to do just that. It starts you out at Ebola and works up to the most likely causes of death. If you are looking for your morning pick-me-up, this might not be it. Fair warning.

Small chance Ebola will kill you

Credit for the piece goes to Richard Johnson and Lazaro Gamio.

An Ebola Treatment Centre

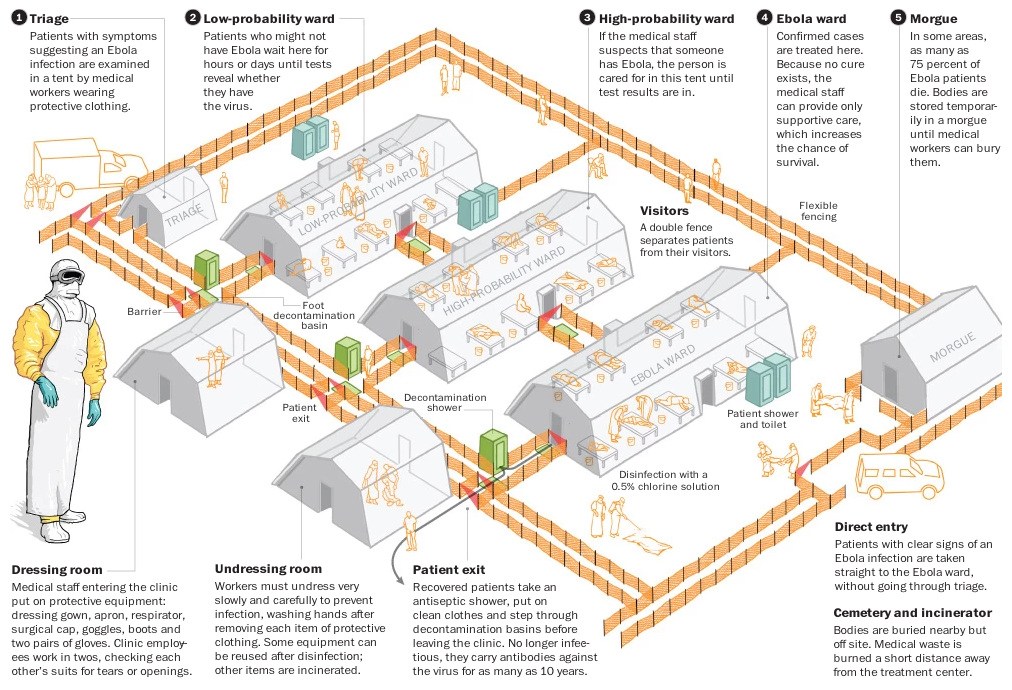
Last week we looked at the BBC and its rendition of an Ebola treatment centre. This week we are looking at the Washington Post and how they treated the same material. As you can imagine, with the same source material, the treatment is fairly similar. I do appreciate the colour applied to the various elements called out in the illustration. Though, to be super nitpick-y, I could probably do less orange with the fence. It becomes a bit distracting from some of the other details.

An Ebola treatment centre

Credit for the piece goes to Patterson Clark.

How Ebola Works/Kills

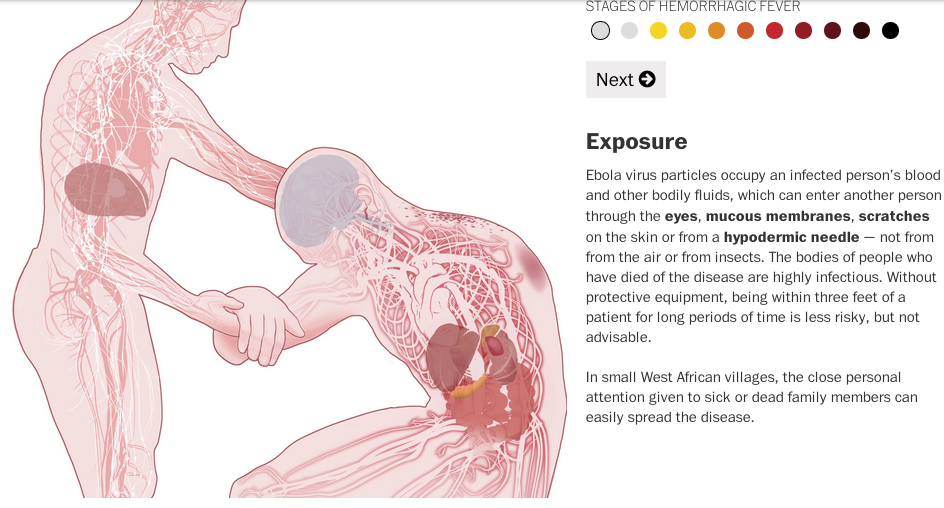
To continue with this week’s theme of Ebola, we are looking at another Washington Post article. Online the Post presents it as an interactive, guided explanation of how Ebola basically kills people. Spoiler, it is not pretty. But what I do really like about this online presentation is how the Post has a downloadable .pdf version of the piece available.

How Ebola works
How Ebola works

Credit for the piece goes to Patterson Clark, Darla Cameron, and Sohail Al-Jamea.

Ebola vs Other Infectious Diseases

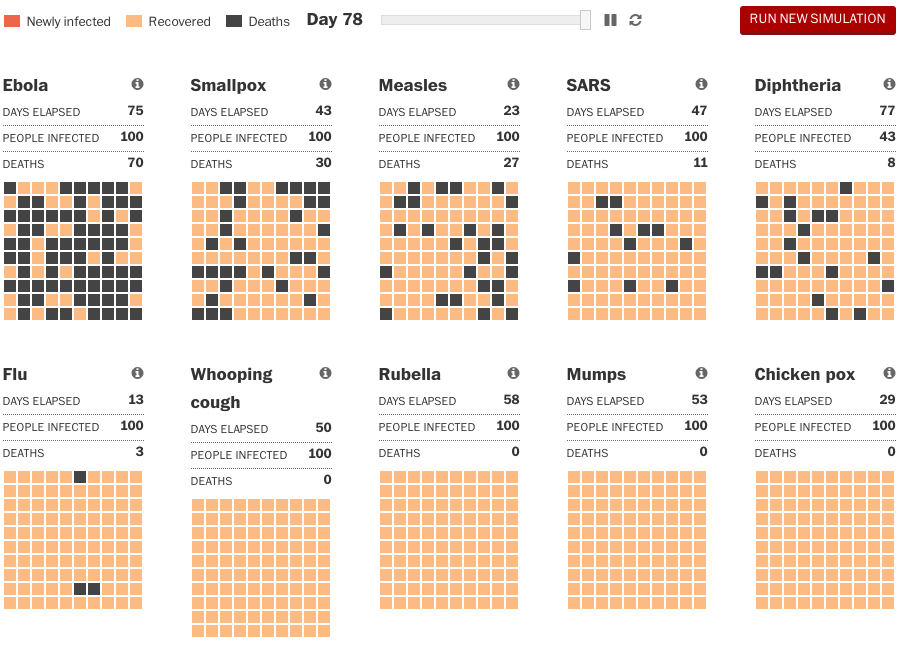
Yesterday we looked at the New York Times’s reporting of some basic facts about Ebola. Today to continue along the refutation of scaremongering path, we have an article from the Washington Post. I understand that people are afraid of Ebola, because if you catch it, you have a good chance you are going to die. The current strain for the outbreak in West Africa is about 50%. But, you are far more likely to catch less-deadly disease. Like the flu.

Comparing modelled outbreaks

Credit for the piece goes to Bonnie Berkowitz and Lazaro Gamio.

Ebola

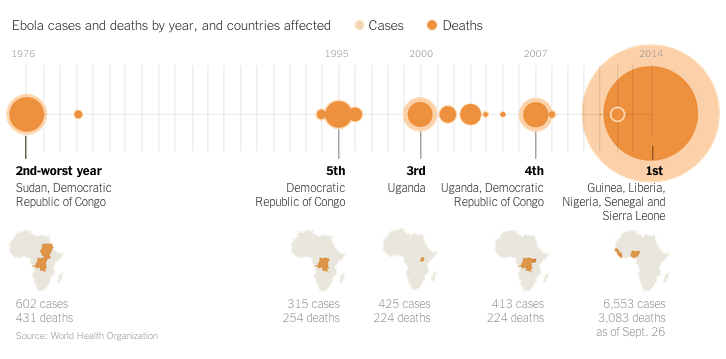
I really enjoy reading articles where graphics accompany the text and not just for the want of graphics. While the Ebola outbreak in West Africa is tragic, the data allows for some nice visualisation pieces. Additionally, one could say that the United States is victim to quite a bit of scaremongering as a result of a few isolated cases of Ebola in Dallas, Texas. Spoiler, an Ebola outbreak is not really a threat to the United States or Western Europe. Perhaps to relieve some of said scaremongering, the New York Times has a nice article titled Ebola Facts that outlines just that, the facts about Ebola. And guess what? The article is accompany by a number of useful inline graphics.

Ebola outbreaks
Ebola outbreaks

Credit for the piece goes to the New York Times’ graphics department.

Ebola Treatment Centres

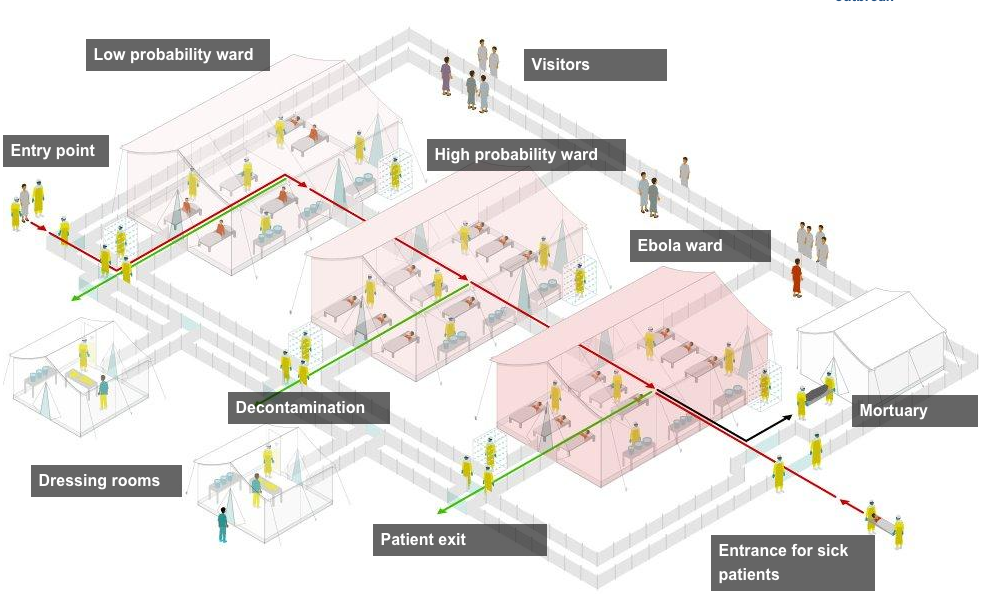
Ebola is still a thing. And it is still getting worse. Or rather, with deaths and/or infections in both Europe and the United States, we are finally paying a bit more attention to it. We have no cure for Ebola, but we still need to treat people for symptoms, but most importantly we need to isolate those infected from the broader population. How and where is this done? Thankfully, the BBC put together an interactive graphic illustrating a typical treatment centre. Each main section is a clickable link that explains the functions and key points to the different areas.

A treatment centre
A treatment centre

The article goes on to explain in more detail what is going on and does so with photos and also a map of treatment centres in Guinea, Sierra Leone, and Liberia.

Credit for the piece goes to the BBC graphics department.

Ebola on a Plane

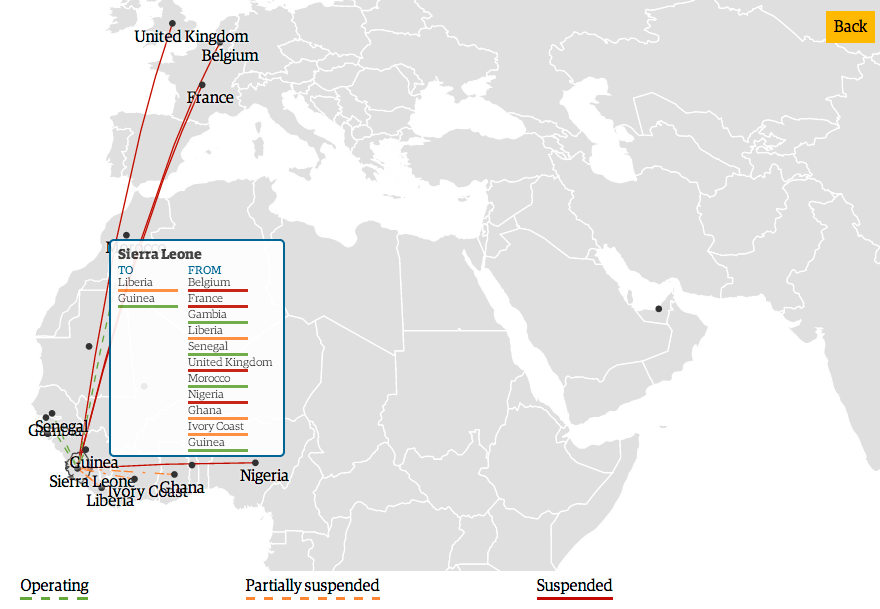
Definitely not really, but far more interesting than snakes. Today’s piece comes from the Guardian. Admittedly, the piece and thus the data is a month old, but it still is an interesting way of looking at the impact of the Ebola outbreak in Africa.

Flight impacts in Sierra Leone

The graphic begins with a map highlighting the spread of the outbreak and some of the immediate measures taken by different governments. By clicking on a button, however, the user can get more details on the specific impact of quarantines and border closures. In this case, I have clicked on Sierra Leone and can see that a good number of flights are either suspended or partially suspended.

Credit for the piece goes to Achilleas Galatsidas and Mark Anderson.

In the World of Damnit, Man

If you haven’t heard, there is a fairly significant outbreak of Ebola occurring in western Africa these days. The most attention has been drawn since the death of an American national in Nigeria. He had been working for the Liberian government and collapsed at the Lagos airport and died shortly thereafter. So the Centers for Disease Control has been reporting and advising on the outbreak and they have at least two graphics.

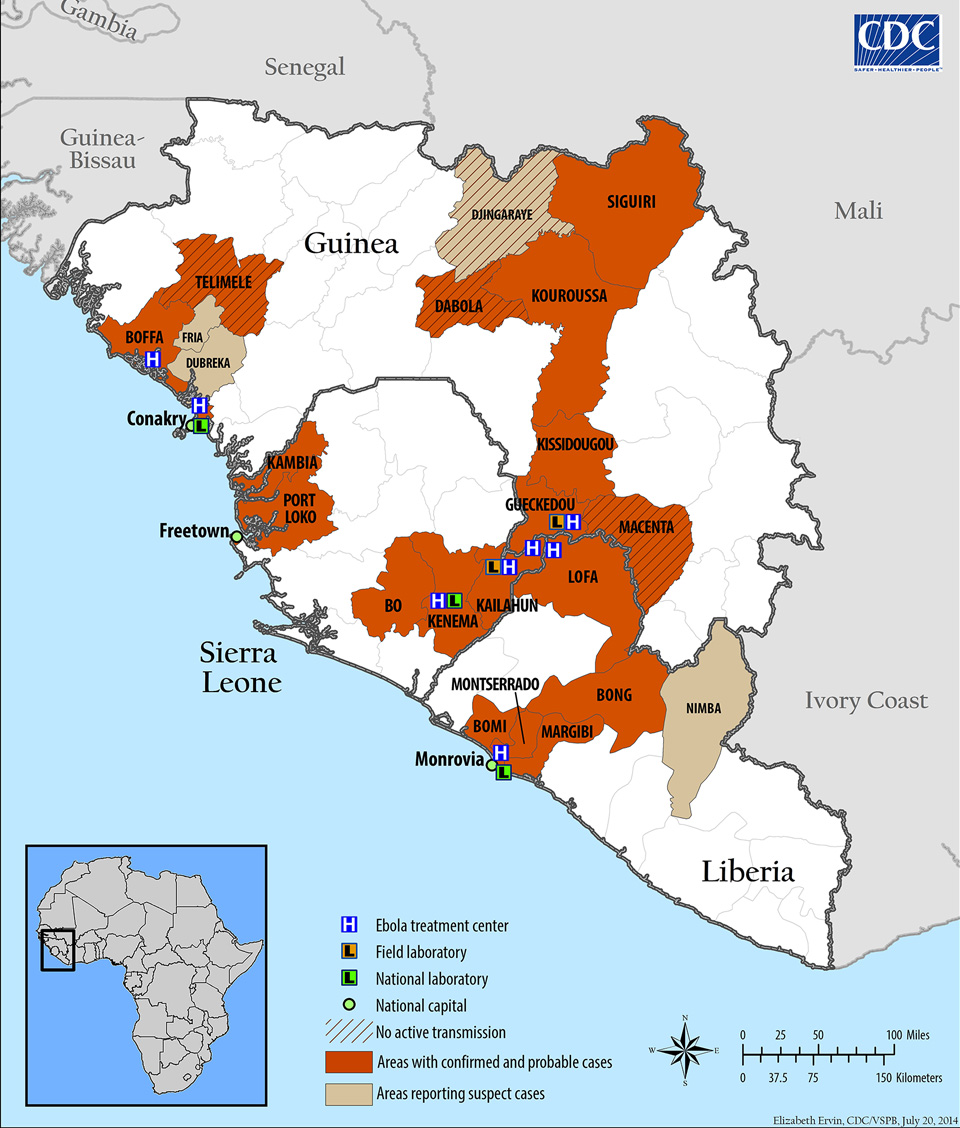
This first is good. It looks at the spread of the disease through different areas of several countries. It also identifies sites of interest for treating/containing the outbreak.

Outbreak map as of 3 August

The second, however, takes prominence as an “infographic” on the CDC homepage. How this qualifies as an infographic I have no idea. It is…just sad. I mean I get it, too many people do not understand how Ebola is transmitted. But to call this an infographic does disservice to other, real infographics.

The infographic
The infographic

Credit for the map goes to Elizabeth Ervin. For the “infographic”, no idea.