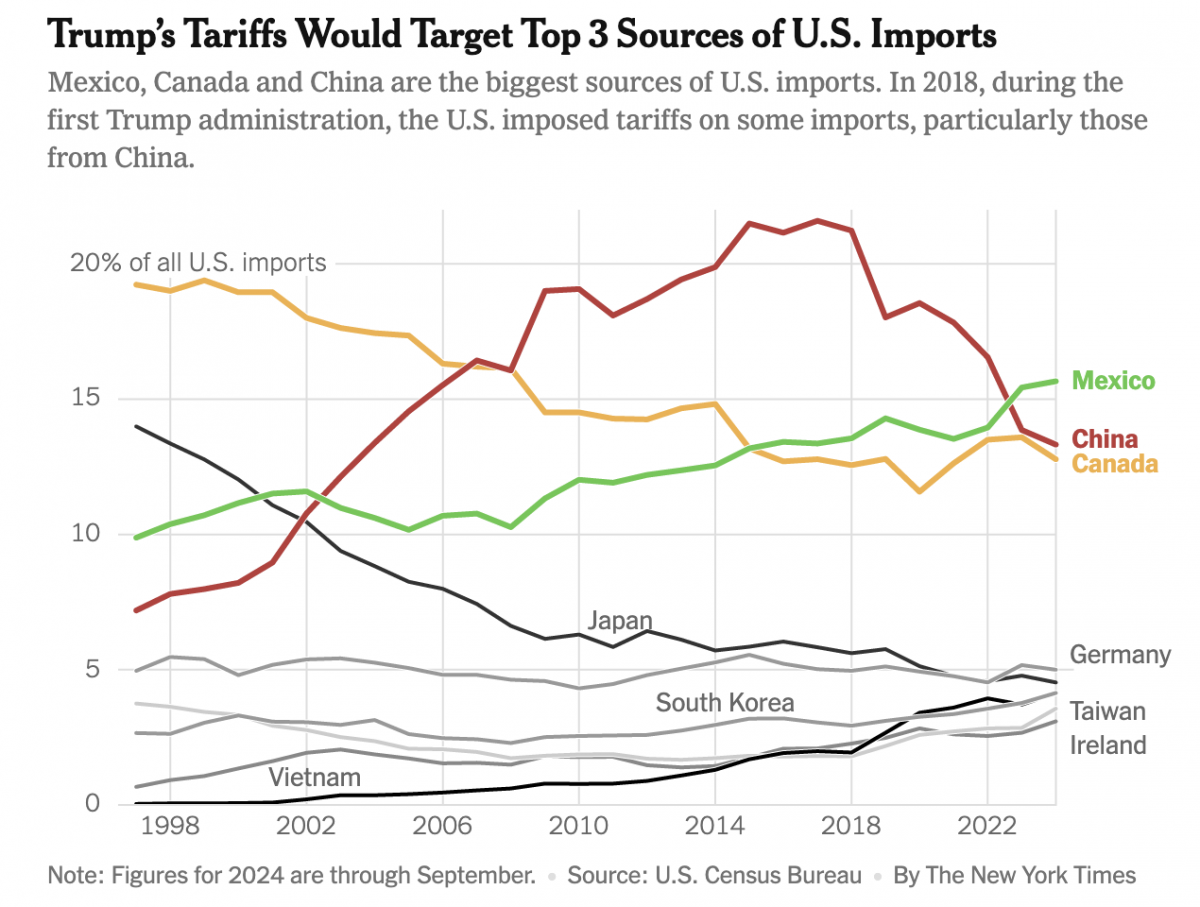
Imports, Tariffs, and Taxes, Oh My!

Apologies, all, for the lengthy delay in posting. I decided to take some time away from work-related things for a few months around the holidays and try to enjoy, well, the holidays. Moving forward, I intend to at least start posting about once per week. After all, the state of information design these days provides me a lot of potential critiques.

Let us start with the news du jour , the application of tariffs on China and the delayed imposition on both Canada and Mexico. Firstly, let us be very clear what a tariff is. A tariff is a tax paid by importers or consumers on goods sourced from outside the country. In this case, we are talking about Canadian, Mexican, and Chinese imports and the United States slapping tariffs on goods from those countries. Foreign governments do not pay money to the United States, neither Canada, nor Mexico, nor China will pay money to the United States.

You will.

You should expect your shopping costs to increase, whether that is on the price of gasoline (imported from Canada), fast fashion apparel (from China), or avocados (from Mexico). On the more durable goods side, homes are built with Canadian lumber and your automobiles with parts sourced from across North America—the reason why we negotiated NAFTA back in the 1990s.

Now that we have established what tariffs are, why is the Trump administration imposing them? Ostensibly because border security and fentanyl. What those two issues have to do with trade policy and economics…I have no idea. But a few news outlets created graphics showing US imports from our top-five trading partners.

First I saw this graphic from the New York Times. It is a variation of a streamgraph and it needs some work.

A streamgraph type chart from the New York Times

To start, at any point along the timeline, can you roughly get a sense of what the value for any country is? No. Because there is no y-axis to provide a sense of scale. Perhaps these are the top import sources and these are their share of the total imports? Read the fine print and…no. These are the countries with a minimum of 2% share in 2024, which is approximately 75% of US imports.

This graphic fails at clearly communicating the share of imports. You need to somehow extrapolate from the y-height in 2024 given the three direct labels for Canada, Mexico, and China what the values are at any other point in time or for any other country.

Nevertheless, the chart does a few things nicely. It does highlight the three countries of importance to the story, using colours instead of greys. That focuses your attention on the story, whilst leaving other countries of importance still available for your review. Secondly, the nature of this chart ranks the greatest share as opposed to a straight stacked area chart.

Overall, for me the chart fails on a number of fronts. You could argue it looks pretty, though.

The aforementioned stacked area charts—also not a favourite of mine for this sort of comparison—forces the designer to choose a starting country in this case and then stack other countries atop it.

A stacked area chart from the BBC

What this chart does really well, especially well compared to the previous New York Times example is provide content for all countries across all time periods by the inclusion of the y-axis. Like the Times graphic it focuses attention on Canada, Mexico, and China with colour and uses grey to de-emphasise the other countries. You can see here how the Times’ decision to exclude all countries below 2% can skew the visual impact of the chart, though here all countries below Japan (everything but the top-five) are grouped as other.

Personally, the inclusion of the specific data labels for Canada, Mexico, and China distract from the visualisation and are redundant. The y-axis provides the necessary framework to visually estimate the share. If the reader needs a value to the precision level of tenths, a table may be a better option.

I could not find one of the charts I thought I had bookmarked and so in an image search I found a chart from one of my former employers on the same topic (though it uses value instead of share) and it is worth a quick critique.

A stacked area chart from Euromonitor International

Towards the end of my time there, I was creating templates for more wide-screen content. My fear from an information design and data visualisation standpoint, however, was the increased stretch in simple, low data-intensity graphics. This chart incorporates just 42 data points and yet it stretches across 1200 pixels on my screen with a height of 500.

Compare that to the previous BBC graphic, which is also 1200 pixels, but has a greater height of 825 pixels. Those two dimensions give ratios of 2.4 for Euromonitor International and 1.455 for the BBC. Neither is the naturally aesthetically pleasing golden ratio of 1.618, but at least the BBC version is close to Tufte’s recommended 1.5–1.6. The idea behind this is that the greater the ratio, the softer the slope of the line. This can make it more difficult to compare lines. A steeper slope can emphasise changes over time, especially in a line chart. You can roughly compare this by looking at the last few years of the longer time span in the BBC graphic to the entirety of this graphic. You can more easily see the change in the y-axis because you have more pixels in which to show the change.

Finally we get to another New York Times graphic. This one, however, is a more traditional line chart.

A line chart from the New York Times

And for my money, this is the best. The data is presented most clearly and the chart is the most legible and digestible. The colours clearly focus your attention on Canada, Mexico, and China. The use of lines instead of stacked area allow the top importer to “rise” to the top. You can track the rapid rise of Chinese imports from the late 1990s through to the first Trump administration and the imposition of tariffs in 2018—note the significant drop in the line. In fact you can see the impact in Mexico becoming the United States’ top trading partner in recent years.

Over the years, if I had a dollar for every time I was told someone wanted a graphic made “sexier” or with more “sizzle” or made “flashier”, I would have…a bigger bank account. The issue is that “cooler” graphics do not always lead to clearer graphics. Graphics that communicate the data better. And the guiding principle of information design and data visualisation should be to make your graphics clear rather than cool.

Credit for the New York Times streamgraph goes to Karl Russell.

Credit for the BBC graphic goes to the BBC graphics department.

Credit for the Euromonitor International graphic goes to Justinas Liuima.

Credit for the New York Times line chart goes to the New York Times.

Olympic Recap/Retro

Every four years (or so) I have to confess that I think fondly back upon my former job, because I worked with a few wonderful colleagues of mine on some data about the Olympics. And the highlight was that we had a model to try and predict the number of medals won by the host country as we were curious about the idea of a host nation bump. In other words, do host countries witness an increase in their medal count relative to their performance in other Olympiads?

We concluded that host nations do see a slight bump in their total medal count and we then forecast that we expected Team GB (the team for Great Britain and Northern Ireland) to win a total of 65 medals. We reached 64 by the final day and it wasn’t until the women’s pentathlon when, in maybe the last event, Team GB won a silver medal bringing its total to 65, exactly in line with our forecast.

Probably the most Olympics I’ve ever watched.

Of course we also looked at the data for a number of other things, including if GDP per capita correlated to Olympic performance. We also looked at BMI and that did yield some interesting tidbits. But at the end of the day it was the medal forecast that thrilled me in the summer of 2012.

So yeah, today’s a shameless plug for some old work of mine. But I’m still proud of it two olympiads later.

If you’d like to see some of the pieces, I have them in my portfolio.

Credit for the piece is mine.

Chinese Urban Clusters

Yesterday the Economist posted a graphic about Chinese urban clusters, of which the Chinese government is planning to create 19 as part of a development strategy. In terms of design, though, I saw it and said, “I remember doing something like that several years ago”.

The Economist piece looks at just the geography of the Chinese clusters. It highlights three in particular it discusses within the article while providing population numbers for those clusters. Spoiler: they are large.

The Economist graphic does little else beyond labelling the cities and the highlighting of the three features clusters. But that is perfectly okay, because that was probably all the graphic was required to do. I am actually impressed that they were able to label every city on the map. As you will see, we quickly abandoned that design idea.

The Chinese government's new urban cluster plan
The Chinese government’s new urban cluster plan

So back in 2015, using 2014 data, my team worked on a series of graphics for a Euromonitor International white paper on Chinese cities. The clusters that the analysts identified, however, were just that, ones identified by researchers. Since the Chinese government had not yet created this new plan.

We added some context to our cluster map

We also looked at more cities and added some vital context to the cluster map by working to identify the prospects of the various Chinese provinces. Don’t ask me what went into that metric, though, since I forget. The challenge, however, was identifying the four different tiers of Chinese city and then differentiating between the three different cluster types while overlaying that on a choropleth. Then we added a series of small multiples to show how now all provinces are alike despite having similar numbers of cities.

Credit for the Economist piece goes to the Economist Data Team.

Credit for the Euromonitor piece is mine. I would gladly give a shoutout to those that worked with me on that project…but it’s been so long I forget. But I’m almost certain both Lindsey Tom and Ciana Frenze helped out, if not on that graphic, on other parts of the project.

Bitcoin Land

Sorry, I ran into some technical problems this morning so this is going up this afternoon with an added bit at the end.

I’m not really sure this piece should go onto the blog. But I like it. And this is still my blog. So what the hell.

I grew up a big fan of games like Sim City, where you could create your own universes. And in the world of infographics, you do occasionally see the isometric drawings of cities, but I find they often lack representative value. Here, in this piece from Politico Magazine, we have the Bitcoin landscape.

The different buildings represent different elements of the cryptocurrency’s ecosystem, from supporting markets, regulators, utility companies, &c. Later on in the article, the different sections are broken out and labelled and annotated. Additional elements are also brought in to explain ancillary parts of the Bitcoin landscape. All the while keeping the same style. Very well done.

Reticulating splines

This detail looks at some of the things existing outside the specific Bitcoin environment, e.g. other cryptocurrencies. And the aforementioned utility companies that provide the necessary power for the computations.

It even has a tram system…

I kind of wish the universe was larger, though. If only for the purely selfish purpose of getting lost in the illustrations.

Since I’ve had today to think more about this, it reminded me of one of my favourite projects I got to work on from a couple of years ago.

Unfortunately for me, my illustration skills are not quite top-notch. But I did get to direct a similar project, working with a talented designer—now expert craftsman—who can in fact draw. And since it’s not often I get to show this work, why not. We used consumer survey data describing the average middle class household to, well, visualise said middle class household. It took a lot longer than I think anyone thought, so we never attempted the style again. But the designer did some great work on this.

One of my favourite projects that I oversaw as Captain Art Director (not my real title).

Credit for the Politico piece goes to Patterson Clark and Todd Lindeman.

Credit for the Euromonitor piece goes to Benjamin Byron and myself.

Surviving Holiday Parties

The Christmas holidays are known for many things. One of them is the office holiday party. Today’s post looks at a flow chart put together by the company for which I work, Euromonitor International. As it was put together by the design team, you might very well think that I had something to do with it. But I couldn’t possibly comment.

The beginning of the flow chart

Credit for the piece goes to the Euromonitor design team.

Does a High Average BMI Impact a Country’s Chance at the Olympics?

It turns out not so much. A comparison of the 2008 data for average BMI (coarsely how fat a person is) for countries across their economic productivity (GDP per capita) and total medals won shows that a country’s health culture does not greatly impact said country’s Olympic chances.

Does BMI Impact Olympic Performance?

This is another from my work series on infographics for the Olympics.

2012 Olympics: What Makes a Winner (and Will the UK Be One)?

The Olympics are coming, the Olympics are coming. (As if you didn’t know.) In a rare moment of seeing my work outside of my company’s paywall, I can post a few infographics I have created for the 2012 Summer Games in London. The series looks at a few different non-Olympic variables like GDP per capita and mean BMI and sees whether they impact total medal counts in the Olympics.

This first datagraphic (to use my company’s internal language) looks at what makes a winner and will the UK be one this summer. The main chart in the piece compares GDP per capita performance to total medal count in each Olympic year from 1988 to 2008. And yes, we are predicting the UK to win a total of 65 medals this summer.

What Makes an Olympics Winner

In the interest of full disclosure, I work as the senior graphic designer for Euromonitor International. This series was not intended to be used as part of marketing/promotional piece (I probably need to include the link to download that document here), but instead I designed them all as client-only content. But since others decided to use my work as marketing material, I am fortunately allowed to share it with all of you via my blog. So yeah, that’s pretty cool. Enjoy.