Corona’s Moment in Your Life

Earlier this week I was on the social medias when I came across a graphic some people were sharing that was meant to be inspirational. It had a giant circle and then a small black pixel that represented “this moment”. Of course, how you define the moment is entirely subjective.

But it made me wonder, if we looked at the coronavirus Covid-19 pandemic as a moment in our lives, how big of a moment is it? Well, I went to the CDC to get a sense of the average life expectancy of an American and then I got the fraction of that lifespan that is the last six months. And, well take a look.
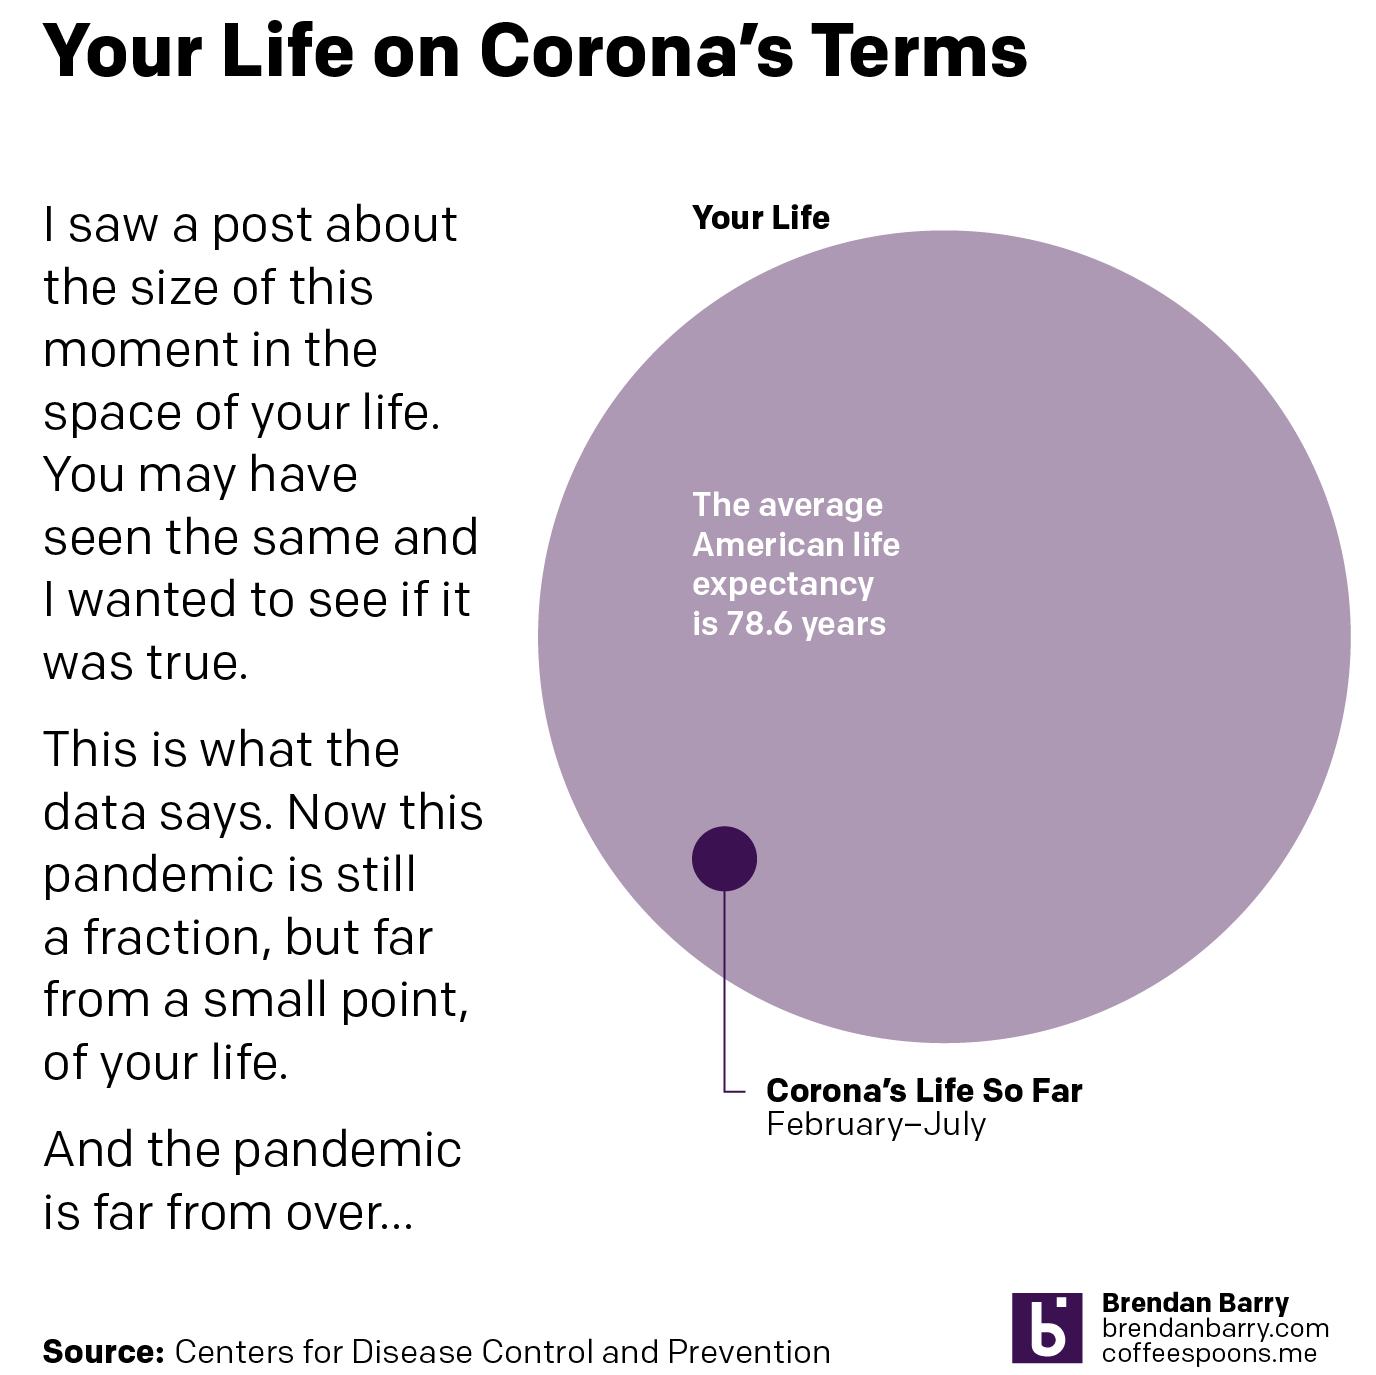
Corona in your lifespan
A not so insignificant span of time

As you can see, the Covid-19 pandemic is more than just a pixel. It’s a significant moment, and of course the pandemic is ongoing. There are new concerns that the 2020 Olympics, now postponed to 2021, may not happen in 2021.

That dot represents graduations, weddings, funerals, birthdays, anniversaries, holidays, opportunities for education, career advancement, life goals all delayed or in some cases missed and never to return.

And while the rest of the world shows some signs of improvement, for my American audience, things are going from bad to worse.

So Happy Friday, everyone.

Europe is More than the Big States

First, I want to start with a housekeeping note. Your author will be travelling for work and then a short autumn holiday. And so while I may be able to sneak a post or two in, I generally would not expect anything until next Friday, 12 October.

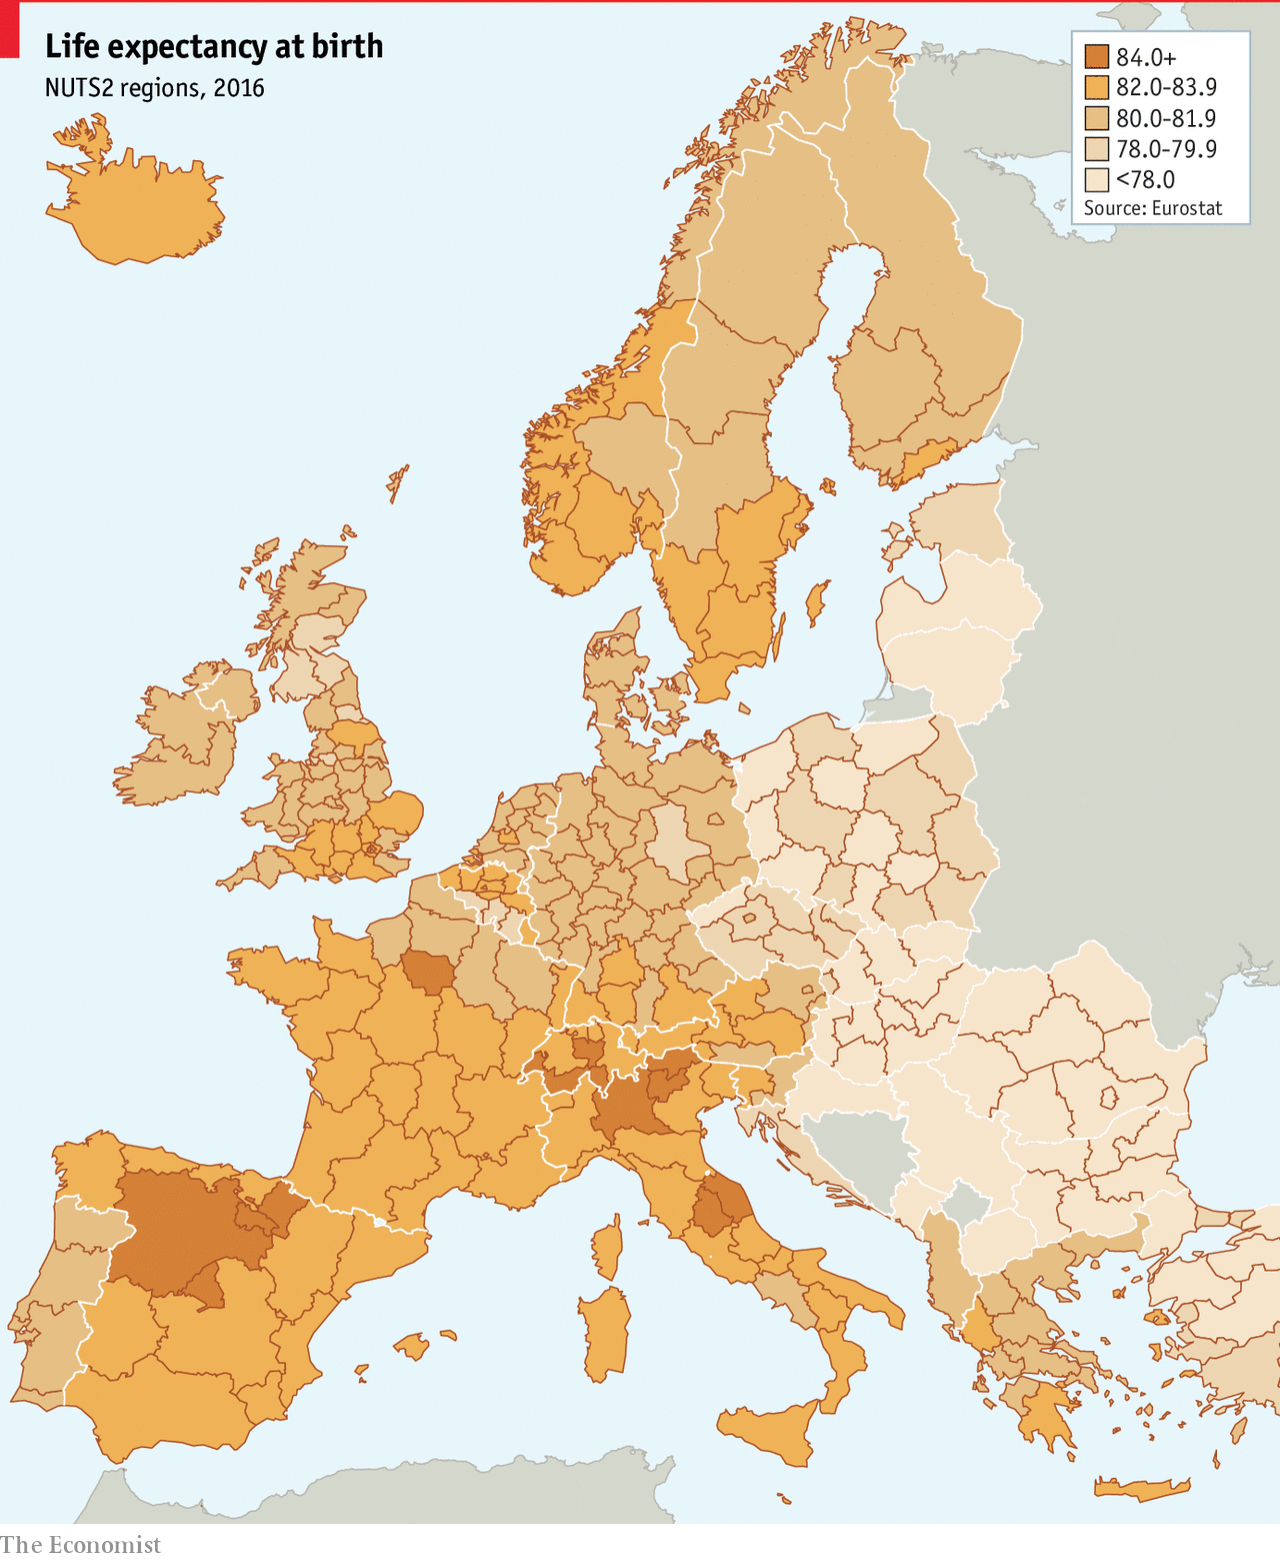
But let’s end this string of posts with a map. It is a choropleth, so in one sense there is nothing crazy going on here. The map comes from the Economist, which published an article on life expectancy throughout Europe and the big takeaway is that it is lower in the east than the west.

Apparently life is pretty good in northern Spain

The great part of the map, however, is that we get to see a more granular level of detail. Usually we just get a view of the European states, which presents them as an even tone of one shade or one colour. Here we can see the variety of life expectancy in the UK, France, and Belgium, and then still compare that to eastern Europe.

Of course creating a map like this demands data to drive it. Do data sets exist for the sub-national geographic units of EU or European states? Sometimes not. And in those cases, if you need a map, the European state choropleth is the choice you have to make. I just hope that we get to see more data sets like this with more granular data to present a more complex and patterned map.

Credit for the piece goes to the Economist Data Team.

Life Expectancy in the US and All Its States

Happy Monday, all.

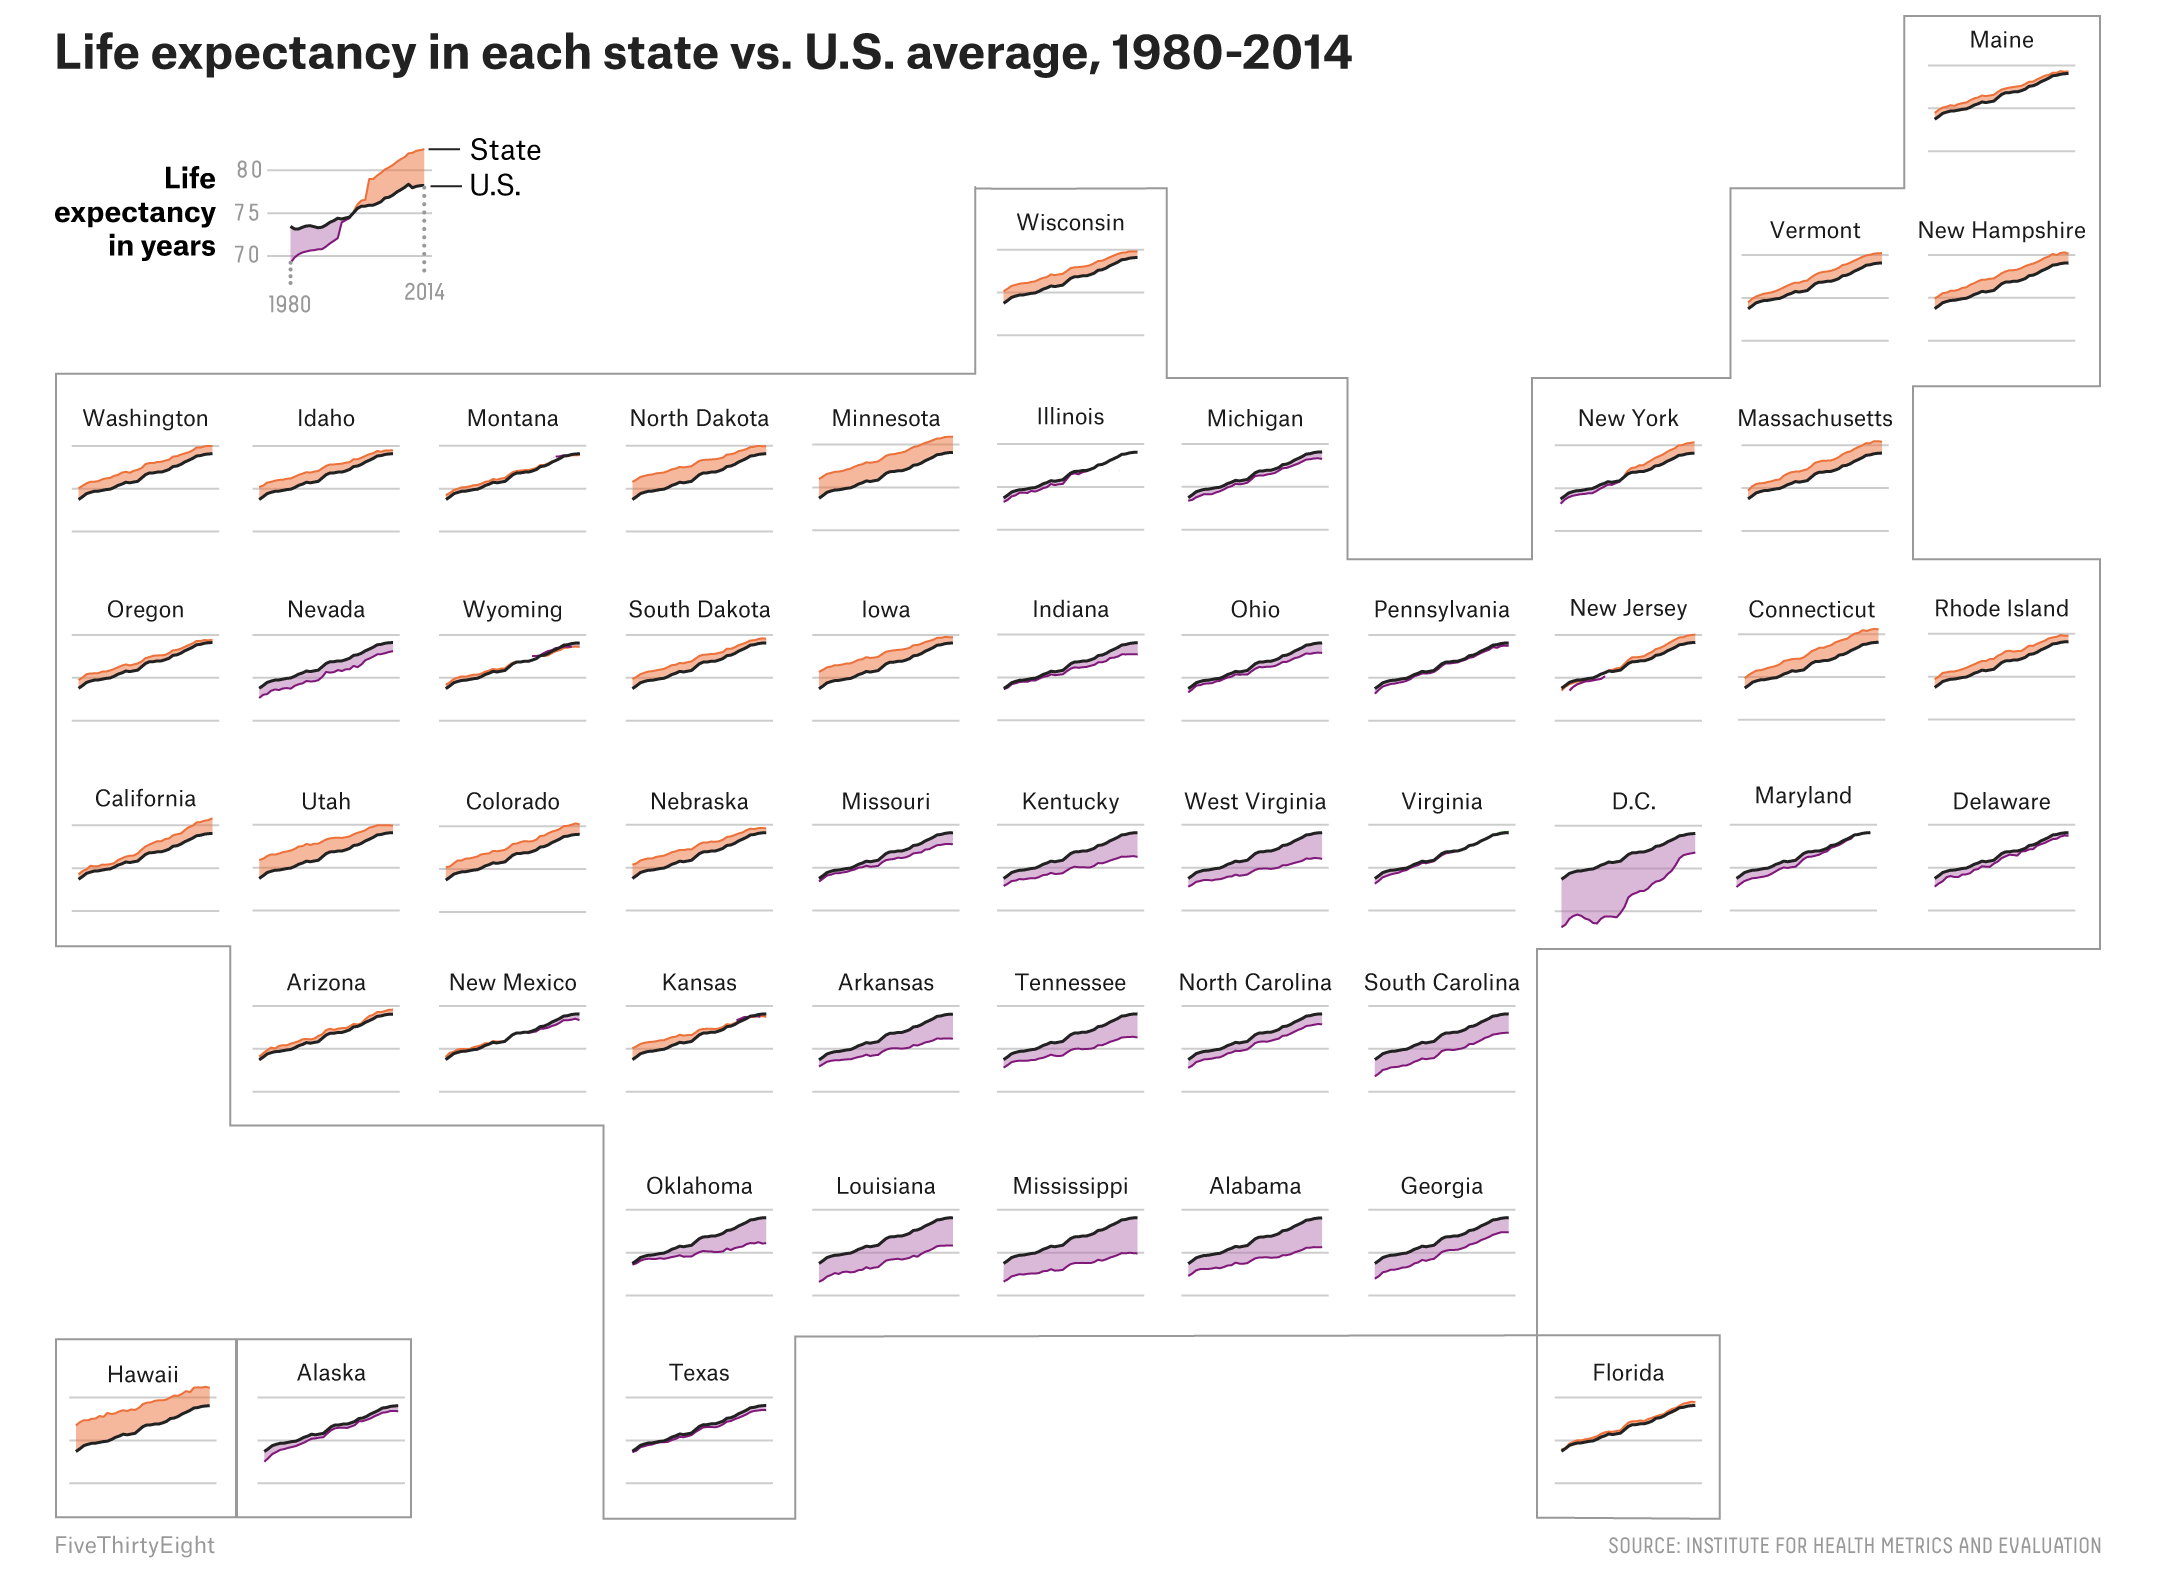
If this week’s news cycle cooperates, I am going to try and catch up on some things I have seen over the last several weeks that got bumped because of, well, Trump usually. Today we start with a piece on life expectancy from FiveThirtyEight.

The piece begins with a standard choropleth to identify, at county levels, pockets of higher mortality. But what I really like is this small multiples map of the United States. It shows the changes in life expectancy for all 50 states. And the use of colour quickly shows, for those states drastically different than the national average, are they above or below said average.

Look at all the little boxes

Credit for the piece goes to the FiveThirtyEight graphics department.