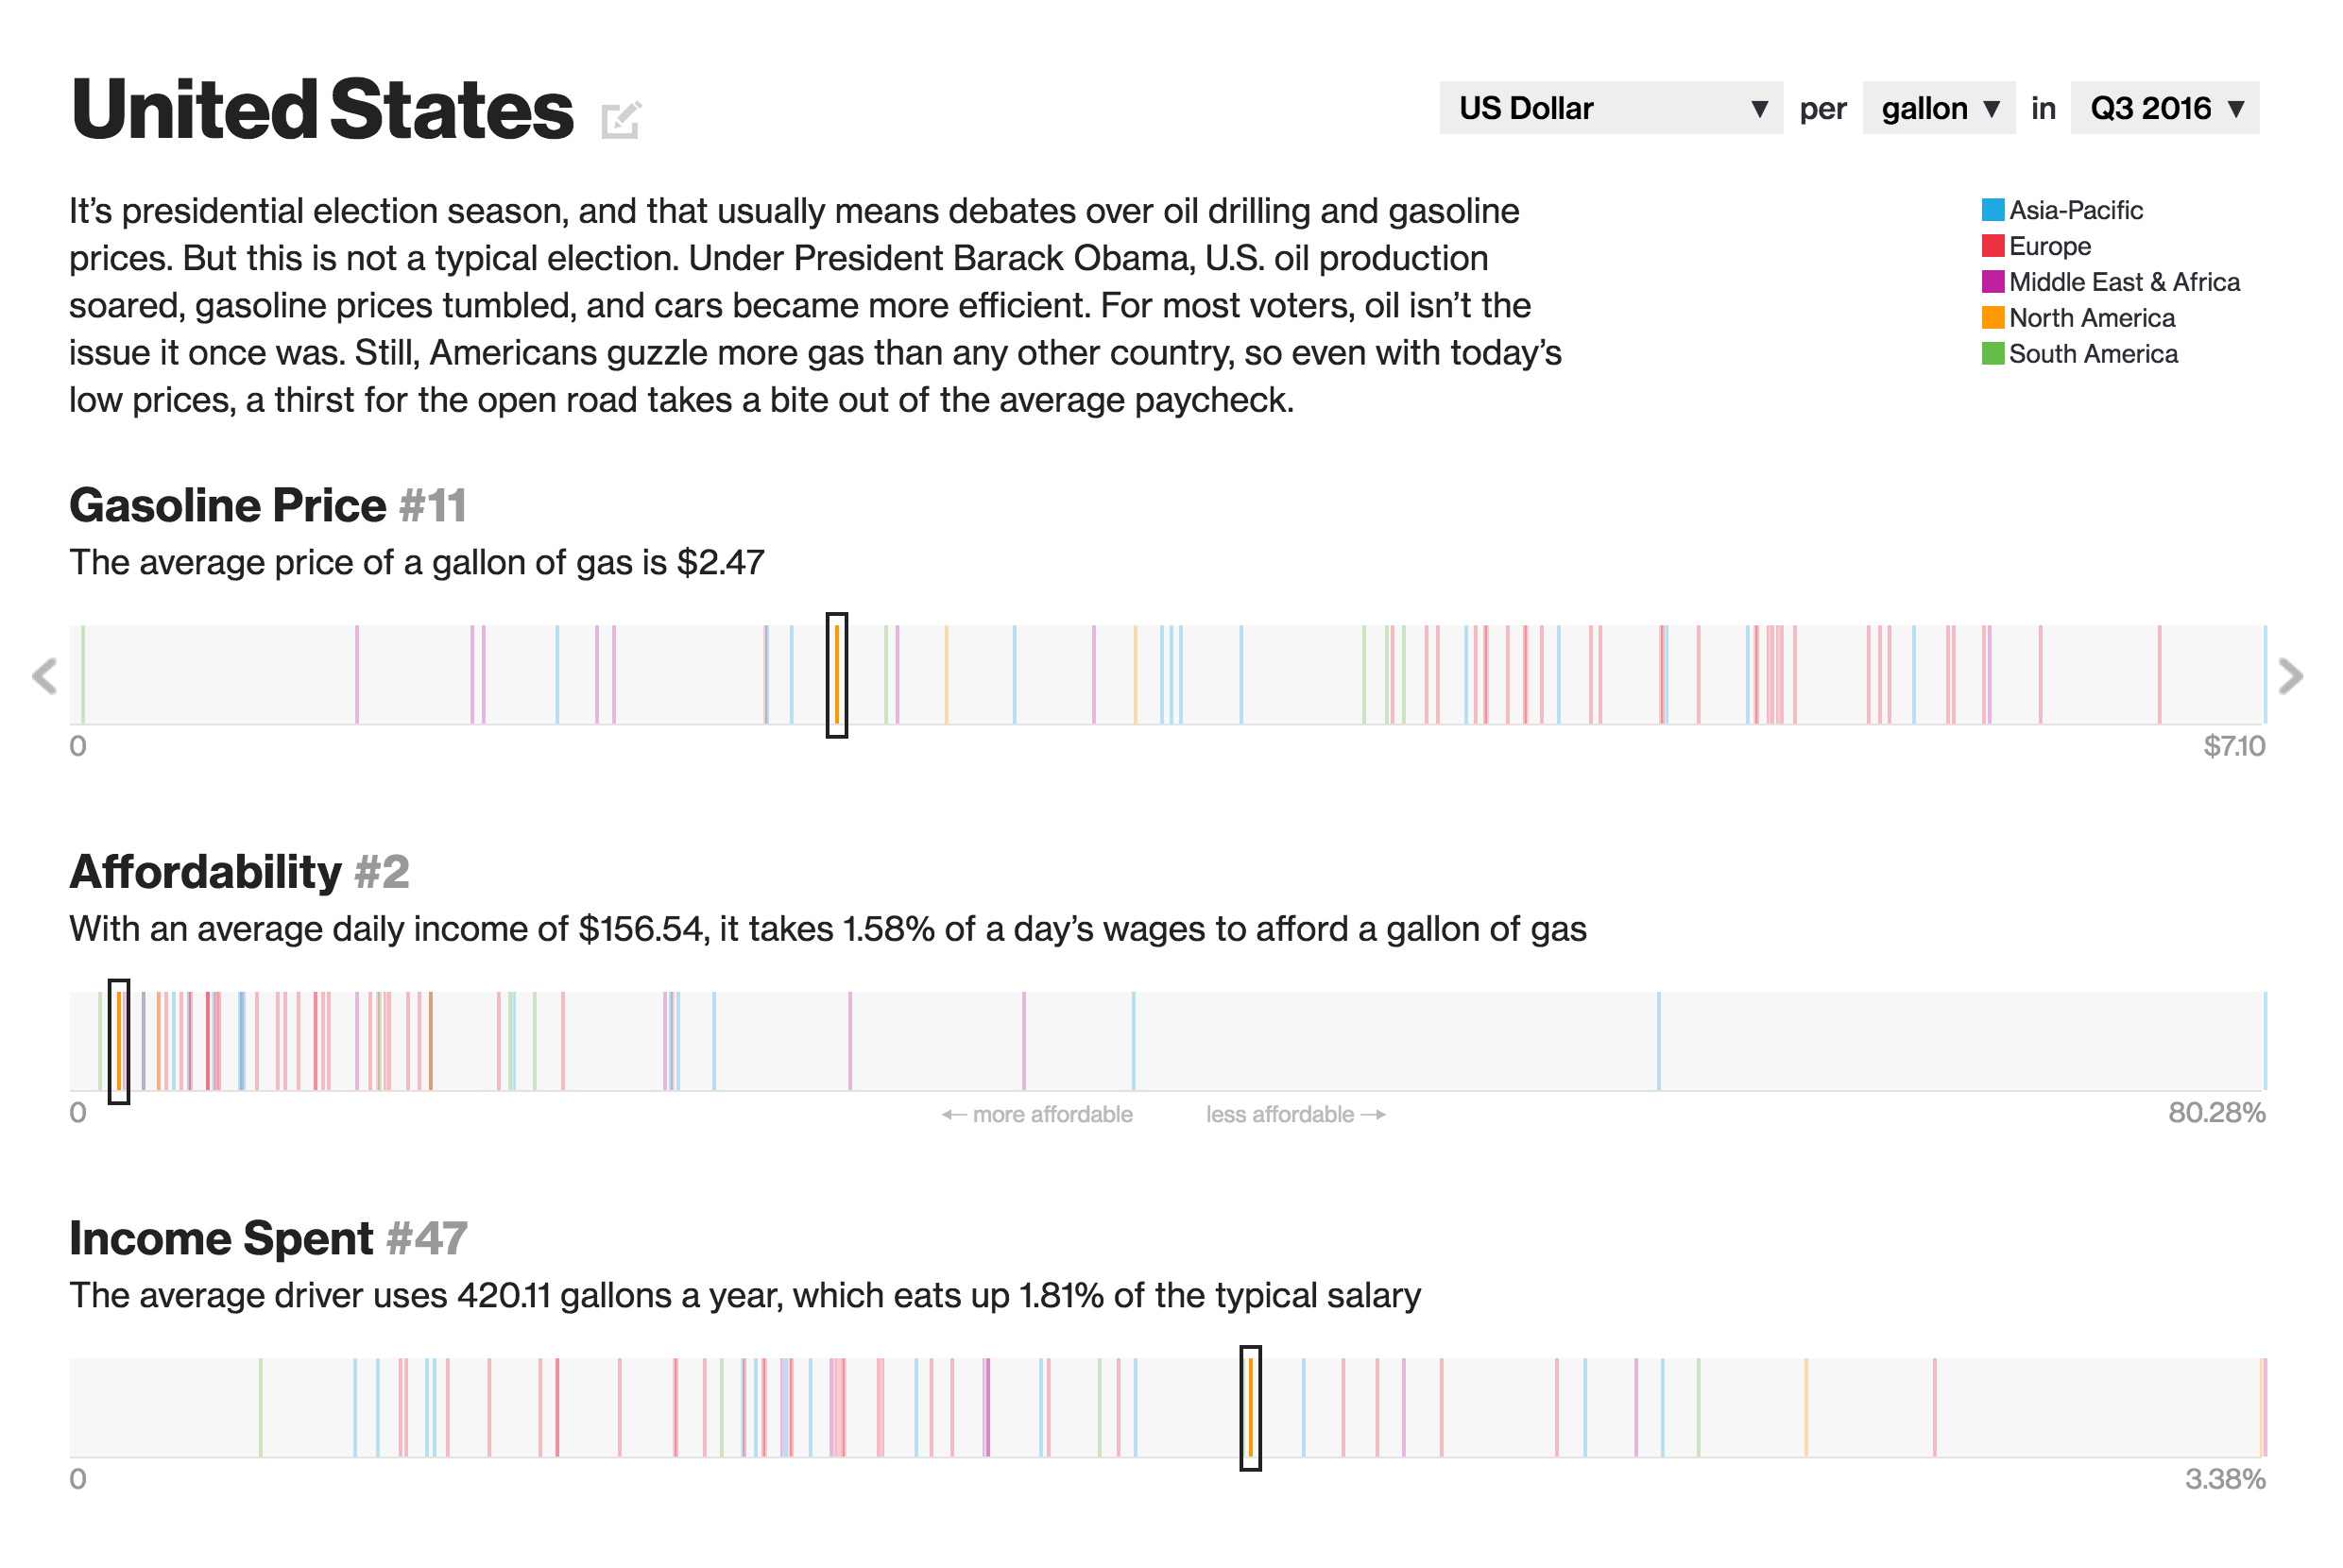
How much does a gallon of milk cost? That, of course, is one of the classic election questions asked of candidates to see how in touch they are with the common man. But the same can be understood by enquiring whether or not they know how much a gallon of petrol or gasoline costs. And Bloomberg asked that very same question of the United States relative to the rest of the world. And as it turns out, here in the States, fueling our automobiles is, broadly speaking, not as painful as it would be in other countries.
The piece includes the below dot plot, where different countries are plotted on the three different metrics and the dots are colour coded by the country’s geographic region. But as is usually the case with data on geographies, the question of geographic pattern arises. And so the same three metrics presented in the dot plot are also presented on a geographic map. Those three maps are toggled on/off by buttons above the map.

A really nice touch that makes the piece applicable to an audience broader than the United States is the three controls in the upper-right of the dot plot. They allow you to control the date, but more importantly the currency and the volume. For most of the world, petrol is priced in litres in local currencies. And the piece allows the user to switch between gallons and litres and from US dollars to the koruna of the Czech Republic.
Credit for the piece goes to Tom Randall, Alex McIntyre, and Jeremy Scott Diamond.


