The Covid Recession’s Continuing Impact on Youth

Earlier this week, some of the work work my team does was published. We produced a one-page summary of a far larger and more comprehensive (relative to the scope of the summary) survey of consumers during the Covid Recession. I will spare you the details of recreating existing templates from scratch and the design decisions that went into that bit—neither insignificant nor unsubstantial—and rather focus on the one graphic we designed.

The broad thrust of the summary is that while overall we are beginning to see some job recovery, that the recovery is uneven and that, in fact, those below the age of 36 are getting hit pretty hard (my words, not the authors). That while in some industries the young are recovering in good numbers, in other industries, industries with a larger share of the youth population, young people are still losing jobs. Then we broke those top line numbers out by industries in the below graphic captured by screenshot.
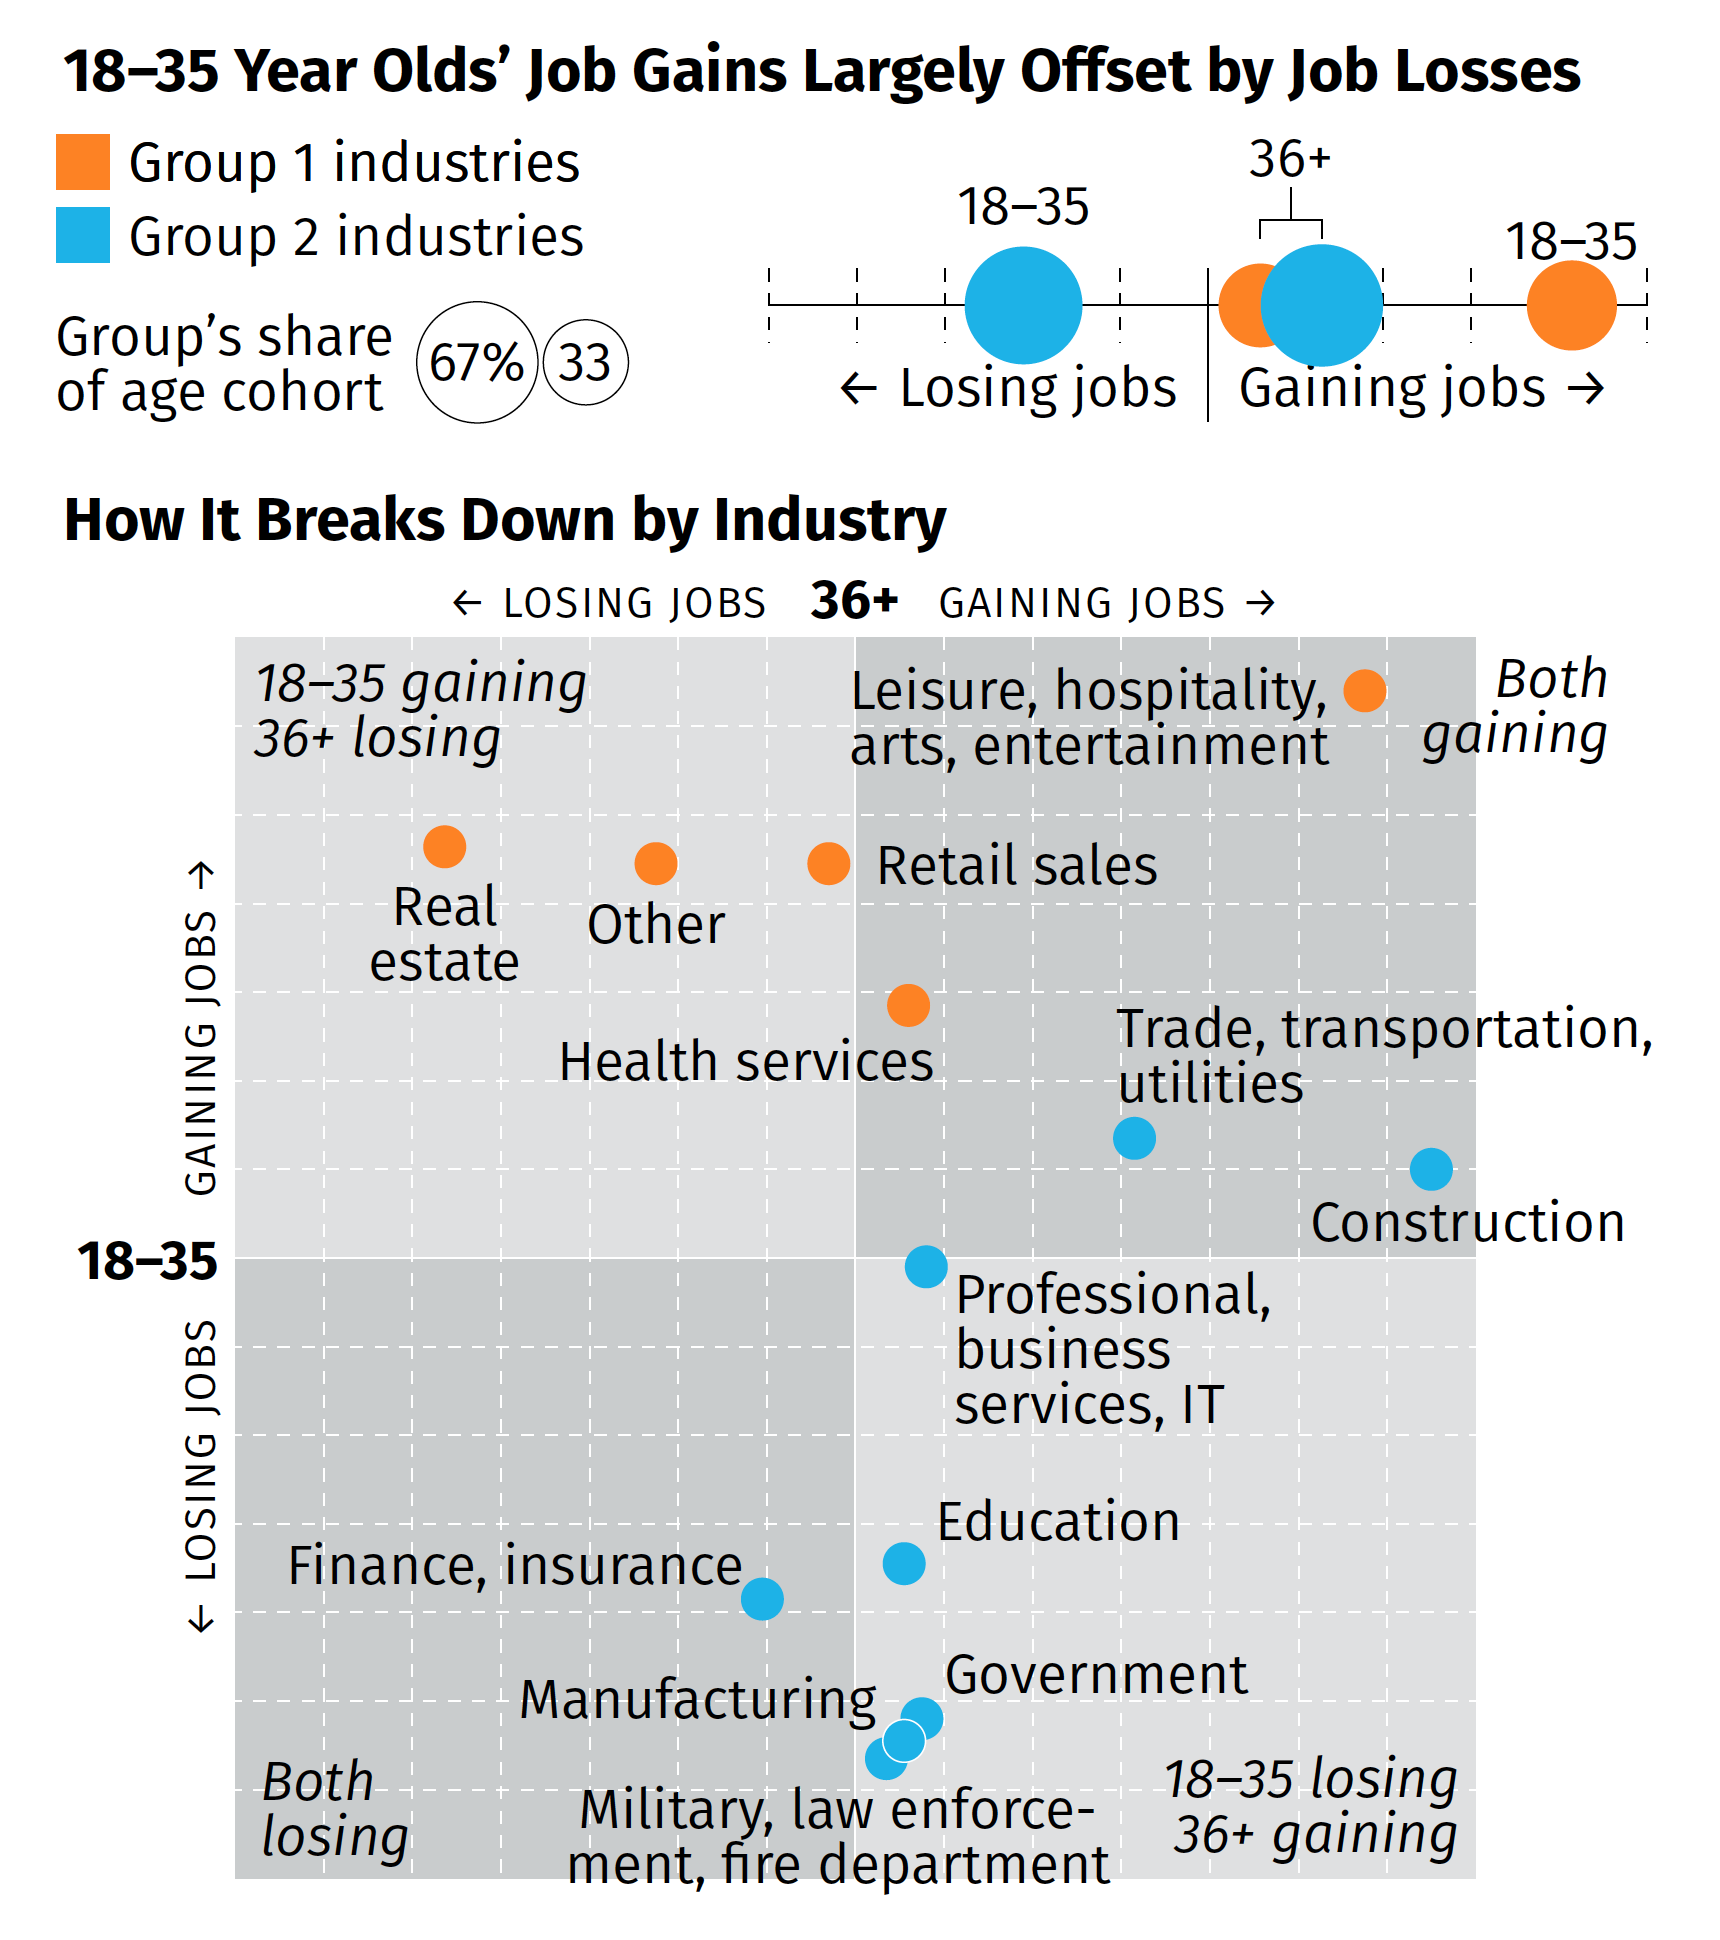
How different age groups in different industries are faring in the recession.

There are a couple of things from a design side to discuss. We had about two or three days from when we started the project to develop some ideas and then execute and produce the summary. And as I noted above, that also included quite a bit of time in emulating existing documents and building ourselves a new template should we need to do something similar in the future.

But for that graphic in particular, there’s one thing I wanted to highlight: the lack of values on the axis. The challenge here was that the data displayed is people not working. And when we compared this time period (Wave 3) to the earlier waves, we were looking for declines. And so if we going to say that 36+ are gaining construction jobs, that would be -2% value and the youth are about a -13% increase. If you are doing a bit of a double-take at a negative increase, so did the team. Ultimately, we used the data to generate the chart, but then opted for qualitative labelling on the axes. They simply point that in one direction, youth are either gaining or losing jobs, and the same for the 36+. To reinforce this idea, we also added some descriptors in the far corner of each quadrant that said whether the age groups were gaining or losing jobs.

Despite the unusual design decisions I took in the graphic, I’m really proud of this piece especially given its tight turnaround. It shows in almost real-time how fractured the recovery—is this a recovery?—is at this point.

Credit for the piece goes to the team on this, Tom Akana, Kate Gamble, Natalie Spingler, and myself.

What Will the Next Recovery Look Like?

Earlier this morning, the Bureau of Economic Analysis released its US 2nd quarter GDP figures and the news…isn’t great. On an annualised basis, we saw -32.9% growth. That’s pretty bad. Like Great Depression level bad. I’ve posted on the social media how bad this current recession is and how nobody in the workforce today worked or didn’t through the Great Depression to really relate to the numbers we are seeing.

But that’s all today. The sun will come out tomorrow. (And scorch the Earth as climate change renders certain parts of the globe uninhabitable to mankind. But we’ll get to those posts in later weeks.) And when it does come out, eventually, what will the recovery look like? I’ve seen a few mentions recently in the media of a V-shaped recovery. What is this mysterious V-shape?

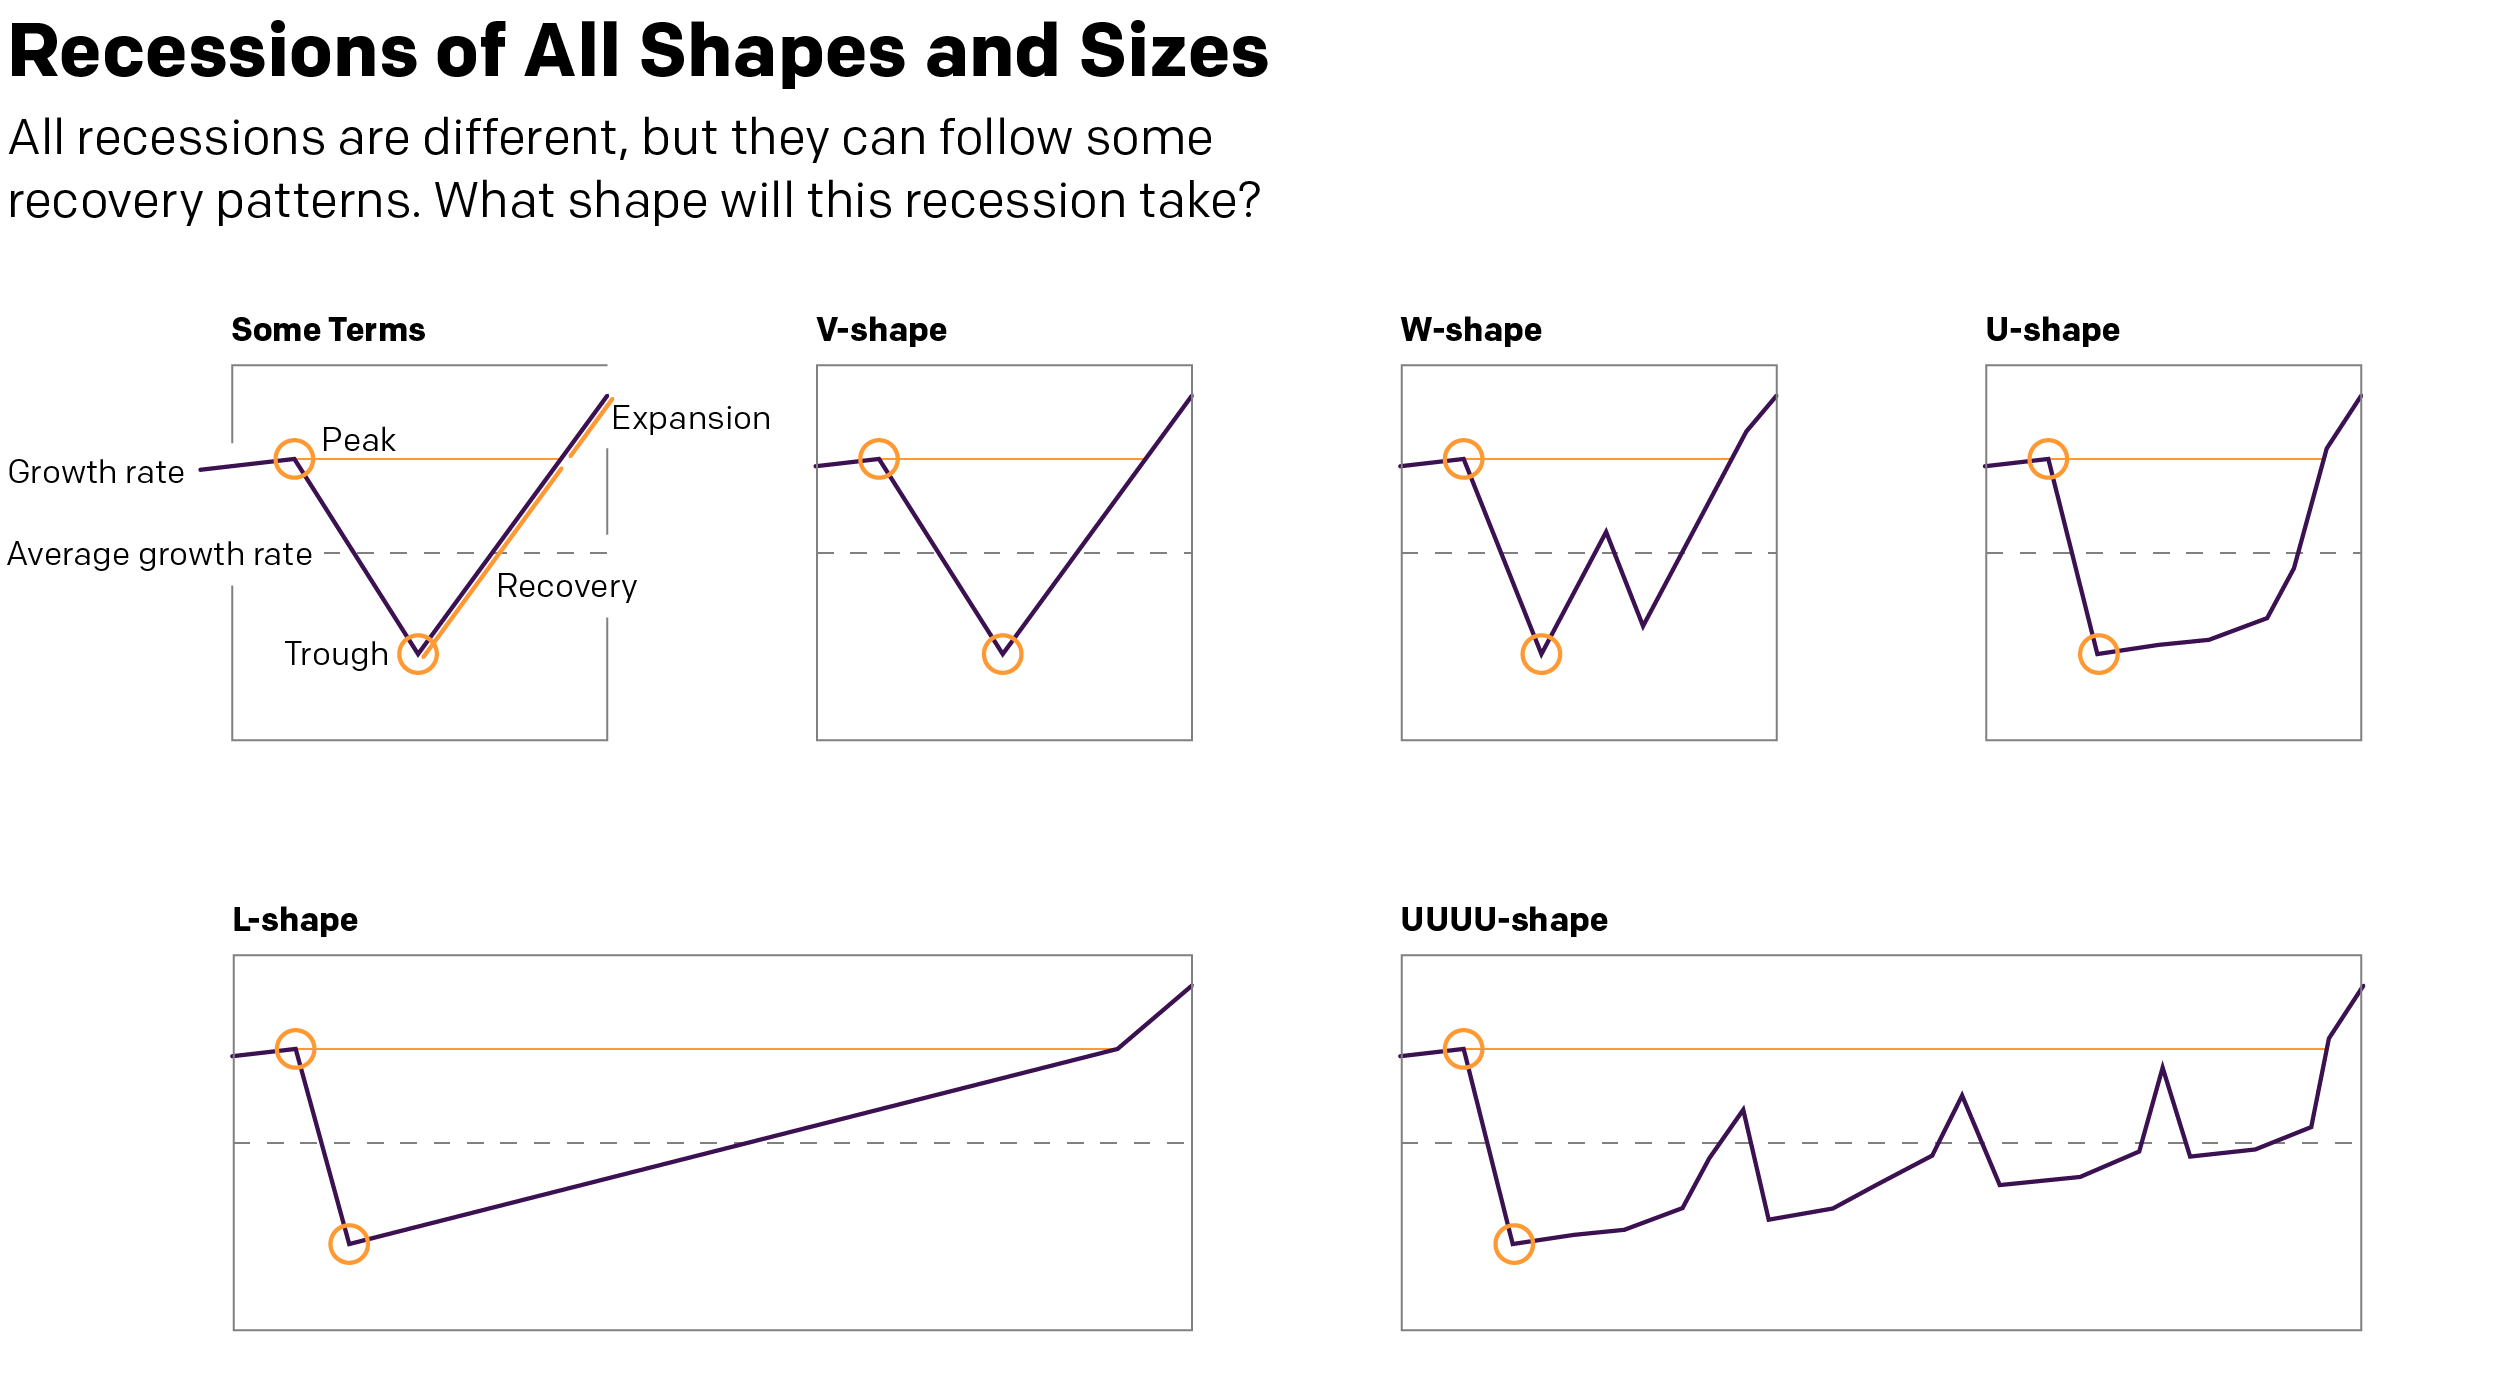
A long time ago, in a galaxy far away. Or during the last recession in Chicago, I worked with some really smart people in some of my professional projects and we covered the exact same question. There are a couple key “shapes” to an economic recovery. And when we say recovery, we mean just to return to pre-recession peak levels of growth. Anything above that is an expansion. That’s what we want to get back to.

What kind of shape will the recovery take?
Who knew typographers loved economics?

The V-shape we hear a lot about is a sharp recovery after the economy bottoms out (the trough). Broadly speaking, if a recession has to last two consecutive quarters (it doesn’t, but that’s a pretty common definition so let’s stick with it), then in a V-shape, we are talking about a recovery one or two quarters later.

Similar to the V is the W-shape, where things start to improve rapidly, but some kind of shock to the economic system and things go back negative once again before finally picking up quickly. It’s not hard to imagine something going horribly wrong with the Covid-19 pandemic to be just that external shock that could push the economy back down again.

Similar still is the U-shape. Here, after hitting rock bottom, growth isn’t quite as quick to pick up as we linger in the depths of the valley of recession. But after a bit of time, we again see a rapid recovery to pre-recession levels of growth.

These are all pretty short term recoveries, the W being a little bit longer because two sharp downturns. But they are nothing compared to what’s also possible.

First we have the L-shape. Here, after hitting bottom, things start to recover quickly. But that recovery is slow and takes a long time. Growth remains slower than average, creeping up to average, and then still takes its time to reach pre-recession levels. Is something like this possible? Well, if vaccines fail and if some countries still can’t get their act together (cough, US, cough), the willingness of consumers to go out, eat, drink, buy things, travel, and generally make merry could be suppressed for a long time. So it’s certainly not out of the question.

And then lastly we have the UUUU-shape. Though you could probably add or subtract a U or two. This features more drawn out stays at the bottom of the valley with quick and sharp upticks in growth. But those growths, never reaching pre-recession levels, also collapse quickly back into declines, though also never really reaching the same depths as earlier. Essentially, the recovery faces multiple setbacks knocking the economy back down as it sputters to life. As with the L-shape, it’s also not hard to imagine a world where a country hasn’t managed to contain its outbreak struggling to get back on its feet.

What do you think? Are we at rock bottom? Did I miss a recovery type?

Credit for the graphic is mine.