Trending Towards Gay Marriage

We are (still) waiting for a ruling on many things this week from the Supreme Court, including the rulings on DOMA and Prop 8. Today, we look at an interactive chart by the Wall Street Journal that plots different ballot measures, legislative actions, and court rulings regarding gay marriage. Lines of best fit provide a general trend line, and as the default view shows, the trend is clearly in favour of legalisation.
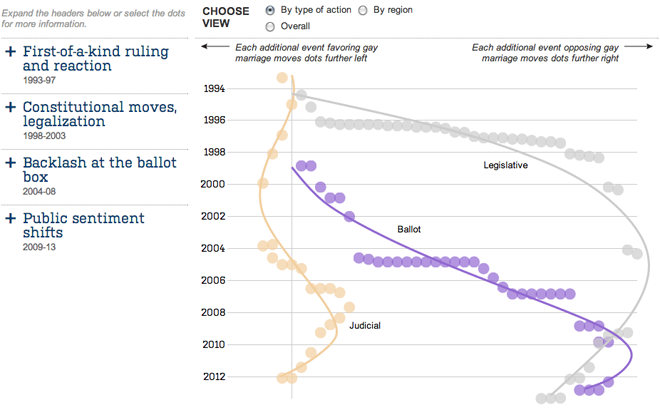
Trends for ballot measures, legislative actions, and court rulings for/against gay marriage

The piece is quite nice. After the default view, you can change the view to look at events not by type of action but by geographic region. This is one of those instances where the regional data provides an interesting look at the story. Additionally, the headlines on the left expand to provide not just context, but highlight the events plotted from that era.

Credit for the piece goes to Randy Yeip, Colleen McEnaney, and Chris Canipe.

Campaign Contributions

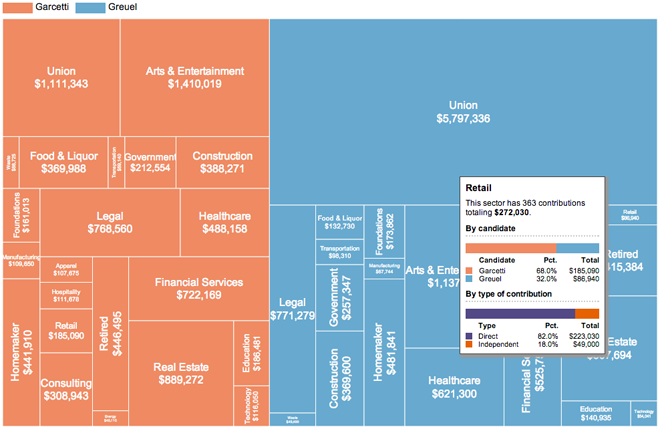
On 21 May, Angelenos went to the polls to elect the next mayor of Los Angeles. The contest followed an earlier vote that prompted the day’s run-off election. This graphic from the Los Angeles Times examined the contributions to the campaigns of the two finalists, Eric Garcetti and Wendy Greuel.

The overall piece features an interesting interactive component that allowed the user to switch from a scatter plot view to a stacked bar chart view and then filter those results based on whether they were direct or indirect contributions. Generally speaking, that element worked. However, I want to focus on the second big component: an interactive tree map.

Tree map with rollover

While not all tree maps have to be squarified, by converting datapoints to (roughly) similar shapes the user should have an easier time comparing the area of the objects. This tree map is not squarified and so the user must strain to convert all the different shapes into roughly equal shapes for a visual comparison. Nor is there an inherent ranking within the map—at least not that I can find. That would also help.

So while the tree map is not a success in and of itself, the rollover condition makes for a more interesting overview of the different sectors of contributions. But despite this added value in the rollover,  the data powering the tree map would still be better presented in a different format.

Credit for the piece goes to Maloy Moore and Anthony Pesce.

Changes in Global Life Expectancy

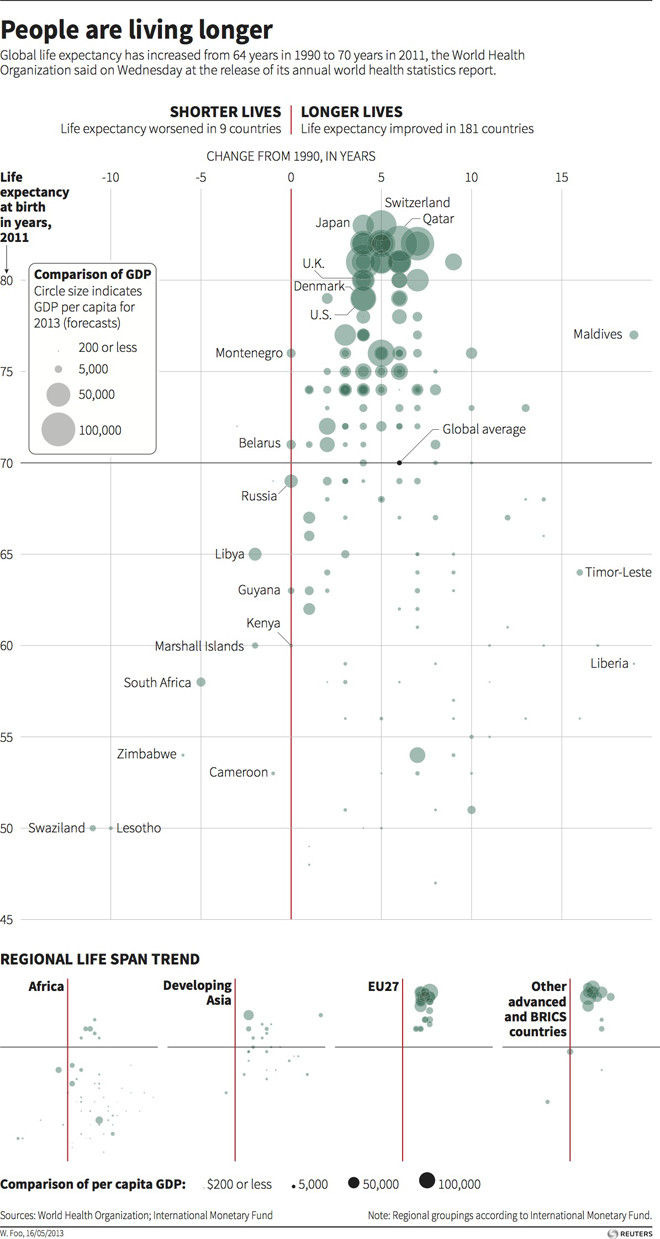
Today’s post is a scatter plot from Thomson Reuters looking at changes in global life expectancy since 1990. What is really nice about this piece is the main space for the data visualisation presents all of the data for all of the available countries. Beneath the main visualisation, the designer chose to use small multiples of the same chart to highlight broader regional trends.

Change in global life expectancy

Credit for the piece goes to, I think, Hwei Wen Foo. (Credit on the graphic is W. Foo.)

Scatter Plots in Time (and Space?)

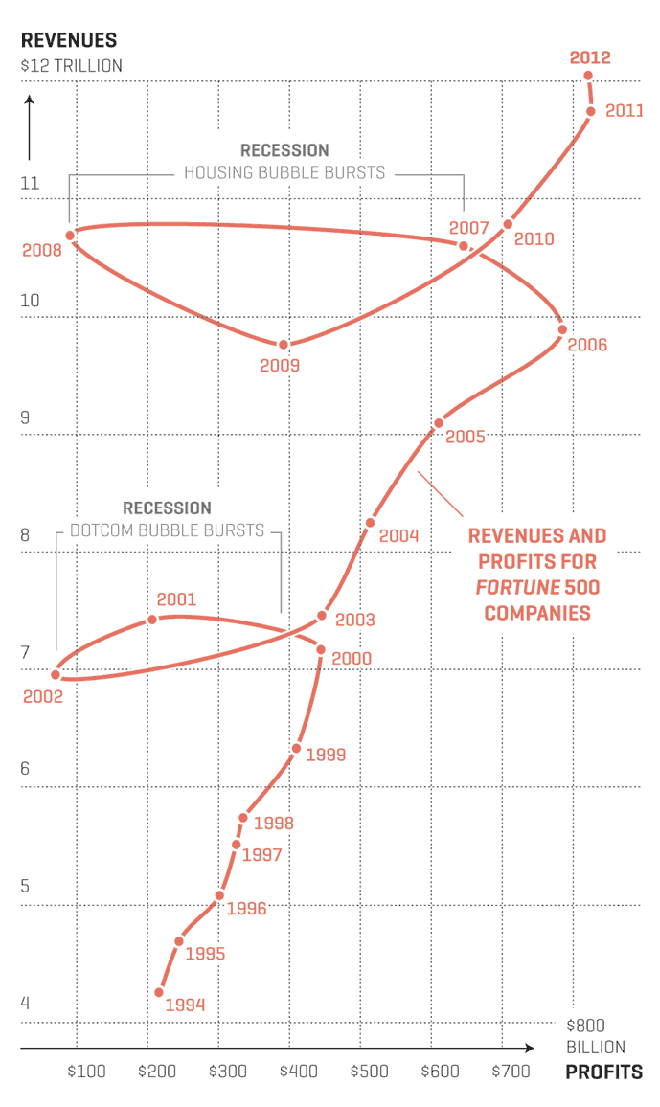
Well maybe not so much the space. Anyway, Nicolas Rapp, who does a lot of work for Fortune Magazine and previously the AP, created his first connected scatter plot. I have been a fan of them for quite some time and have been able to use them from time to time. Rapp’s scatter plot looks at the profits and revenues of the Fortune 500 in the last 20 years. But what I think makes his piece particularly strong are the two annotations he provides to explain the “loops” in the data: the two big recessions.

Profits and revenues for the Fortune 500

Credit for the piece goes to Nicolas Rapp.

The Gap in University Admissions

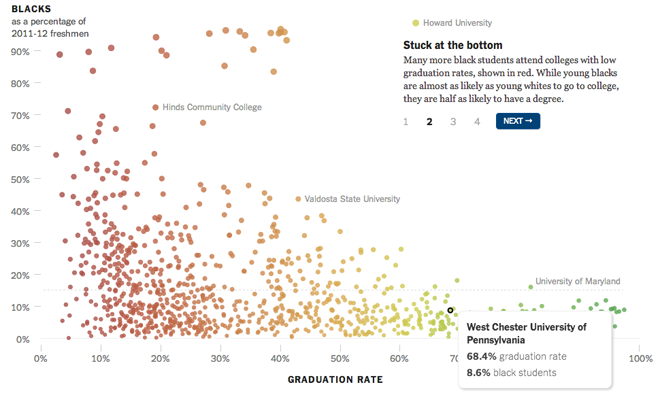
The New York Times has recently done good work with interactive infographics that weave a narrative through their chosen form of data visualisation. I covered one such work back in February that looked at girls in science. Today, a similarly structured piece looks at university admissions and graduation rates for ethnic minorities.

Admissions Gap at Universities

Navigation in the top-right guides the user through the story with key schools highlighted. Of course at any time the user can dive into the data and find specific schools that interest them. Overall the piece is less about data exploration, however, and instead merely uses the wealth of data to paint a context for the broader narrative.

Credit for the piece goes to Josh Keller.

Catholics and Cardinals

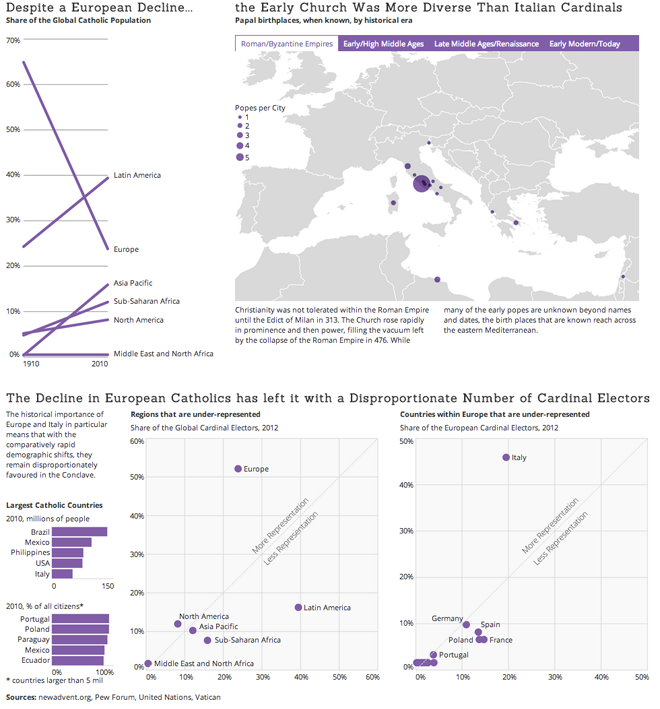
As the conclave in Rome is almost ready to begin, likely sometime next week, cardinals are gathering in Rome to discuss the affairs of the Catholic Church and then elect a new pope from within their ranks. Many outsiders talk about the time for a pope from outside of Europe, that the papacy has been an office for Europeans—namely Italians—for too long.

However, the preponderance of Catholics outside of Europe is, in the 2000-year history of the Church, a relatively recent phenomenon. Explosive growth in Latin America, Africa, and Asia combined with a decline in European Catholics means that it is only in the last few decades that Europeans have fallen from being nearly 2/3 of the global Catholic Church.

As my infographic attempts to explain, despite this demographic shift, the early Catholic Church chose popes from the distant corners of its territory before it contracted. That historical consolidation in Europe—Italy in particular—has led, however, to a disproportionate weight of cardinal electors, i.e. the cardinals who elect the pope, in favour of Italy and Europe. And as the cardinals typically choose from among their own, it is far more likely that the next pope will come from Europe if not Italy.

Click the image to see the full-sized graphic.

Catholic demographics and share of the cardinals

Girls in Science…Just Not in the United States

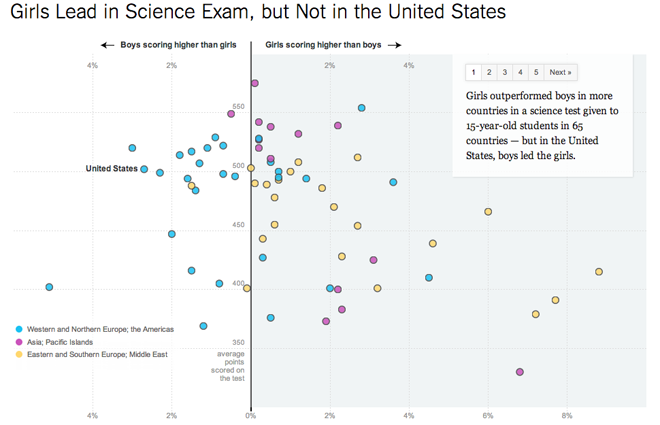
This piece from the New York Times is really well done. With simple colours to differentiate three groups, values are charted on a scatter plot to show the distribution of results for an OECD science test in 65 countries. The results clearly show regional differences in the performance of girls in the sciences depending upon the region.

The overall picture
The overall picture

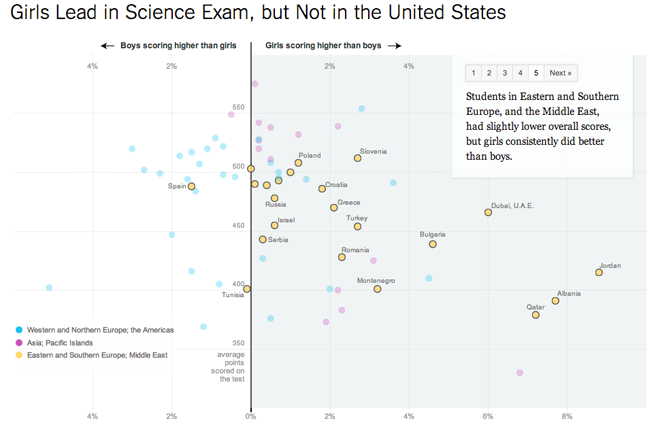
But to make the story clearer for those who may not take the time to really delve into the data, five simple buttons on the upper right take the user through the story by annotating the different highlighted views shown in each step.

Southern and Eastern Europe and the Middle East are Highlighted

Credit for the piece goes to Hannah Fairfield and Alan McLean.

Healthy Living

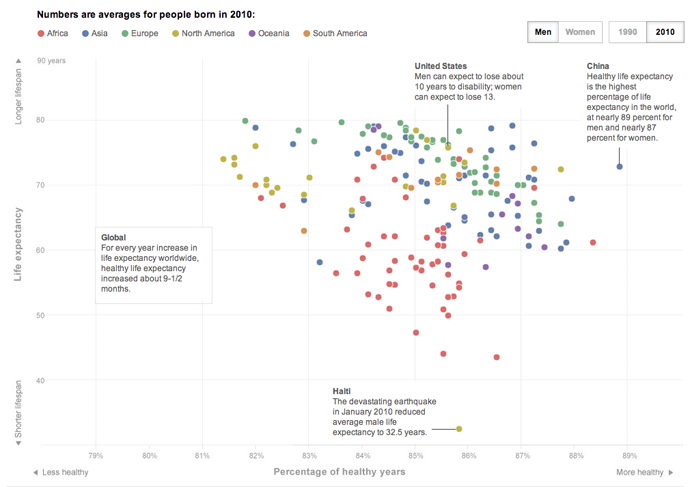
Yesterday the Washington Post published an article and an accompanying interactive infographic on life expectancy. But not just how long one can expect to live, but also how long one can expect to live in good health. What makes the piece particularly nice and effective are the annotations that explain some of the data points, in particular the outlier of Haitian males.

Life expectancies
Life expectancies

Credit for the piece goes to Bonnie Berkowitz, Emily Chow, and Todd Lindeman.

2012 Olympics: What Makes a Winner (and Will the UK Be One)?

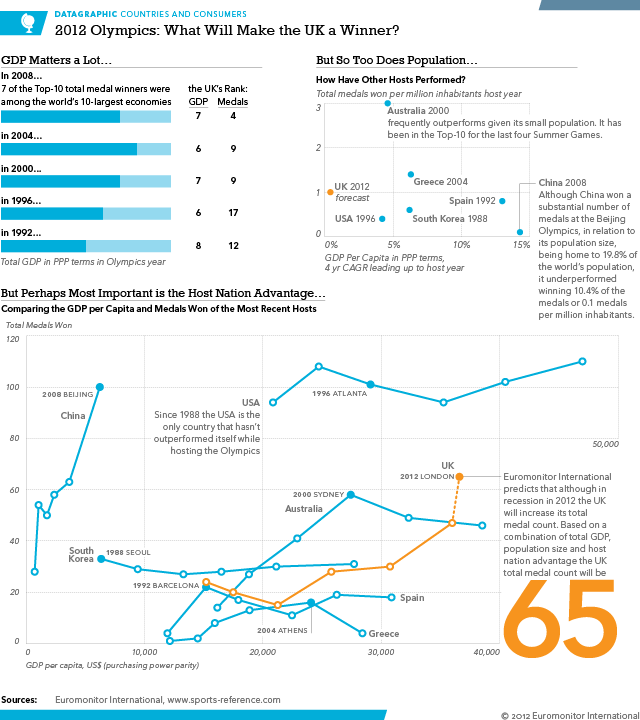
The Olympics are coming, the Olympics are coming. (As if you didn’t know.) In a rare moment of seeing my work outside of my company’s paywall, I can post a few infographics I have created for the 2012 Summer Games in London. The series looks at a few different non-Olympic variables like GDP per capita and mean BMI and sees whether they impact total medal counts in the Olympics.

This first datagraphic (to use my company’s internal language) looks at what makes a winner and will the UK be one this summer. The main chart in the piece compares GDP per capita performance to total medal count in each Olympic year from 1988 to 2008. And yes, we are predicting the UK to win a total of 65 medals this summer.

What Makes an Olympics Winner

In the interest of full disclosure, I work as the senior graphic designer for Euromonitor International. This series was not intended to be used as part of marketing/promotional piece (I probably need to include the link to download that document here), but instead I designed them all as client-only content. But since others decided to use my work as marketing material, I am fortunately allowed to share it with all of you via my blog. So yeah, that’s pretty cool. Enjoy.