Tag: tariffs
-
A Little Judgmental
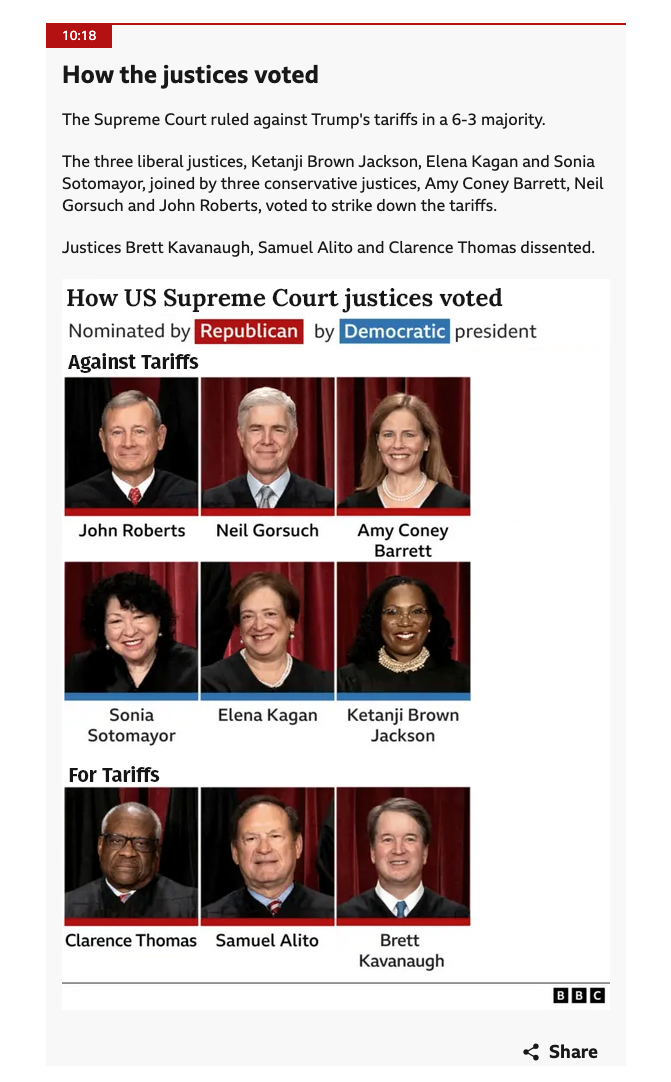
Editor’s note: I wrote this Friday afternoon, and then on Saturday afternoon a new BBC article included a graphic similar to my design. I address later on in this post. (I am also my own editor.) Friday’s US Supreme Court ruling struck down President Trump’s tariffs—mostly, not all—as unconstitutional. I had a browser tab up…
-
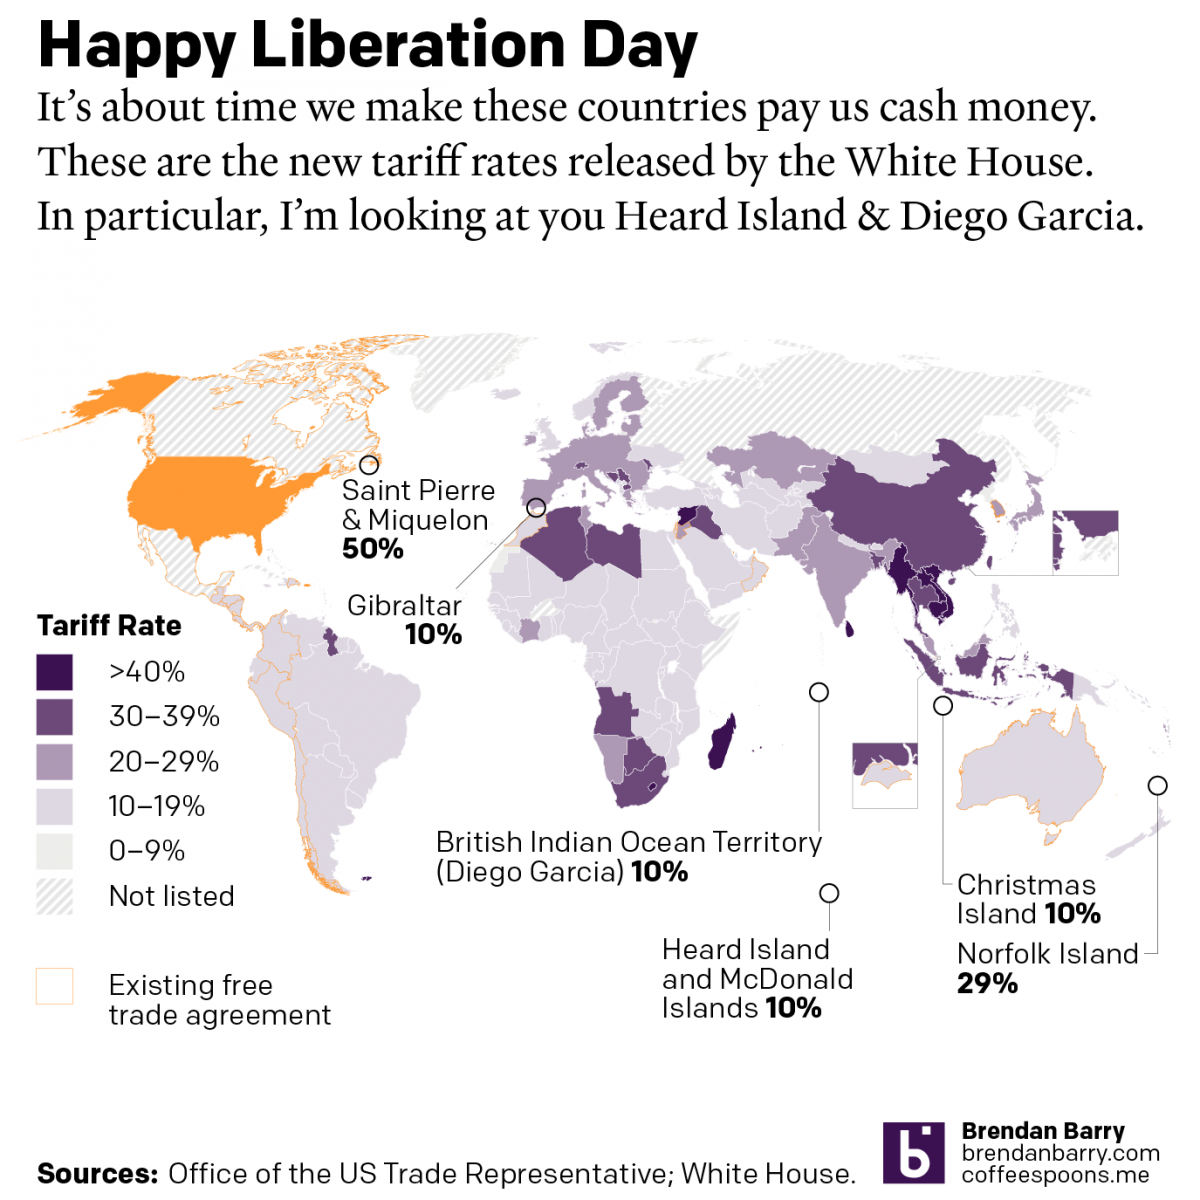
Happy Liberation Day
Yesterday I created a map detailing the new tariff rates released by President Trump on Wednesday. I was inspired by the curious inclusion of several small territories with almost no trade with the United States, and a few of whom are uninhabited. What follows is the graphic and the accompanying text I wrote as I…
-
Tariffs Are a Tax
This piece from the New York Times isn’t really even a graphic. It’s a factette, or small fact. The article is about how tariffs are raising the price of certain goods, in this case a bicycle. Tariffs do not add money to the US Treasury, they are instead an additional price paid by US consumers…
-
Trade War Retaliation
About a week and a half ago the Economist published an article about the retaliatory actions of the European Union and China against the tariffs imposed by the Trump administration. Of course last week we had a theme of sorts with lineages and ancestry. So this week, back to the fun stuff. What makes today’s…