Happy Friday, everybody. We made it to the end of the week. And so now we have xkcd going all back to school and teaching us all simple statistics.
And if they ask for the mode, you serve the chart with ice cream.
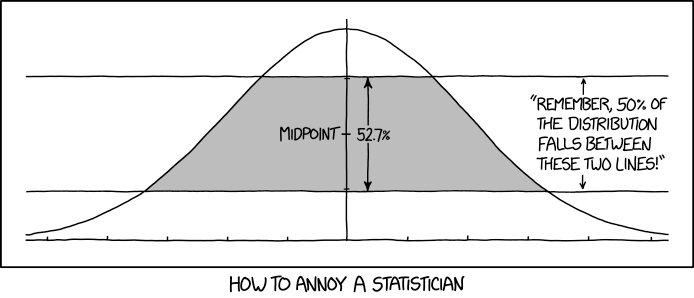
For those unfamiliar with statistics, that’s not at all how it works.
Credit for the piece goes to Randall Munroe.
Author: Brendan Barry
I am a graphic designer who focuses on information design. Most recently I worked for the Economic Research Department of the Federal Reserve Bank of Philadelphia and prior to that I was Head of Design at Euromonitor International with my design team split between Chicago and London.
View all posts by Brendan Barry