South Sudan

For those who may not be aware, part of Africa’s largest country is holding a referendum on whether it should remain a part of Sudan or secede and become an independent state, Southern Sudan—though one wonders if they would not come up with a different name. About 2005 a peace agreement all-but-ended a decades-long civil war in Sudan and as that violence subsided the attention in Sudan shifted to Darfur. The terms for the peace deal included a referendum on independence for Southern Sudan, long since joined with the northern half of Sudan as part of a British colony in Africa to control the Nile River.
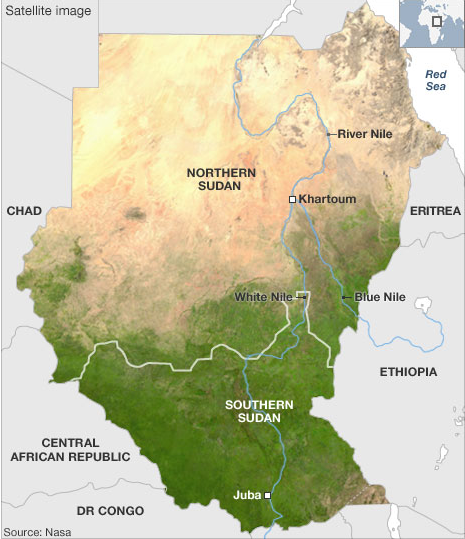
Map of Southern Sudan

The two halves of the country were and are very much different and the BBC has used maps to highlight these differences. The problem is that there are oil fields along the proposed border and a disputed region, called Abeyi, has significant deposits of its own. And so the question of who controls the oil and thus the money and the power remains. That, however, is a story for another post. This is just to highlight the maps.

Overall, not bad. I find using the different hues for the different subject matters a smart idea. The shift forces the audience to focus on the change in meaning, which is very important if the shape of the coloured area is not otherwise changing. That said, the infant mortality choropleth uses too great a shift in hues between data bins when compared to the water, education, and food security maps. The oil field map, while not necessarily a data-heavy map in the same way as the choropleths, is a nice bookend to what started the series, i.e. the satellite view. These highlight the sheer environmental and, in a fashion, economic differences between the two regions of Sudan.

I find the ethnic groups map, however, the most difficult to fit into the series. Certainly from a subject matter it is the most important. However, the colours chosen to represent the various ethnic groups seem disparate. The southern Dinka, for example, are represented as an olive-green whereas the northern Beja are more of a bluish-green. I think a better solution would have been to keep the three main groups, i.e. the Arabs, Northern Sudan, and Southern Sudan, and then assign each a different hue, for the sake of an example say the three primary colours. Then within those groups, different tints for the various but related ethnic groups. This would highlight the various ethnic groups existing across Sudan, but show the geographic split between the two groups.

Overall, a good effort from the BBC to highlight the stark differences between Northern and Southern Sudan.

May I Have Pepperoni on That Pie (Chart)?

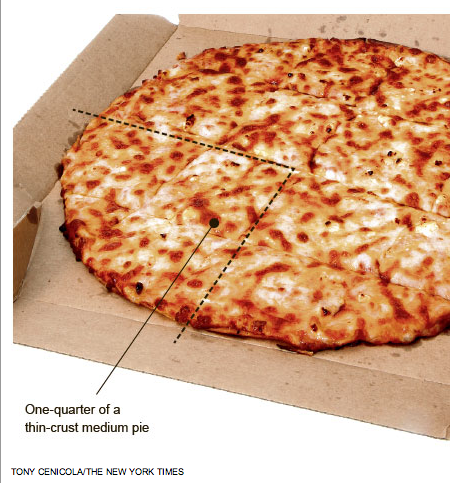
I love pizza. I think most people do too, though, we can all disagree on whether thin crust or thick crust is better. Yet as someone who has now eaten both…well…I shall not wade into the matter. But, I will toss up this piece from the New York Times.

a Pizza Pie Chart
a Pizza Pie Chart

The paper has an article about Domino’s adding more cheese to their pizza to increase sales as part of a plan from a US government-supported agency. At the same time, the US government is also trying to reduce the amount of saturated fats consumed to reduce obesity. And of course cheese contains saturated fat.

Naturally, the supporting graphic should make use of pizza. And in what better form than as a pie chart.

Though having now been looking at this for quite some time, I am in the mood for pizza. Though I could do without the saturated fat…

The Candidate Says Tweet Tweet

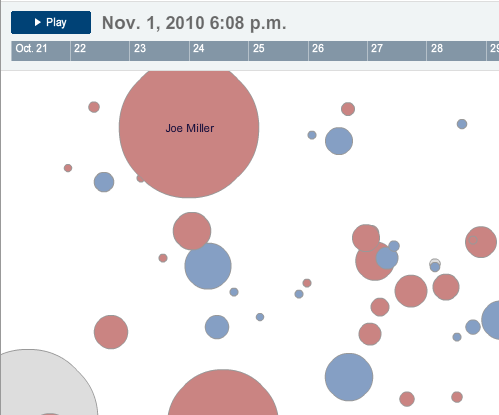
Yesterday, the New York Times released this interactive piece to look at the popularity of particular candidates in that seemingly ubiquitous world of Twitter. Perhaps it was inevitable that the Times or somebody else would create something like this. Regardless, it is out there and I have to say, I am left confused.

A cropping of the interactive piece.

No, not by the how it works. I understand that more activity makes for larger bubbles. (Although at this point I shall refrain from my usual diatribe on bubbles.) And if you click on a particular bubble/candidate, the vector and colour of the little bubbles describes the type of activity. Understand? Check.

But why are the bubbles placed where they are on the screen?

Perhaps the rationale is explained somewhere…but I have yet to find it. And after sitting down with a colleague yesterday, the two of us could not quite figure it out. Vaguely one gets the impression of representing actual geography—except for things like Delaware being in the bottom corner. Perhaps the bubbles’ centre points are randomly generated? They do not appear to be on separate loads of the Flash piece.

And so I am left with the thought that the bubbles are a needless distraction and, in fact, lead to greater confusion. What if, for example, the candidates were not bubbles but bars? The bars would create a visual rhythm as they grow and shrink and each could be clickable. One could sort the bars by some sort of a hierarchy: alphabetic, geographic, political, &c. You could even still click on a bar for more detailed views and perhaps do some other neat things.

I am just left scratching my head on this one.

Fast and Shiny Trains

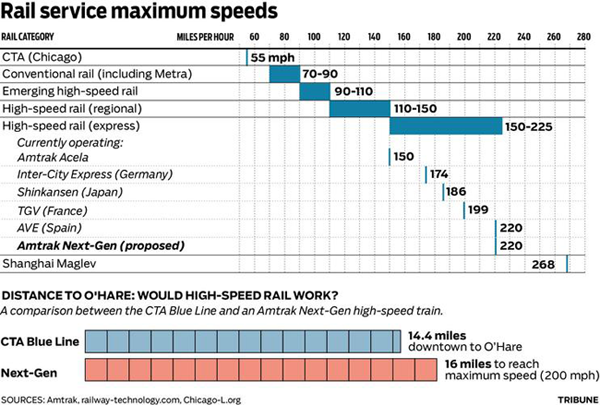
This is another comparison of high-speed lines and how woefully inadequate American infrastructure is in this particular department. The graphic comes via the Chicago Tribune in support of this article, wherein the outgoing mayor states the need for a high-speed line to link downtown Chicago to O’Hare International Airport. Apparently his desire for such speedy transit was inspired by his trip to Shanghai, where the Chinese have had a magnetically-levitated (maglev) train connecting the airport to the city for a few years. It’s fast. (Though as the article makes a point to call out, the Shanghai train does not stop in downtown Shanghai, but rather the city’s edges where travelers then link up with a more conventional train to reach downtown.)

Chart Comparing Rail Maximum Speeds

The chart is nice because it breaks down the types of trains into categories based upon speed, and in the area of interest, namely high-speed, the express section is broken out in detail with the several main types of high-speed trains described. Of course these are all maximum speeds and I would be curious to see a comparison of average operating speeds. For example, while Acela is billed as fast, it frequently operates well below maximum speeds because of its route—the Northeast Corridor was not designed for trains running at such high speeds all those years ago.

At the bottom is a comparison of the overall length of the Blue Line, the Chicago route that connects the Loop (downtown) to O’Hare, to the distance needed to accelerate and decelerate a high-speed train to its maximum speed. Overall, I think the plan sounds like a glossing over of other deficiencies in the Chicago mass transit network for the sake of shiny new toys for (outgoing) mayoral boys.

Midwestern Shrinkage

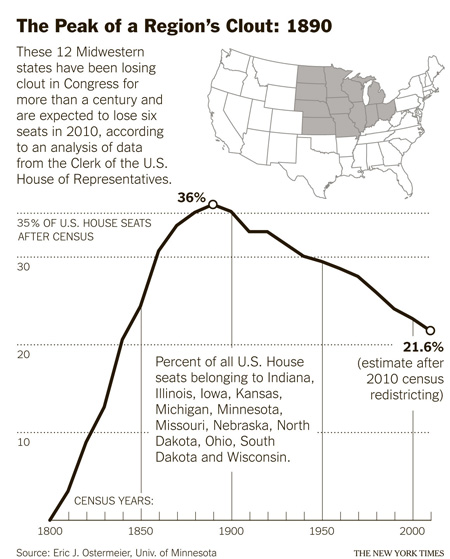
Charting the Rise and Fall of the Midwestern Congressional Delegation

The United States was founded on the East Coast as English (and the odd Scottish) colonies with the old cities of Philadelphia, Boston, and New York. These first colonies became the original 13 states. Ever since the 18th century, we have expanded westward into the Ohio Territory, the Northwest Territory, French colonies, Spanish colonies turned Mexico, and then again the British in the Pacific Northwest. (Overly simplified history of the United States’ growth, but it shall do.)

Every ten years, the United States is constitutionally obligated to hold a census. You cannot elect representatives to make political decisions for you if you do not know how many of you there are and where you live. But what these decennial censuses show are how the demographics of the United States have changed, with the population shifting from the East Coast, once almost 100% of the population, to the lands south and west. It’s only natural when you consider how unpopulated that part of the continent is.

But, because we rely on these censuses to redraw political districts and boundaries, every ten years politicians make much ado about…well, something. This article by the New York Times looks at how these changes are set to affect the Midwest in particular and this graphic, while simple, charts the congressional power of the Midwest through the total number of seats held in Congress over the years.

Growing Pains

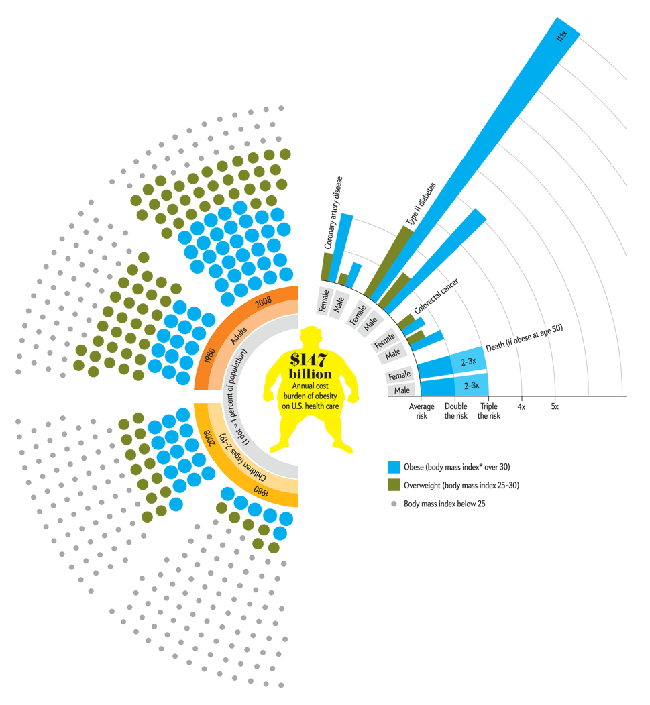
An information graphic looking at obesity in the United States

This piece comes from my coworker, Ben, who found the graphic in Scientific American. Broadly speaking the piece is looking at the obese and the overweight in the United States, comparing the numbers of both children and adults in 1980 to 2008. These numbers are supplemented by the risk of death posed to both men and women from a few different causes. (I know at least diabetes is linked to weight, but as to whether the others are linked I am unaware.)

I have a few quibbles with the piece; for in general I think educating the public about the health risks of obesity a worthy endeavour. From a more scientific-ish point of view, as I recall, BMI (body mass index) is not a particularly useful tool in determining obesity because it fails to differentiate people who are heavy with fat from those who are heavy with muscles. A strong and regular weight-lifter is not necessarily overweight, but simply has a lot of muscles. Does that make the weight-lifter less healthy than those with lots of body fat? Methinks not.

From the data side, I am curious to know why only the two years? It may very well be that they are the only two years for which relevant data exists. But I doubt that. 1980 compared to 2008 is interesting, but perhaps already well-known. What would perhaps be more interesting is whether over the past few years, the increasing attention paid to weight and other health issues has begun to affect the growth of the obesity problem—poor pun very much intended.

The accompanying text makes a point about the number of adult Americans being obese. Certainly the dots as a percentage of the population achieve that goal of showing percents—though I hasten to add that their arrangement around the body in the centre does very little to aid in comparing the adults of 1980 to 2000 let alone the children. And as to the children, the article points out that they are growing fastest. At this, however, I can only take the authors at their word for the graphic does nothing to visualise this statement. Perhaps they outgrew the adults—but then the adults were themselves at one point children, but that is another matter—but their growth could now be slowing as a recent turn of events. But since we only have two years, we cannot know for certain.

The risk of death by [type of death] is interesting. But running bar charts as more of a radial chart could become a bit confusing. Is there any reason the bars grow in width as they extend further out? Or was that part of an all-too-obvious play on the problem. After all, the growth in area could be significant; a simple line of constant stroke to a point along the radial distance markers would have sufficed. And then I would be particularly curious to know whether any of these types of death are related to obesity. Neither the article nor the graphic provide any clues besides whatever knowledge the viewer brings to the table. (Okay, I think I am done with the puns.) And if one happens across the article with almost no knowledge of what diseases or medical conditions are caused by obesity, how does the graphic tie into the cost of healthcare costs brought upon the country by obesity.

Overall, I think the graphic is well-intentioned. The public is becoming more accustomed to seeing data visualised. However, we need to make certain that we are communicating clearly by making datapoints easier to compare. (Looking at things across half of a circle is a bit tricky.) And then we need to make certain that the data we are visualising supports our statements. (Are children really the fastest growing? Over what span of time?) And then take the time to explain to the audience those things that may not be common knowledge. Does that mean dumb a piece down to the lowest common denominator of someone who has absolutely no knowledge? No. Design needs to elevate and educate its audience. Perhaps some of the finer details remain unexplained because of sheer complexity, but when amidst a host of details well-understood, that confounding bit may push an unsure viewer to do some additional research and educate him- or herself about the subject matter. And that, surely, is not a bad thing.