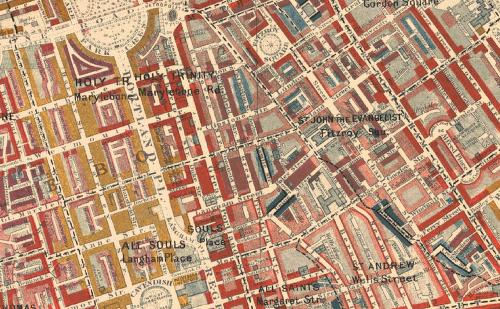
Charles Booth was a 19th century social scientist living in Britain. He famously investigated poverty and mapped out which parts of London were teeming with vicious, lower-class criminals or well-to-do upper class folks. Today, one might use a simple choropleth style to paint whole swathes of London by postal districts or constituencies or some such. But, Booth went street-by-street and house-by-house colouring blocks of London’s residential areas until he arrived at a map far more complex—and thus ultimately more telling—of the intricacies of London’s social structure.

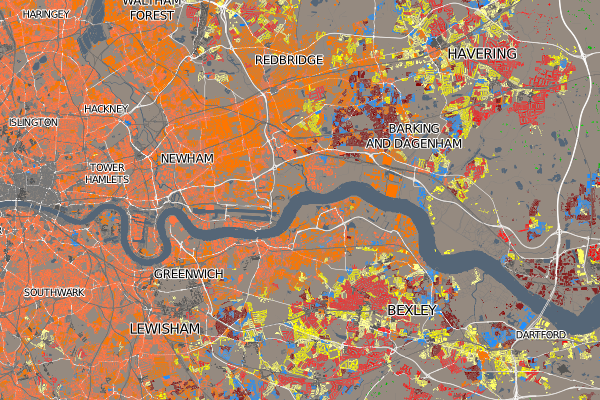
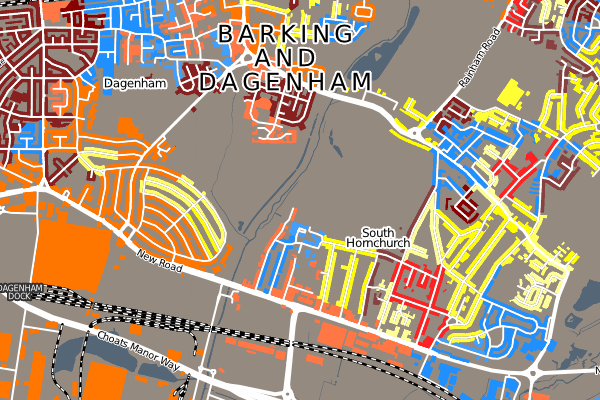
Oliver O’Brien has created a modern take on Booth’s approach to investigate the housing demographics of the UK, which ignores the large areas of the British countryside that are devoid of homes and thus focuses on the denser residential areas of the UK’s major cities.


Censuses seem to be a natural dataset for such work, but I wonder if in the future we will be able to apply such data visualisations to other geographically-tied data.
