How Far You Won’t Go

Housekeeping first, as you may have noticed, I haven’t been publishing as much lately. That’s because I’ve been on holiday. After a tremendously busy year, I need to use up all the time I didn’t spend on holiday. Consequently, I’m only going to be posting a handful or so more times before the end of the year. The plan is to return in early January to my regular posting schedule. For this week that means the next few days before I’m off for American Thanksgiving.

But on with the show.

One of the things I haven’t been doing too much of is travelling. There are many reasons for this, but one is that air travel in the United States has, of late, been, shall we say unreliable. Hundreds if not thousands of flight cancellations, sometimes with no obvious cause. And in one notorious case, Southwest claimed inclement weather cancelled flights in Florida, but it was the only airline to cancel significant numbers of flights. In other words, it wasn’t the weather.

The Wall Street Journal recently posted an article that explored the issue, doing so via a great example. It followed the literal path of one Southwest aircraft over one long holiday weekend. The screenshot below captures two of the graphics with a wee bit of text between.
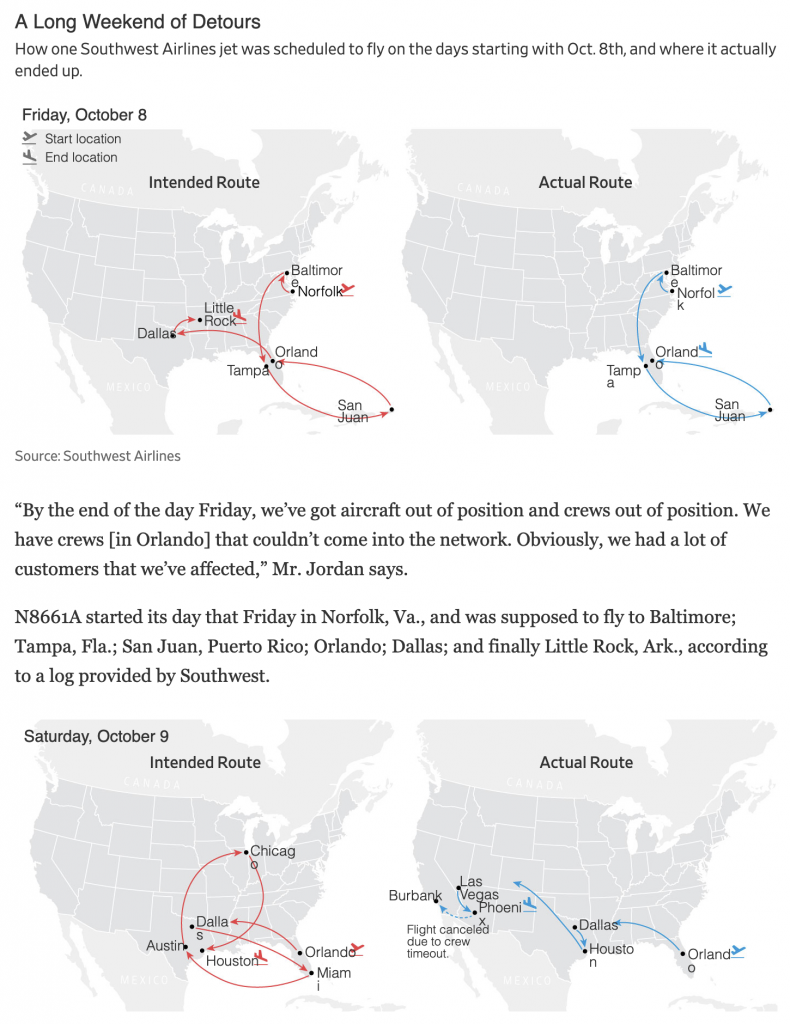
What’s nice about the graphics’ design is how they use small multiples and consistent colours. The intended route is always on the left and what actually happened is on the right. Red and blue colours depict those throughout.

The only thing I quibble with is the embedded HTML text. Sometimes the page loads fine for me, other times it looks like it did this morning for this screenshot. Note how for some city labels the final letters get dropped to a second line, e.g. the “o” in Chicago or the “e” in Baltimore.

This is far from a deal breaker on this being a good graphic, but I find it mildly annoying, especially when in situations like the bottom left Orlando, there’s no obvious reason as to why, because the little airplane departure icon sits atop the final letter.

I understand the idea behind using native HTML text in graphics, but when things like this happen, I wonder if it wouldn’t simply be better to include the text as part of the graphic and avoid these potential mishaps altogether.

Credit for the piece goes to Emma Brown.

Revenge of the Flyover States

Just before Halloween, NBC News published an article by political analyst David Wasserman that examined what airports could portend about the 2020 American presidential election. For those interested in politics and the forthcoming election, the article is well worth the read.

The tldr; Democrats have been great at winning over cosmopolitan types in global metropolitan areas in the big blue states, e.g. New York and California. But the election will be won in the states where the metropolitan areas that sport regional airports dominate, i.e. Pennsylvania, Michigan, Wisconsin, and North Carolina. And in those districts, support for Democrats is waning.

The closing line of the piece sums it up nicely:

…to beat Trump, Democrats will need to ask themselves which candidates’ proposals will fly in Erie, Saginaw and Green Bay.

But what about the graphics?

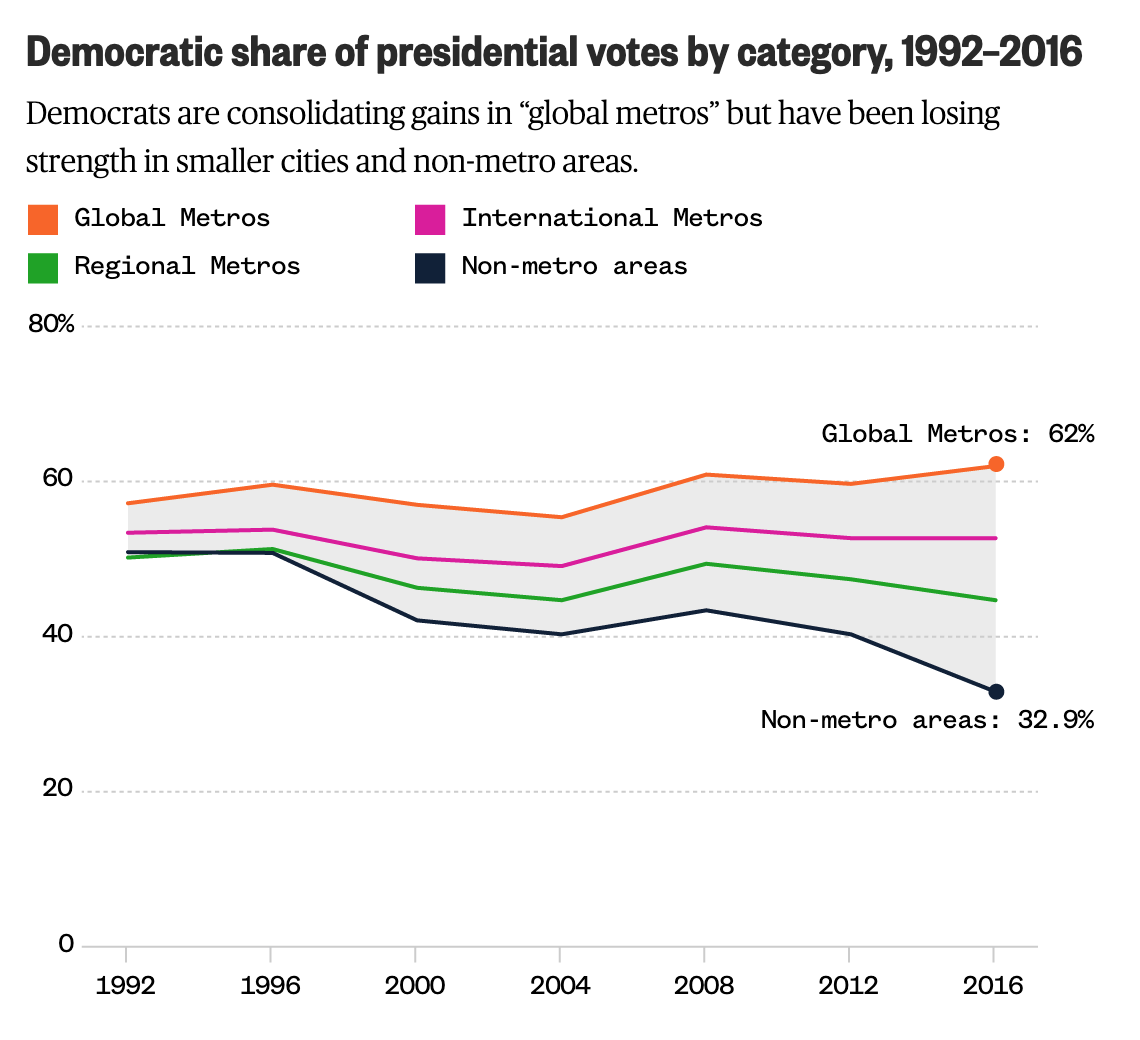
We have a line chart that shows how support for Democrats has been increasing amongst those in the global and international airport metros.

Democrats aren't performing well with the non-global and international types of metros
Democrats aren’t performing well with the non-global and international types of metros

It uses four colours and I don’t necessarily love that. However, it smartly ties into an earlier graphic that did require each series to be visualised in a different colour. And so here the consistency wins out and carries on through the piece. (Though as a minor quibble I would have outlined the MSA being labelled instead of placing a dot atop the MSA.)

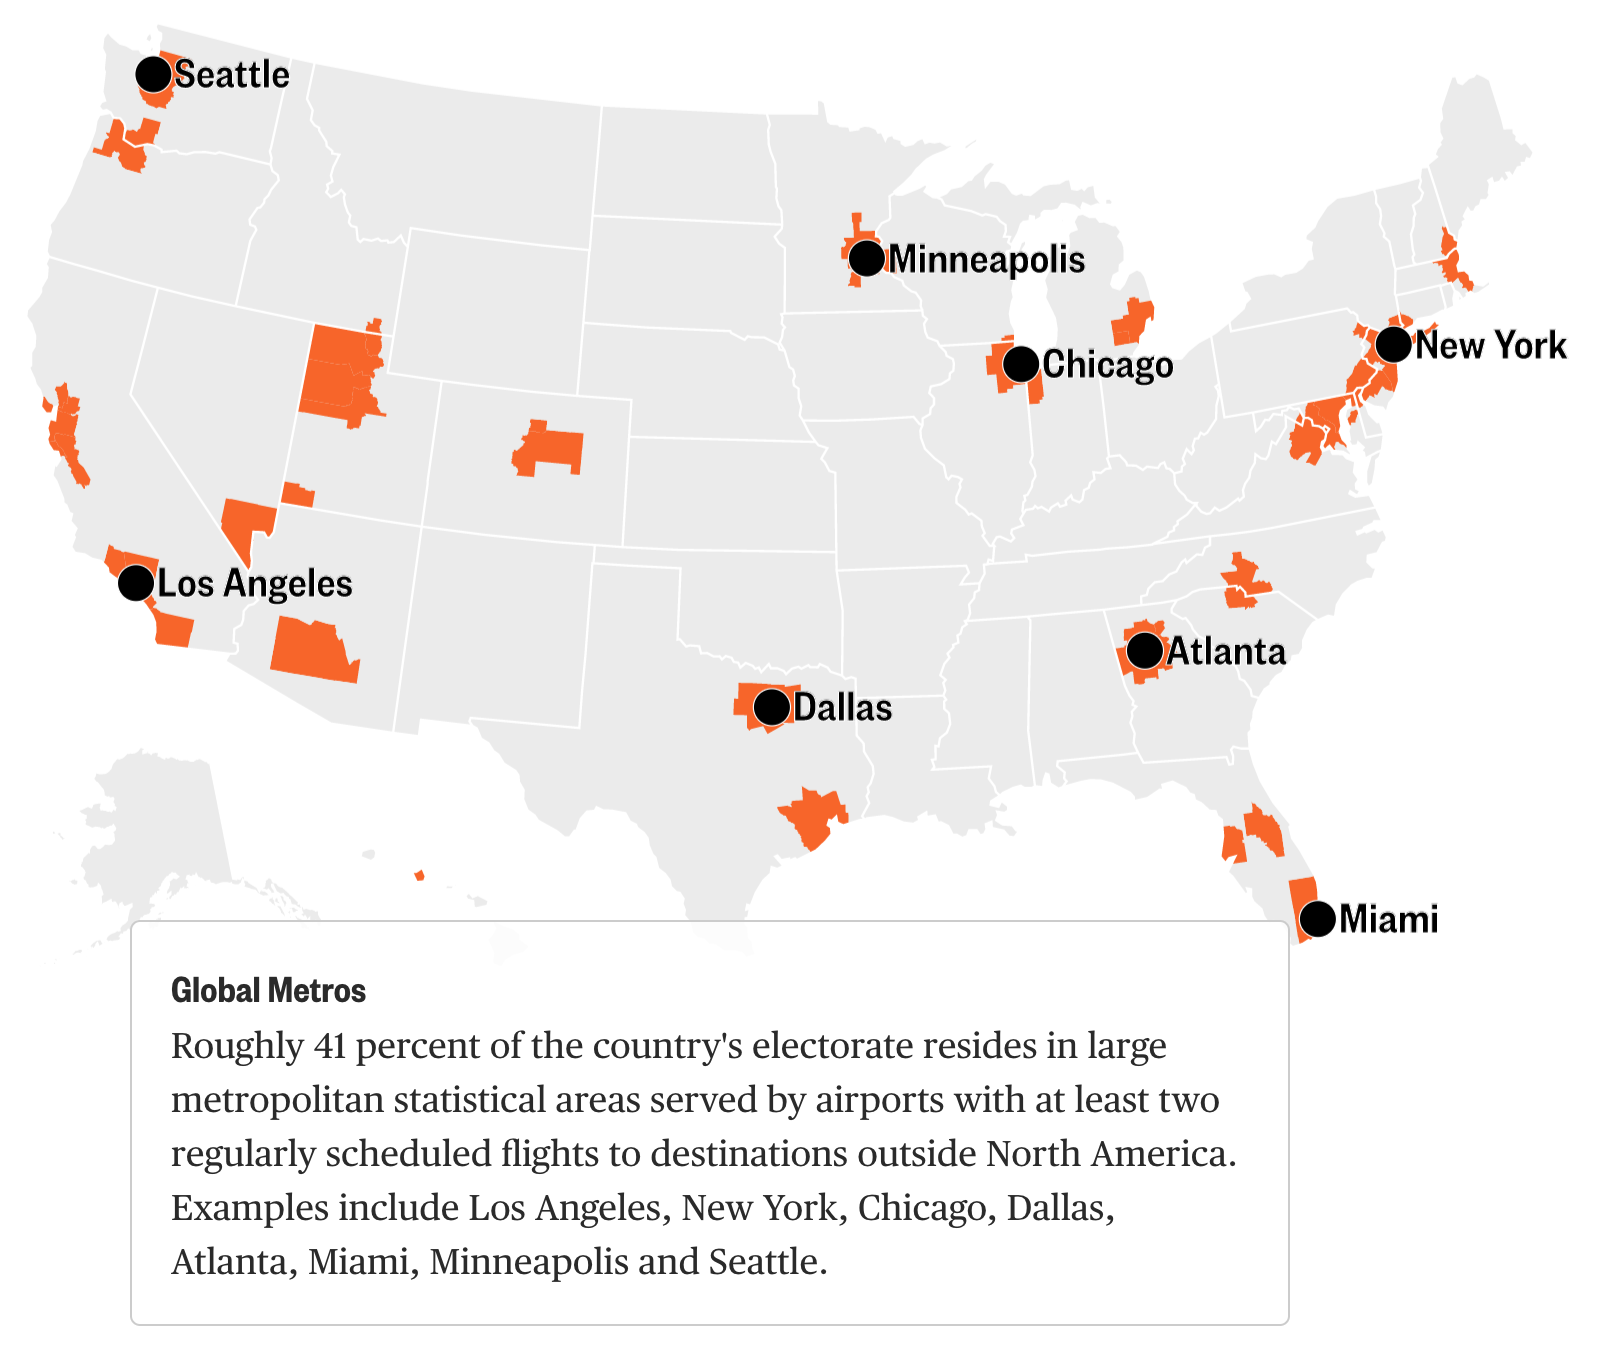
A lot of these global metros are in already blue states

The kicker, however is one of those maps with trend arrows. It shows the increasing Republican support by an arrow anchored over the metropolitan area.

Lot of Trump support in the battleground states

The problem here is many-fold. First, the map is actually quite small in the overall piece. Whereas the earlier maps sit centred, but outside the main text block, this fits neatly within the narrow column of text (on a laptop display at least). That means that these labels are all crowded and actually make it more difficult to realise which arrow is which city. For example, which line is Canton, Ohio? Additionally with the labels, because they are set in black text and a relatively bolder face, they standout more than the red lines they seek to label. Consequently, the users’ focus falls not on the lines, but actually on the labels—the reverse of what a good graphic should do.

Second, length vs. angle. If all lines moved away from their anchor at the same angle, we could simply measure length and compare the trending support that way. However, it is clear from Duluth and Green Bay that the angles are different in addition to their sizes. So how does one interpret both variables together?

Third, I wonder if the map would not have been made more useful with some outlines or shading. I may know what the forthcoming battleground states are. And I might know where they are on a map. But Americans are notorious for being, well, not great when it comes to geography. A simple black outline of the states could have been useful, though it in this design would have conflicted with the heavy black labelling of the arrows. Or maybe a purple shading could have been used to show those states.

Overall, the piece is well worth a read and the graphics generally help tell the narrative visually. But that final graphic could have used a revision or two.

Credit for the piece goes to Jiachuan Wu and Jeremia Kimelman.

The New Longest Flight

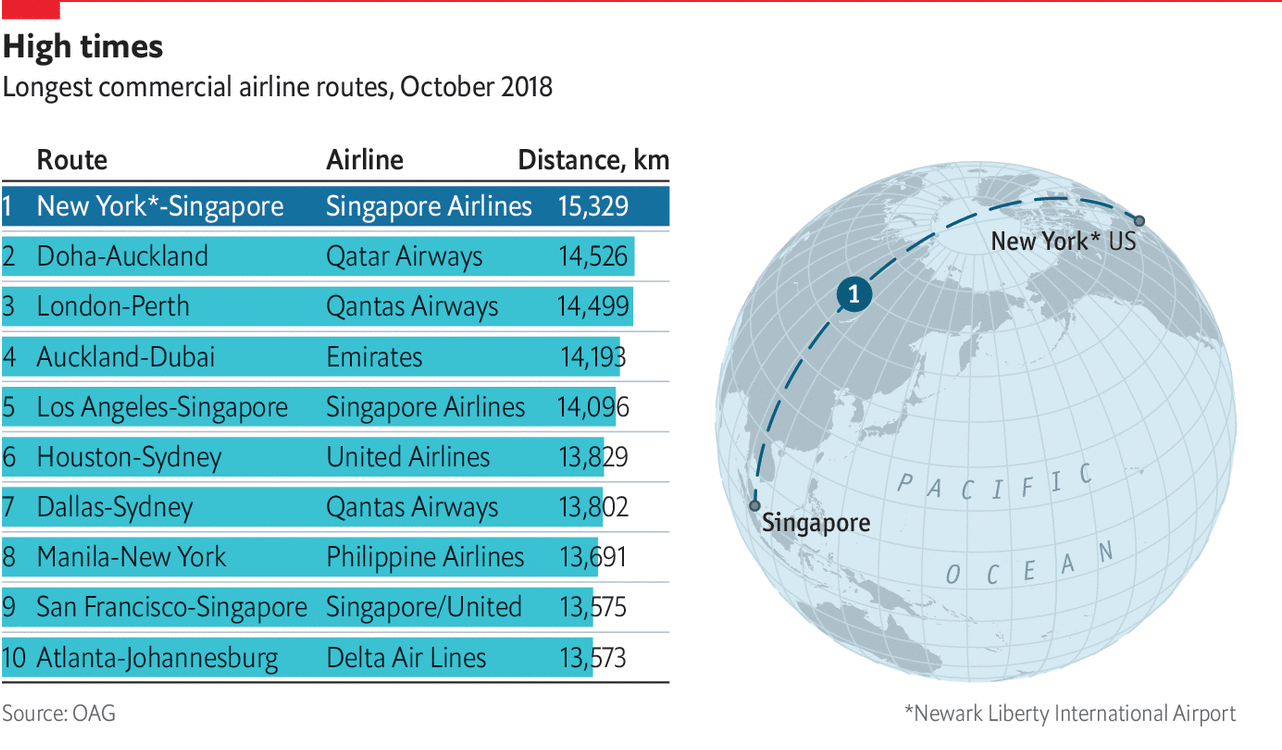
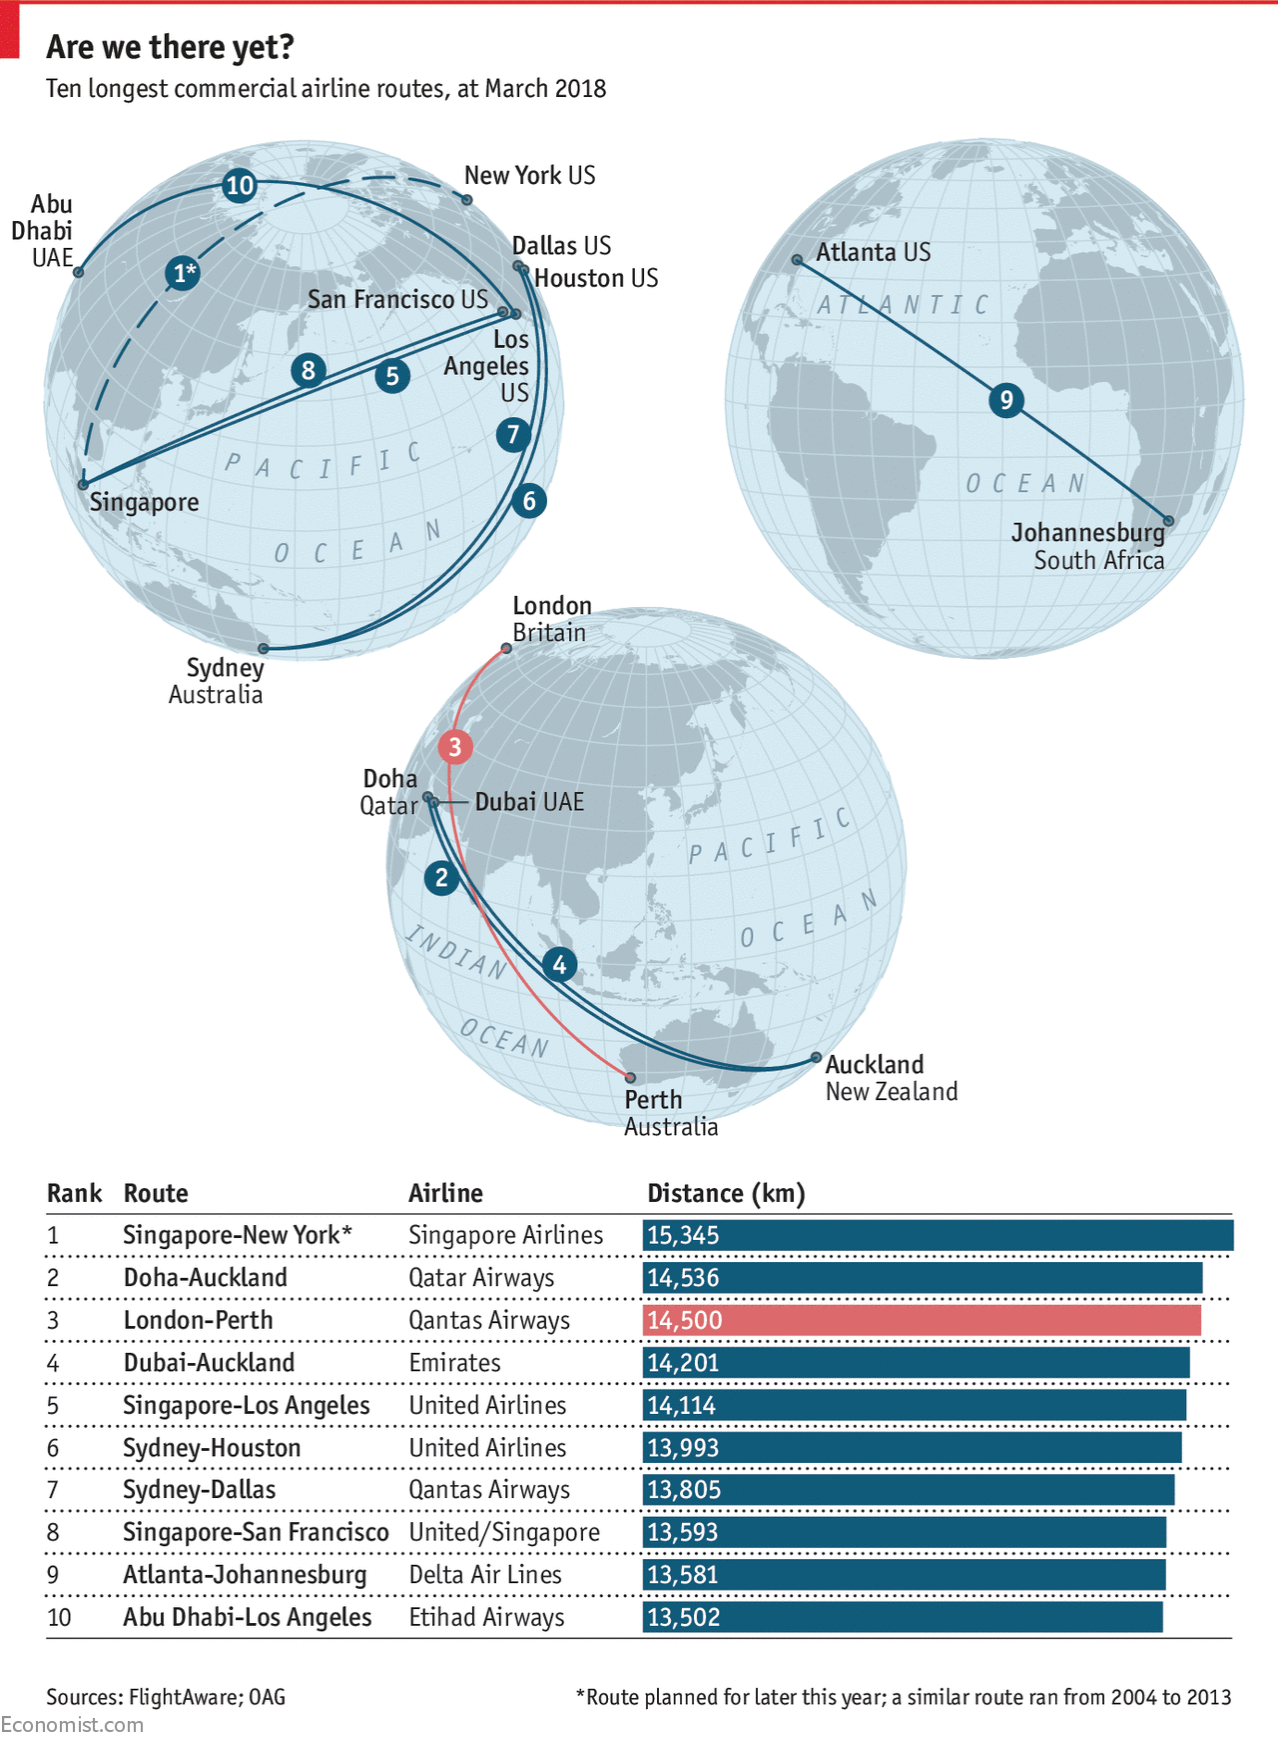
You might recall that back in March I wrote about the use of spherical maps to show great circles. This helps illustrate the actual routes that aircraft take in flight. (Yes, actual flight plans deviate based on routes, weather, traffic, &c.) At the time I wrote about how there was a soon-to-be Singapore–New York route. Ta da.

That's just a long time in one aircraft.
That’s just a long time in one aircraft.

Nothing fancy here in this graphic from the Economist. It probably is just a reuse of the original but with the additional routes removed. But, I still love these kinds of maps. From a design manager standpoint, in a way this is great efficiency in that an element from a graphic made once can now, with minimal effort, be used in a second piece. And not in a meaningless, throw-in way, but this graphic does very much help to illustrate the actual route and long across the globe it travels.

In a second note, not related to the graphic itself, I want to point out a subtle change made by the Economist. This is the first online graphic to use an updated chrome, which is the branding elements that surround the actual content of the piece.

Slight changes
Slight changes

The biggest change is a new or modified typeface for the graphic header. I have not seen anything about design changes at the Economist, but I will look into it. But the changes are, again, subtle. The best example in these two comparisons (new on the left, old on the right) is the shape of the letter e.

E, as in Economist
E, as in Economist

You can see how the terminal, or the part of the letter hooking and swinging out at the bottom, used to come to an end at an angle. Now it ends with a vertical chop. I haven’t looked too extensively at the typeface, but given the letter e, it appears to be a little bit wider of a face.

The other change, not quite as subtle, is the positioning of the iconic red rectangle around which so much of the Economist’s brand hangs. Bringing back the above graphic, you can see where I drew a black line to indicate the edge of the original graphic.

Slight changes

The box is now orientated horizontally (again, new is on the left), which actually brings it closer to the actual Economist logo. But, and probably more importantly, it allows the graphic’s edge to go to the, well, edge. And since their site uses generous whitespace around their graphics, they don’t necessarily need margins within the graphic.

They have also chosen to raise the level at which the header starts, i.e. there is less space between the red rule at the top of the graphic and the start of the words. This, however, appears to have been possible in the original design.

As more graphics roll out, I am going to be curious to see if there are other changes. Or even just to see how these subtle changes affect the rest of the graphics.

Credit for the piece goes to the Economist Data Team.

Southwest 1380

On Tuesday, Southwest Flight 1380 made an emergency landing here in Philadelphia after the Boeing 737-700’s port engine exploded. One passenger died, reportedly after being partially sucked out of the aircraft after the explosion broke a window. But the pilot managed to land the aircraft with only one engine and without any further deaths.

I wanted to take a look at some of the eventual graphics that would come out to visually explain the story. And as of Thursday, I have seen two: one from the Guardian and another from the New York Times.

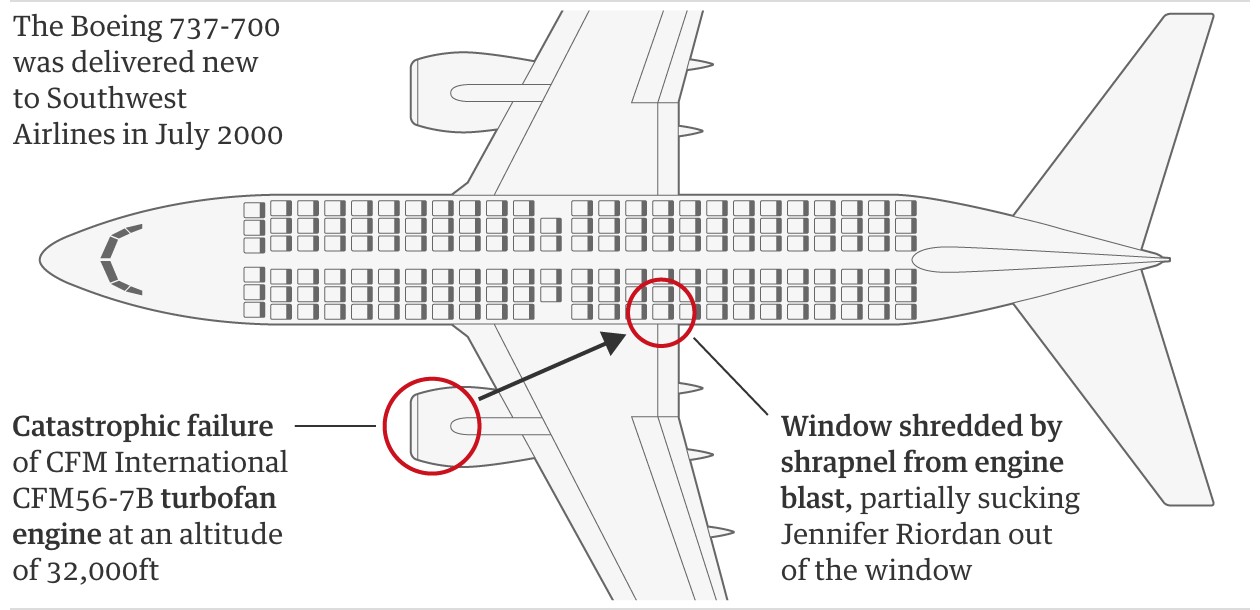
The Guardian’s piece is the simpler of the two, but captures the key data. It locates the engine and the location of the window blown out by debris from the engine.

The Guardian's graphic
The Guardian’s graphic

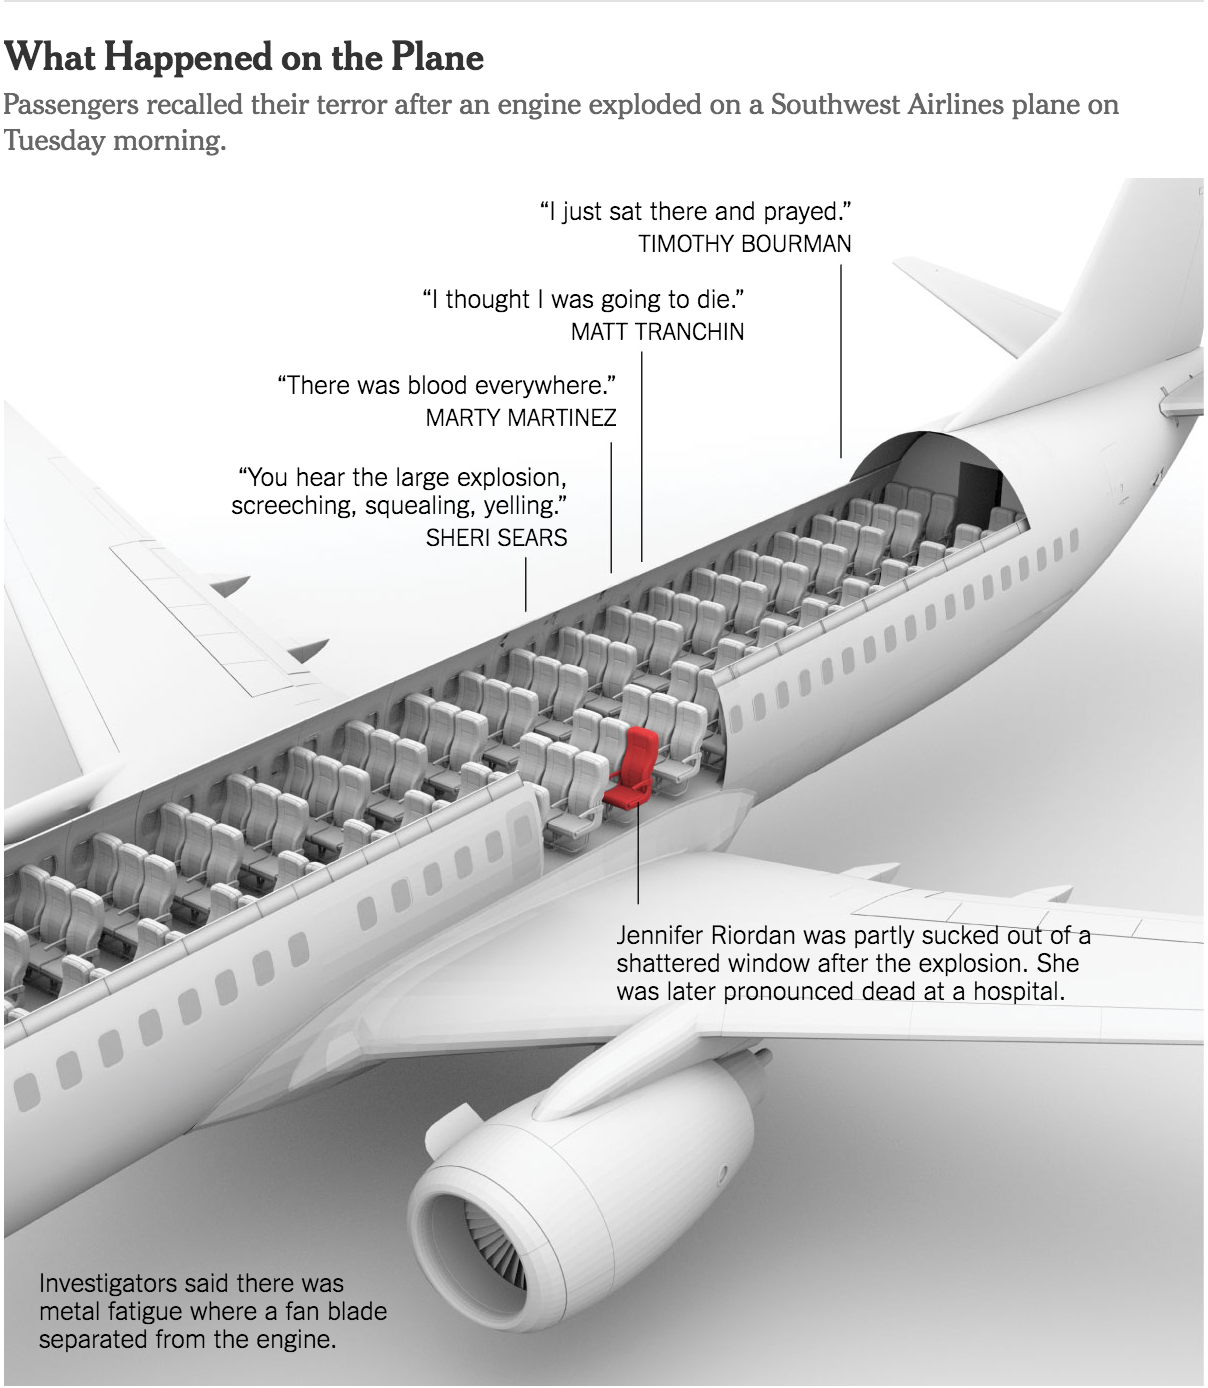
The New York Times’ piece is a bit more complex (and accompanied elsewhere in the article by a route map). It shows the seat of the dead passenger and the approximate locations of other passengers who provided quotes detailing their experiences.

The Times' graphic
The Times’ graphic

So the first thing that struck me was the complexity of the graphic. The Times opted for a three-dimension model whereas the Guardian went with a flat, two-dimensional schematic of the aircraft. Notice, though, that the seating layout is different.

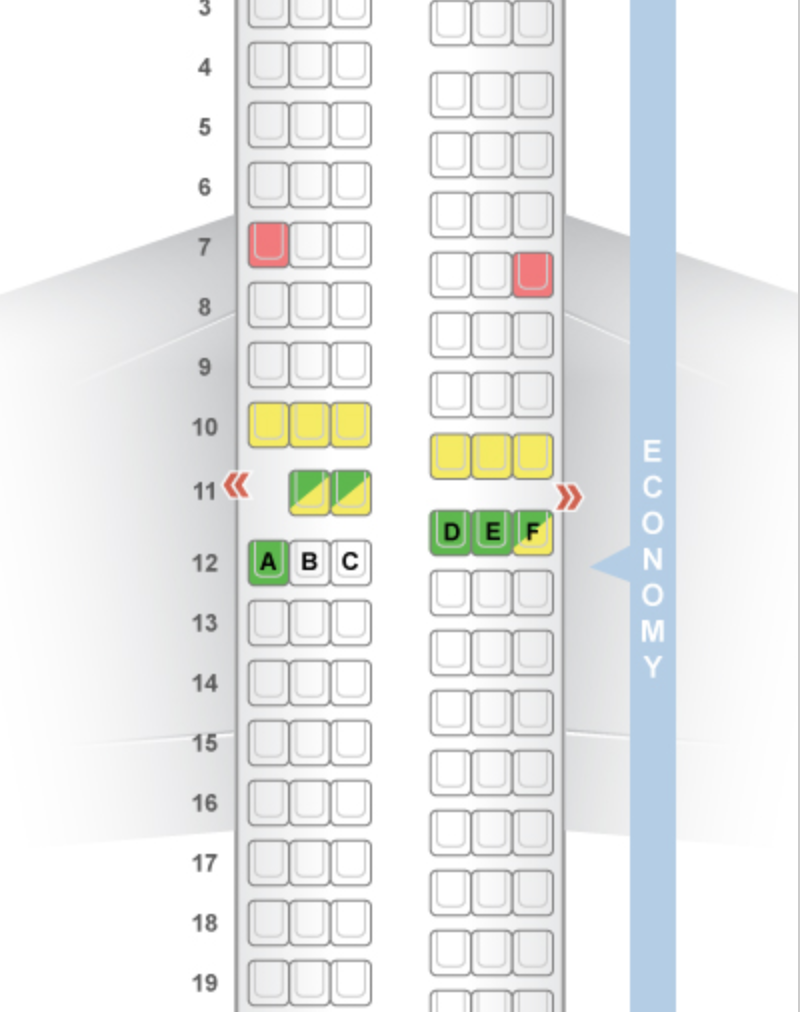
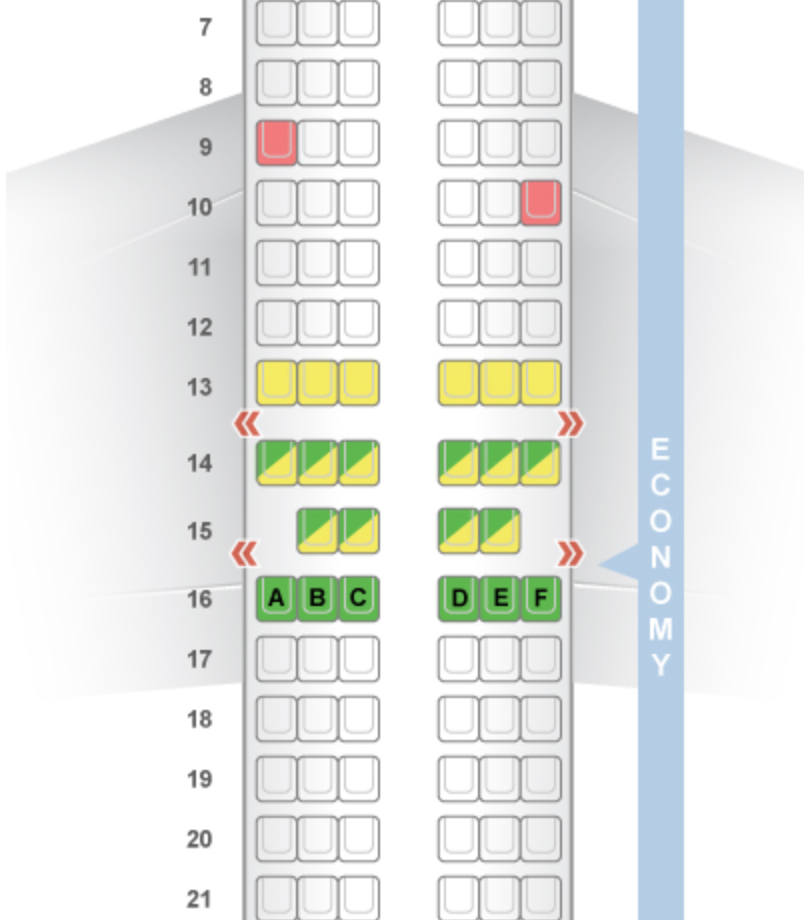
Four rows ahead of the circled window location are two seats, likely an exit row, in the Guardian’s graphic where in the Times’ piece they have a full three-seat configuration. If you check seating charts—seatguru.com was the first site that came up in the Google for me—you can see that neither configuration actually matches what the seating chart says should be the layout for a 737-700. Instead it, the Guardian’s more closely resembles the 737-800 model.

The 737-700 layout from SeatGuru.com

The 737-800 layout from SeatGuru.com

Nerding out on aircraft, I know. But, it is an interesting example of looking at the details in the piece. The Guardian’s piece is far closer to the layout, as least as provided by SeatGuru, and the New York Times’ is more representative of a generic narrow-body aircraft.

Personally, I prefer the Guardian in this case because of its improved accuracy at that level of detail. Though, the New York Times does offer some nice context with the passenger quotes. Unfortunately, the three-dimensional model ultimately provides just a flavour of the story, compared to the drier, but more accurate, schematic depiction of the Guardian.

Credit for the Guardian piece goes to the Guardian’s graphics department.

Credit for the New York Times piece goes to Anjali Singhvi, Sahil Chinoy, and Yuliya Parshina-Kottas.

Circle This

Last week I met a friend for drinks and part of our conversation was about how on a trip to east Asia, he flew from New York and then over the North Pole. The North Pole! I then explained it was cool, but not unique. Instead aircraft typically fly between destinations via great circles. Basically, the shortest distance between two points on the Earth is a straight line, but remember the Earth is not exactly flat. Its spherical nature means that the shortest distance sometimes is what you would see as a curve on a flat map. And sometimes, those curves are shortest when plotted over the North Pole, because unlike a flat map, the east and west ends really do connect.

Lo and behold, yesterday the Economist published a piece about a new non-stop flight between London and Perth, on Australia’s southwest coast. The graphic shows the ten longest commercial flight paths. And what do you know, one of the longest is a soon-to-be flight from New York to Singapore that flies near the North Pole.

Great circles are cool.

Of course the key to this type of diagram is the type of projection. Instead of using the Mercator-like map made popular by direction-focused maps like those of Google, here we see an orthographic presentation. It presents the Earth as if we were to see it from space, allowing us to see the fullness of the flight paths. Tellingly, those that appear to cross the middle of the map are shown as straight lines (Atlanta to Johannesburg), but those nearer the edges show the curvature of the great circles (Houston to Sydney).

Credit for the piece goes to the Economist graphics department.

Airport Codes

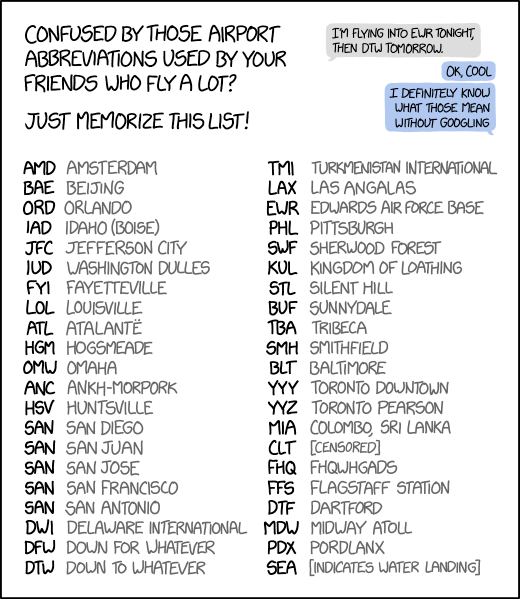
I managed to find myself in a handful of airports over the last few weeks. Consequently I brushed up on my airport codes, the three-letter abbreviations you often find on boarding passes and data displays. Well, if only I had seen this particular reference from xkcd.

Oh PHL…
Oh PHL…

Credit for the piece goes to Randall Munroe.

Flying for Thanksgiving

This is a piece from a few years ago, but the New York Times cleverly brought it to the front of their Upshot page. And it seemed just so appropriate. Many of you are likely travelling today—I’m not, I’m headed to work—and many of you will be driving or taking the train. But some will be flying. But to and from where?

If only it captured other travel data

The map has some nice features that allow you to selectively few particular cities. Philadelphia has relatively few travellers by air, but that’s probably because places in the Northeast are more easily accessible by road or rail.

Chicago also has relatively few travellers, though more than Philadelphia. I would posit that is because most people are not flying to visit their relatives, but rather driving to places in Wisconsin, Iowa, and Indiana.

No post tomorrow, because I intend on sleeping in. But you can expect something on Friday.

Credit for the piece goes to Josh Katz and Quoctrung Bui.

Where Trump Has Travelled

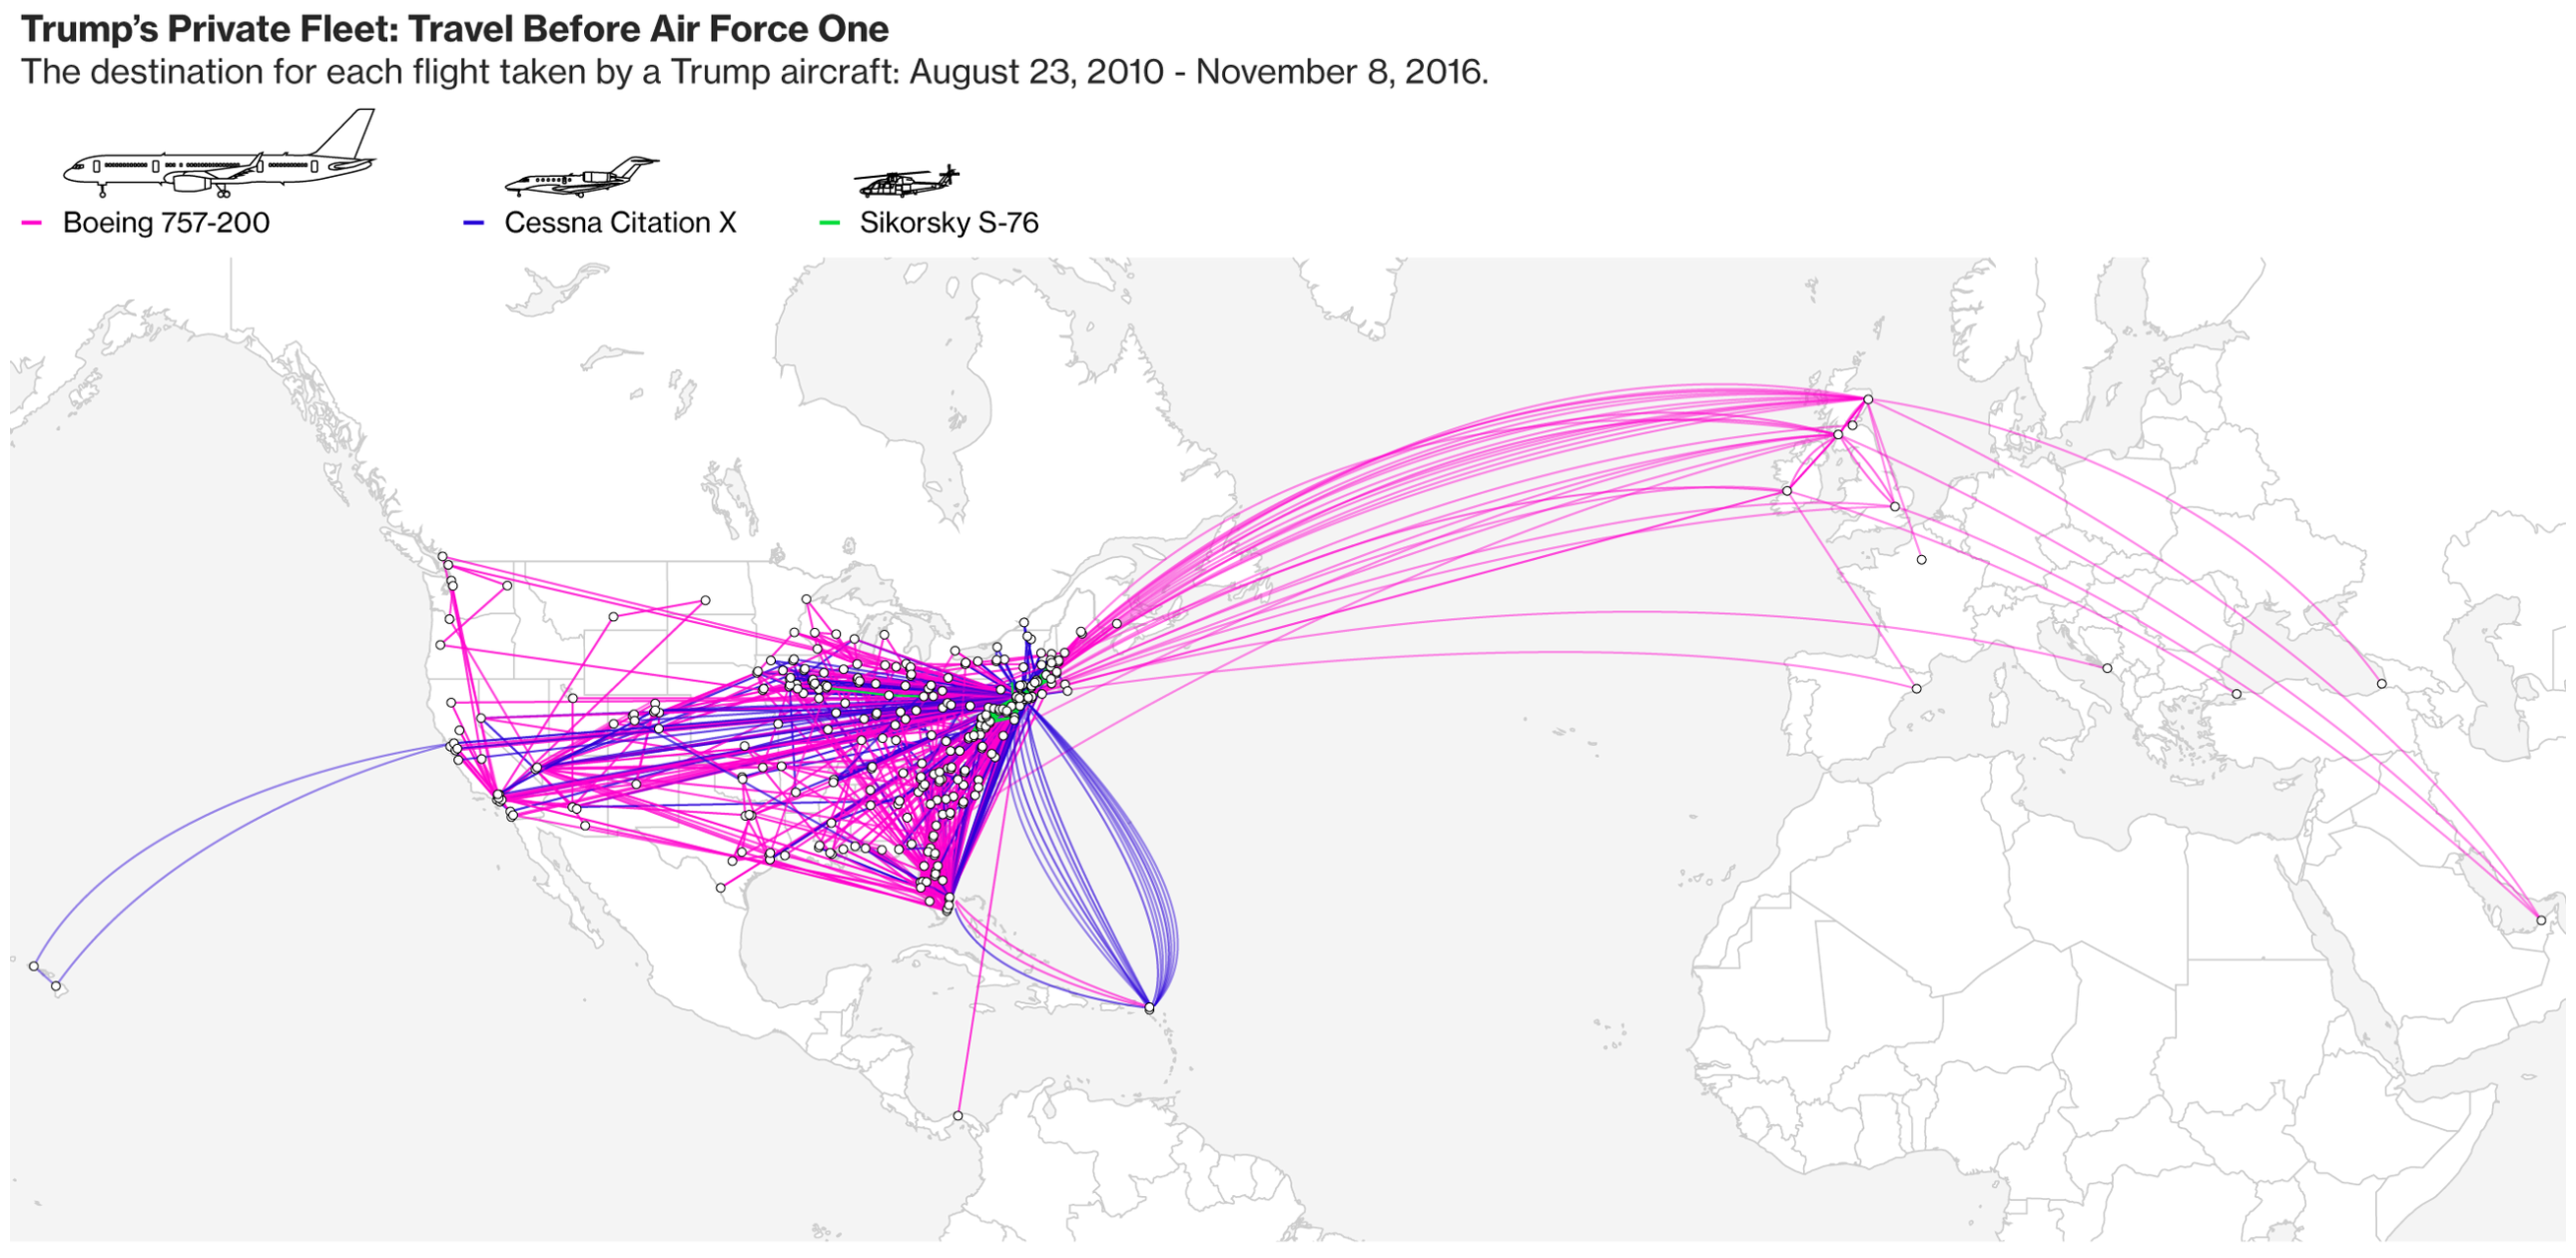
Okay, not entirely. But Bloomberg put together a solid series of graphics tracking not the travels of Donald Trump, but his private aircraft. But that information can serve as a rough proxy for Trump’s travels. But the data is not complete—Russia is missing from the map though he has visited the country for business.

Where Trump's private aircraft flew
Where Trump’s private aircraft flew

Credit for the piece goes to Vernon Silver, Michael Keller, and Dave Merrill.

Striking the Balance Between Airline Prices and Service

Yesterday I took a look at the Alaskan Airlines and Virgin America merger. Part of the disappointment on the internets centres around the service and experience delivered by Virgin. I mean who doesn’t like mood lighting, right? Well the Economist took a look at international airlines by both price and service. And if we use Virgin Atlantic as the best proxy for Virgin America, you can see why people prefer it over American carriers.

Price vs. service
Price vs. service

Credit for the piece goes to James Tozer.

Merging Alaska Airlines and Virgin America

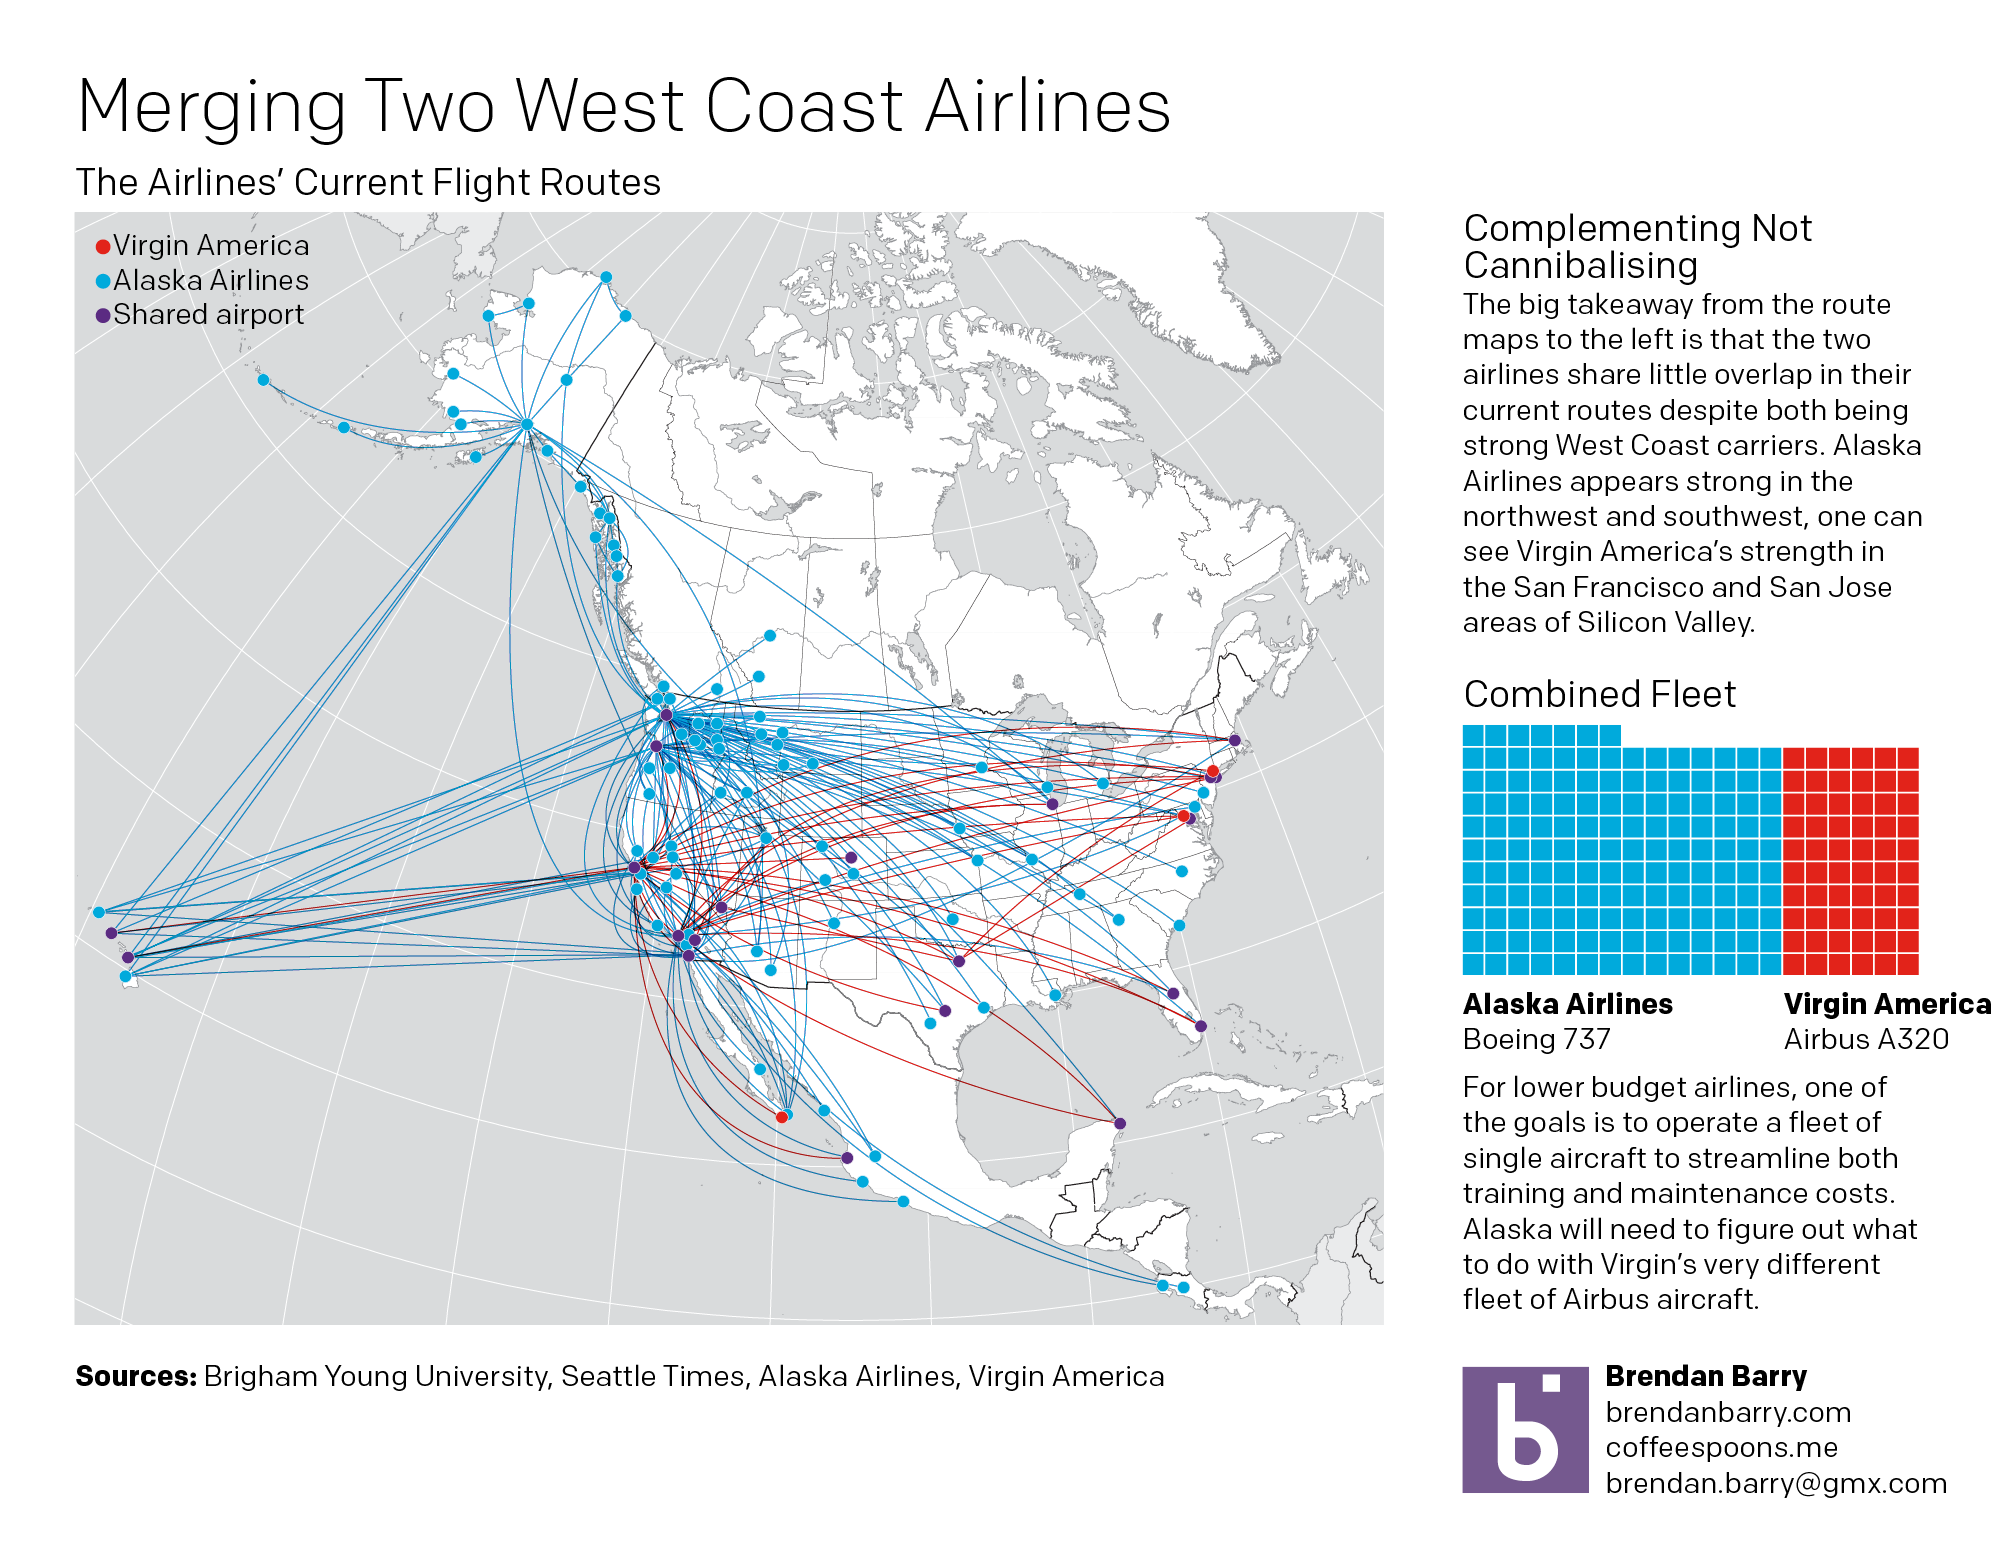
Alaska Airlines and Virgin America made some news the past few days when they announced Alaska would purchase Virgin America for $2.6 billion. I mapped out the flight routes of the two carriers to see where they overlapped. You can see the results in my piece for the blog today below.

A brief look at the merger of Alaska Airlines and Virgin America

Credit for the work is mine, except the underlying map, which I sourced from Brigham Young University Geography Department.