The Affordable Care Act You Likely Know as Obamacare

It just won’t die. Grandma, that is, in front of the death panels of Obamacare. Remember those? Well, even if you don’t, the Affordable Care Act (the actual name for Obamacare) is still around despite repeated attempts to repeal it. So in this piece from Bloomberg, Obamacare is examined from the perspective of leaving 27 million people uninsured. In 2010, there were 47 million Americans without insurance and so the programme worked for 20 million people. But what about those remaining 27?

I am not usually a fan of tree maps, because it is difficult to compare areas. However, in this piece the designers chose to animate each section of the tree as they move along their story. And because the data set remains consistent, e.g. the element of the 20 million who gained insurance, the graphic becomes a familiar part of the article and serves as a branching off point—see what I did there?—to explore different slices of the data.

This is a tree map I actually think works well

So in the end, this becomes one of those cases where I actually think the tree map worked to great effect. Now there is a cartogram in the article, that I am less sure about. It uses squares within squares to represent the number of uninsured and ineligible for assistance as a share of the total uninsured.
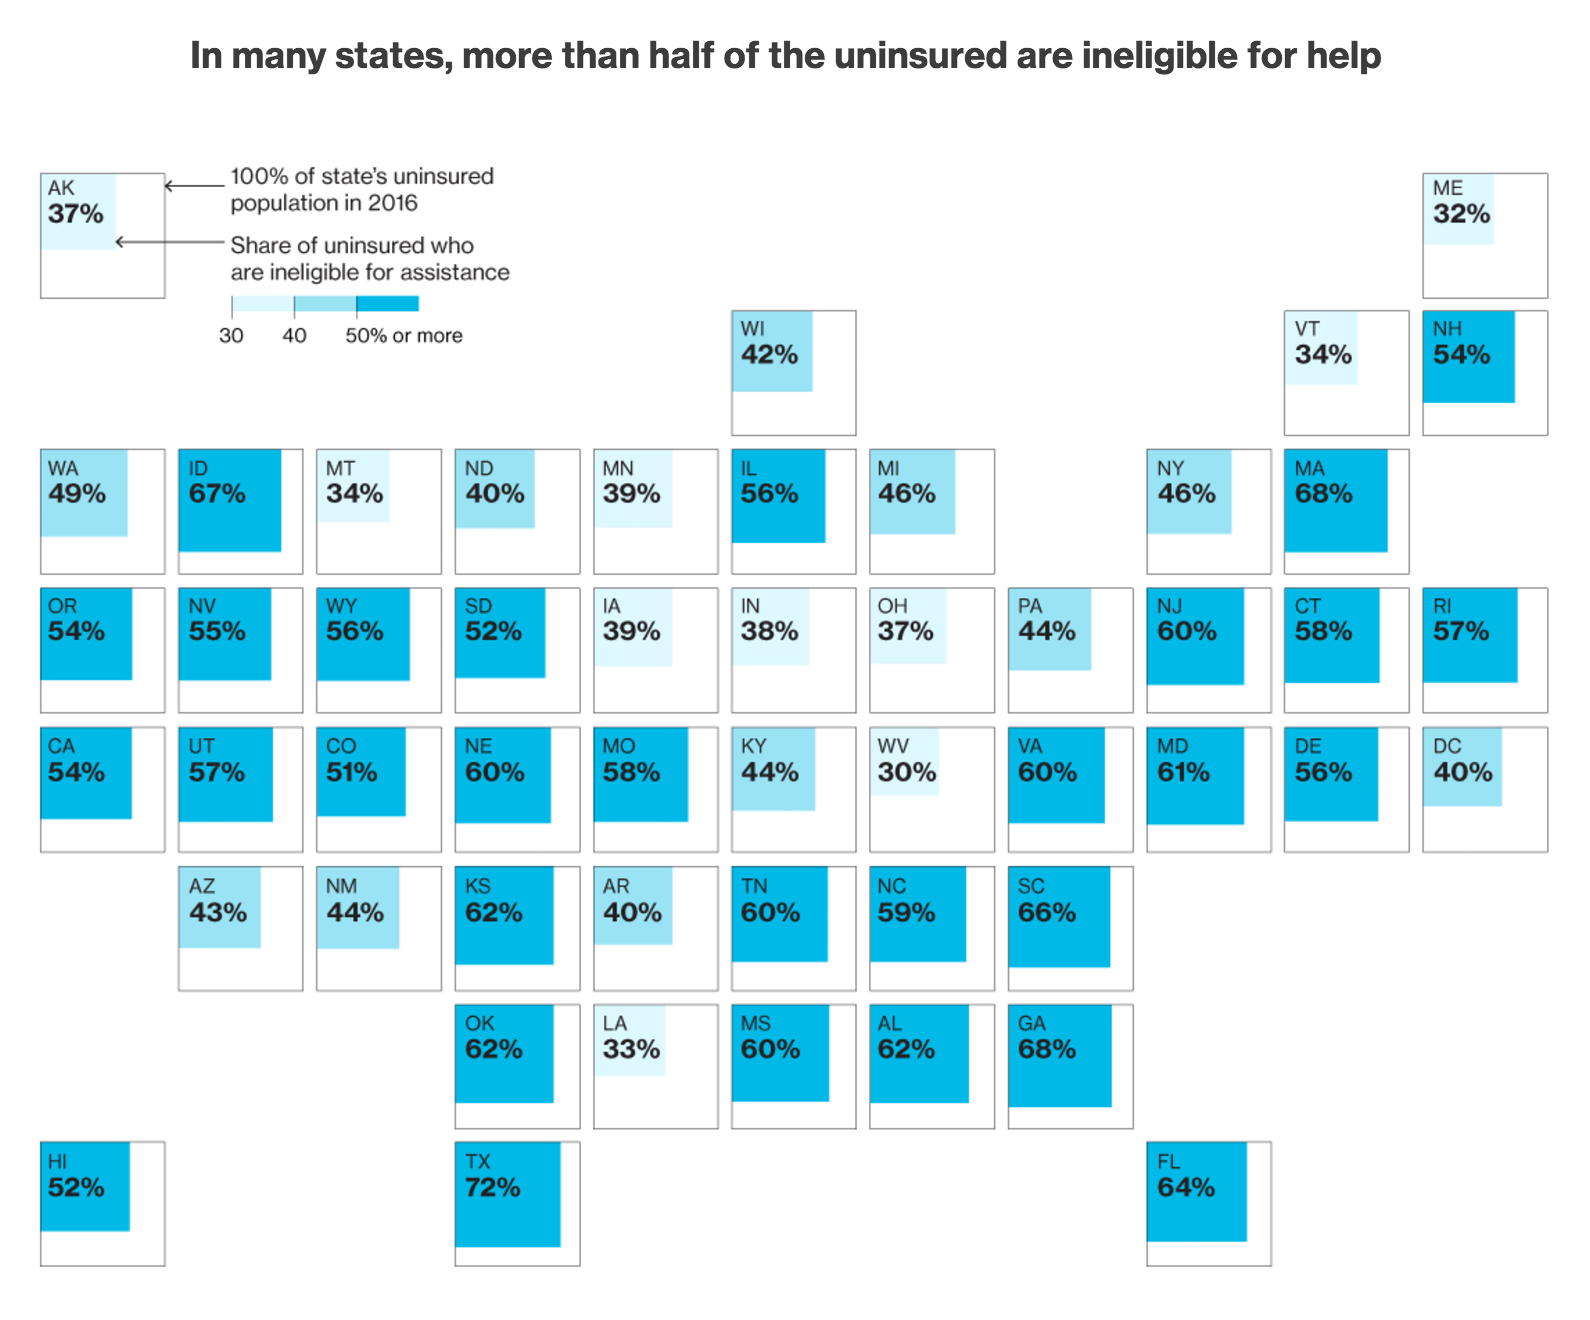
I'm not sure the map is necessary here
I’m not sure the map is necessary here

Some of the visible patterns come from states that refused to expand Medicaid. It was supposed to cover the poorest, but the Supreme Court ruled it was optional not mandatory and 19 states refused to expand the coverage. But surely that could have been done in a clearer fashion than the map?

Credit for the piece goes to Jeremy Scott Diamond, Zachary Tracer, and Chloe Whiteaker.

Predicting the Electoral College

Well the Democratic DC primaries were last Tuesday and Hillary Clinton won. So now we start looking ahead towards the July conventions and then the November elections. Consequently, if a day is an eternity in politics we have many lifespans to witness before November. But that does not mean we cannot start playing around with electoral college scenarios.

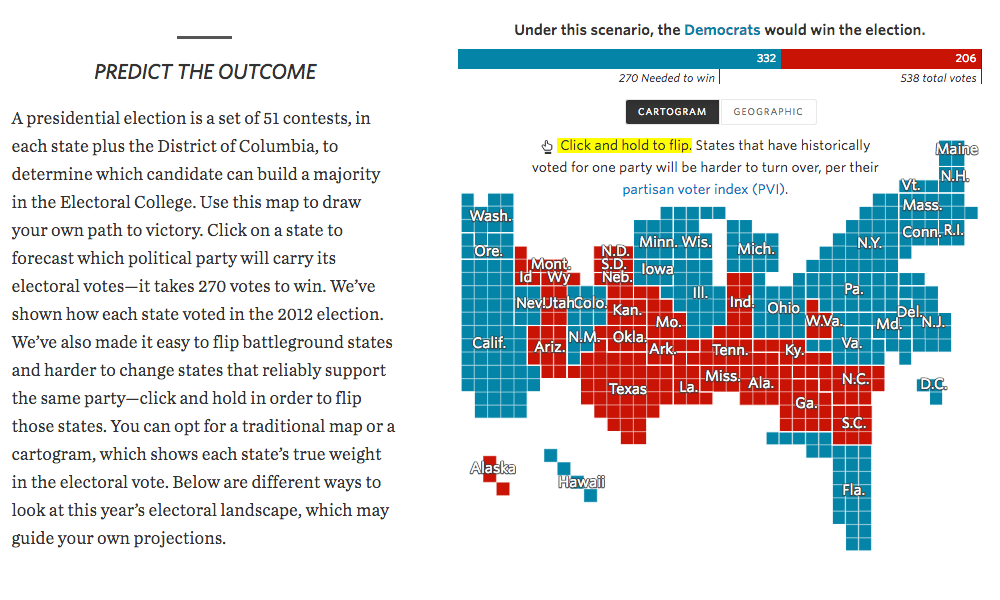
The Wall Street Journal has a nice scenario prediction page that leads with the 2012 results map, in both traditional map and cartogram form. You can play god and flip the various states to either red or blue. But from the interaction side the designers did something really interesting. Flipping a state requires you to click and hold the state. But the speed with which it then flips is not equal for all states. Instead, the length of hold time depends upon the state’s likelihood to be a flippable state, based on the state’s partisan voter index. For example, if you try and flip Kansas, you will have to wait awhile to see the state turn blue. But try and flip North Carolina and the flip is near instantaneous.

Starting with the 2012 cartogram

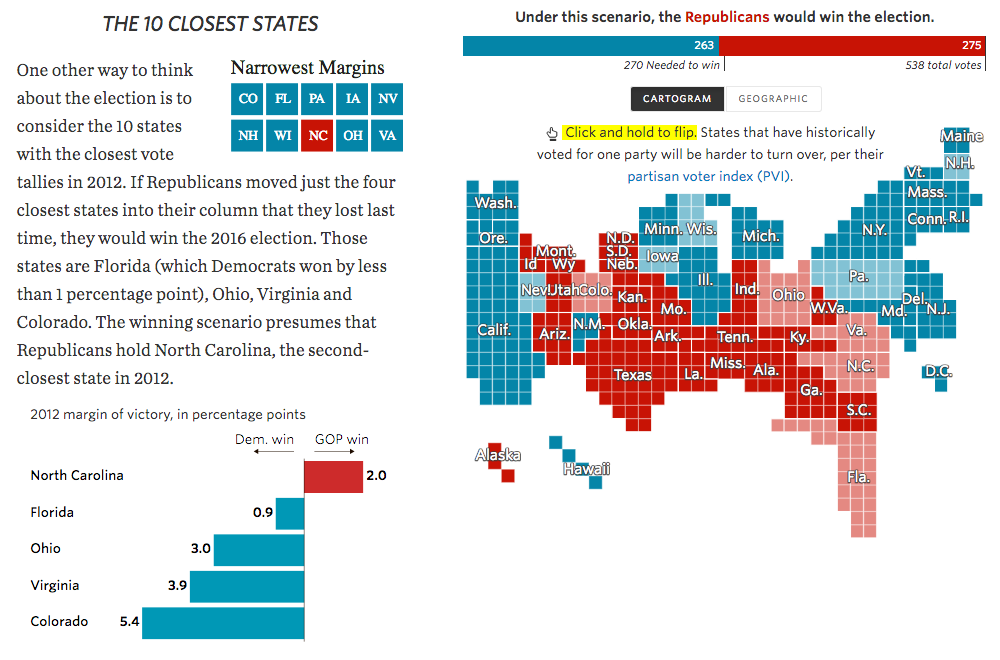
While the geographic component remains on the right, the left-hand column features either text, or as in this other screenshot, smaller charts that illustrate the points more specifically.

Charts and cartograms and text, oh my

Taken all together, the piece does a really nice job of presenting users with a tool to make predictions of their own. The different sections with concepts and analysis guide the user to see what scenarios fall within the realm of reason. But, what takes the cake is that flipping interaction. Using a delay to represent the likelihood of a flip is brilliant.

Credit for the piece goes to Aaron Zitner, Randy Yeip, Julia Wolfe, Chris Canipe, Jessia Ma, and Renée Rigdon.

The History and Future of Data Visualisation

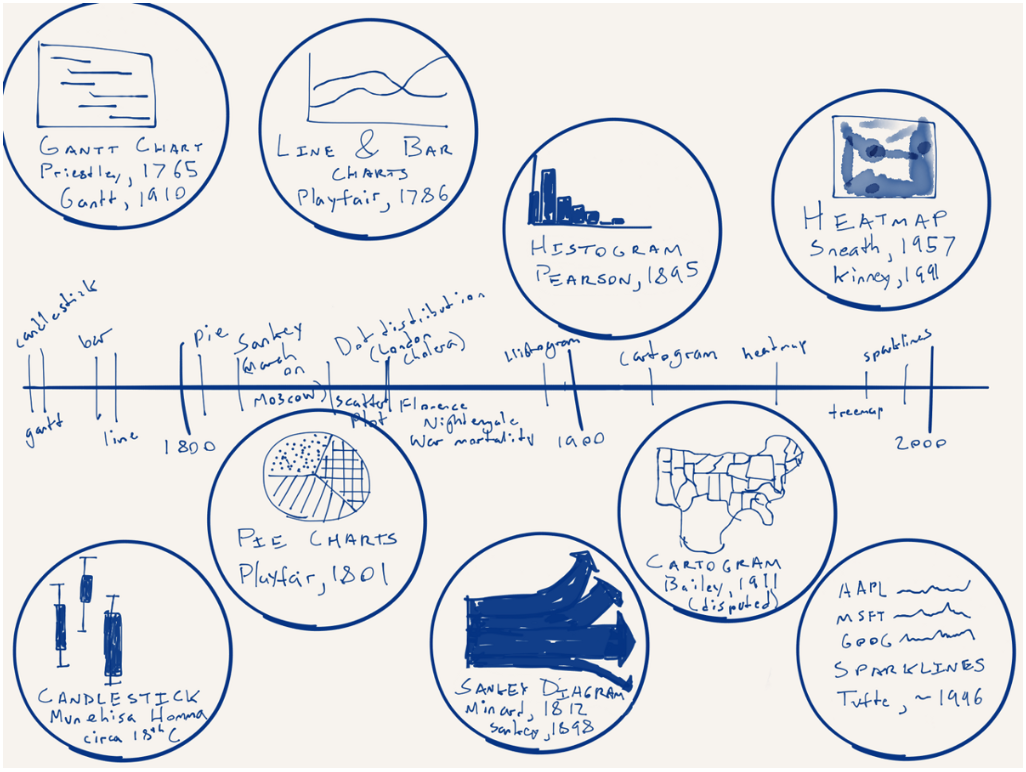
From time to time in my job I hear the desire or want for more different types of charts. But in this piece by Nick Brown over on Medium, we can see that there are really only a few key forms and some are already terrible—here’s looking at you, pie charts. How new are some of these forms? Turns out most are not that new—or very new depending on your history/timeline perspective. Brown illustrated that timeline by hand.

A timeline of chart forms

Worth the read is his thoughts on what is new for data visualisation and what might be next. No spoilers.

Credit for the piece goes to Nick Brown.

It’s All the Hex

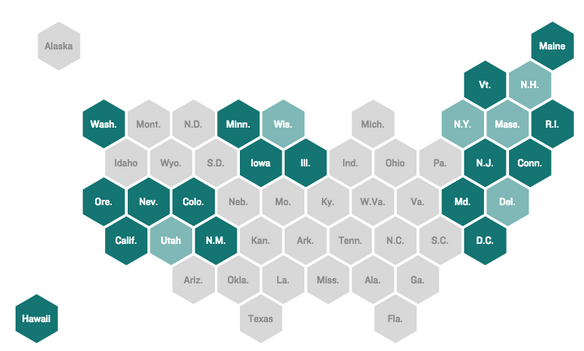
If you have not noticed, lots of news sites are using a variant of the cartogram lately. Basically, the idea is that geographic maps have the limitation of accurately representing landmass. And that means small polities, e.g. Rhode Island or Belgium, that might be quite important are visibly not so much, because they are geographically small. These pseudo-cartograms sort of do the trick by making all polities the same size. The trade off? Geographic fidelity. Anyway, there is an intelligent piece worth reading over at the NPR blogs explaining the thought process going on there about why to use the form. (You may recall I wrote about a similar project for London boroughs back in February.)

Hex map
Hex map

Credit for the piece goes to Danny DeBelius.

Old Healthcare Policy Renewal

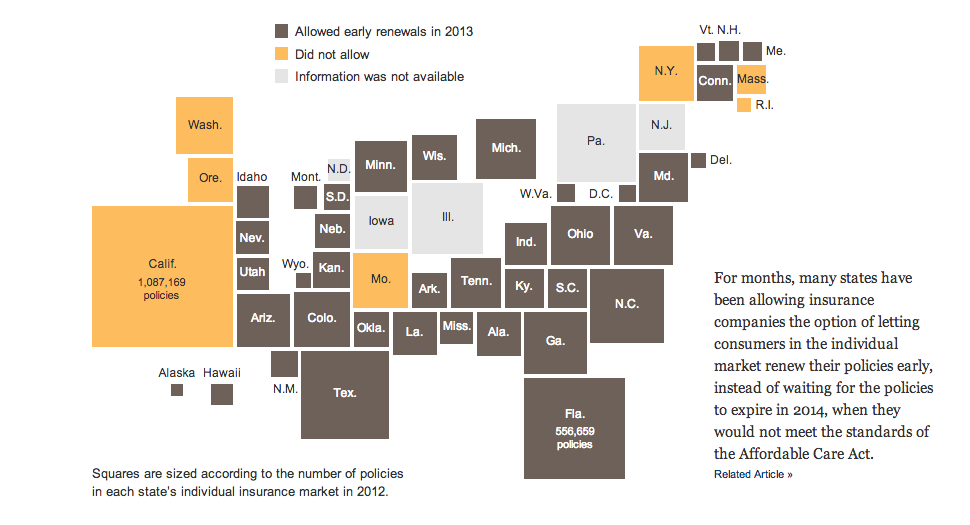
Let’s start this week off with cartograms. Sometimes I like the idea, sometimes not so much. Here is a case where I really do not care for the New York Times’ visualisation of the data. Probably because the two cartograms, a before and after of health policy renewals, do not really allow for a great side-by-side comparison. I imagine there is probably a way of condensing all of that information into a single chart or graphic component.

The before map
The before map

Credit for the piece goes to Keith Collins, Josh Katz, Katie Thomas, Archie Tse, and Karen Yourish.

Cartograms

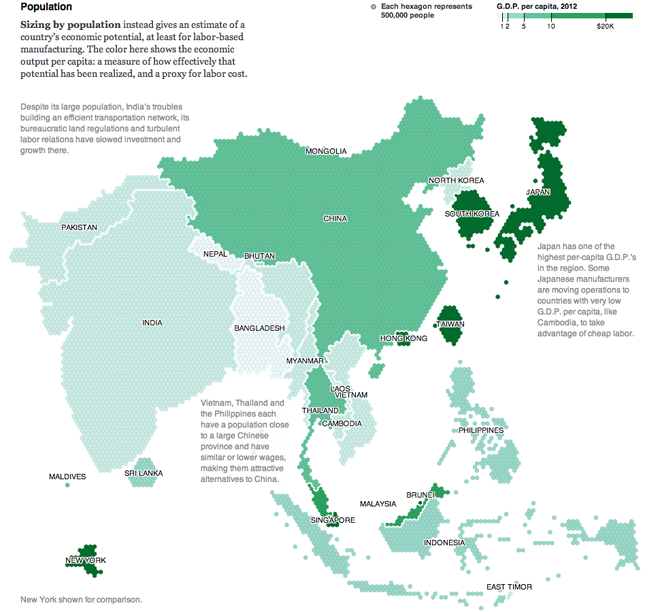
Continuing this week’s map theme, we have an example of a cartogram from the New York Times. This piece supplements an article about how some manufacturing companies are starting to look away from China as a place for their facilities. There are two maps, the first (not shown here) looks at economic output overall. The second (below) takes that output and accounts for population.

GDP per capita
GDP per capita

Hexagons are used instead of the more familiar squares to represent 500,000 people and the colour is the GDP per capita. The text accompanying the graphic explains how this is a measure of economic potential being (or not being) realised. But what the hexagons allow the map to do is better represent the shapes of the countries. Squares, more common in cartograms, create awkward box-like outlines of countries. That would be fine if countries were often shaped like squares, but they are not.

I am not often a fan of cartograms, but I find this one well executed and the annotations and explanatory text make what might otherwise be confusing far simpler to understand. All in all, a solid piece.

Credit for the piece goes to Mike Bostock and Keith Bradsher.