It just won’t die. Grandma, that is, in front of the death panels of Obamacare. Remember those? Well, even if you don’t, the Affordable Care Act (the actual name for Obamacare) is still around despite repeated attempts to repeal it. So in this piece from Bloomberg, Obamacare is examined from the perspective of leaving 27 million people uninsured. In 2010, there were 47 million Americans without insurance and so the programme worked for 20 million people. But what about those remaining 27?
I am not usually a fan of tree maps, because it is difficult to compare areas. However, in this piece the designers chose to animate each section of the tree as they move along their story. And because the data set remains consistent, e.g. the element of the 20 million who gained insurance, the graphic becomes a familiar part of the article and serves as a branching off point—see what I did there?—to explore different slices of the data.

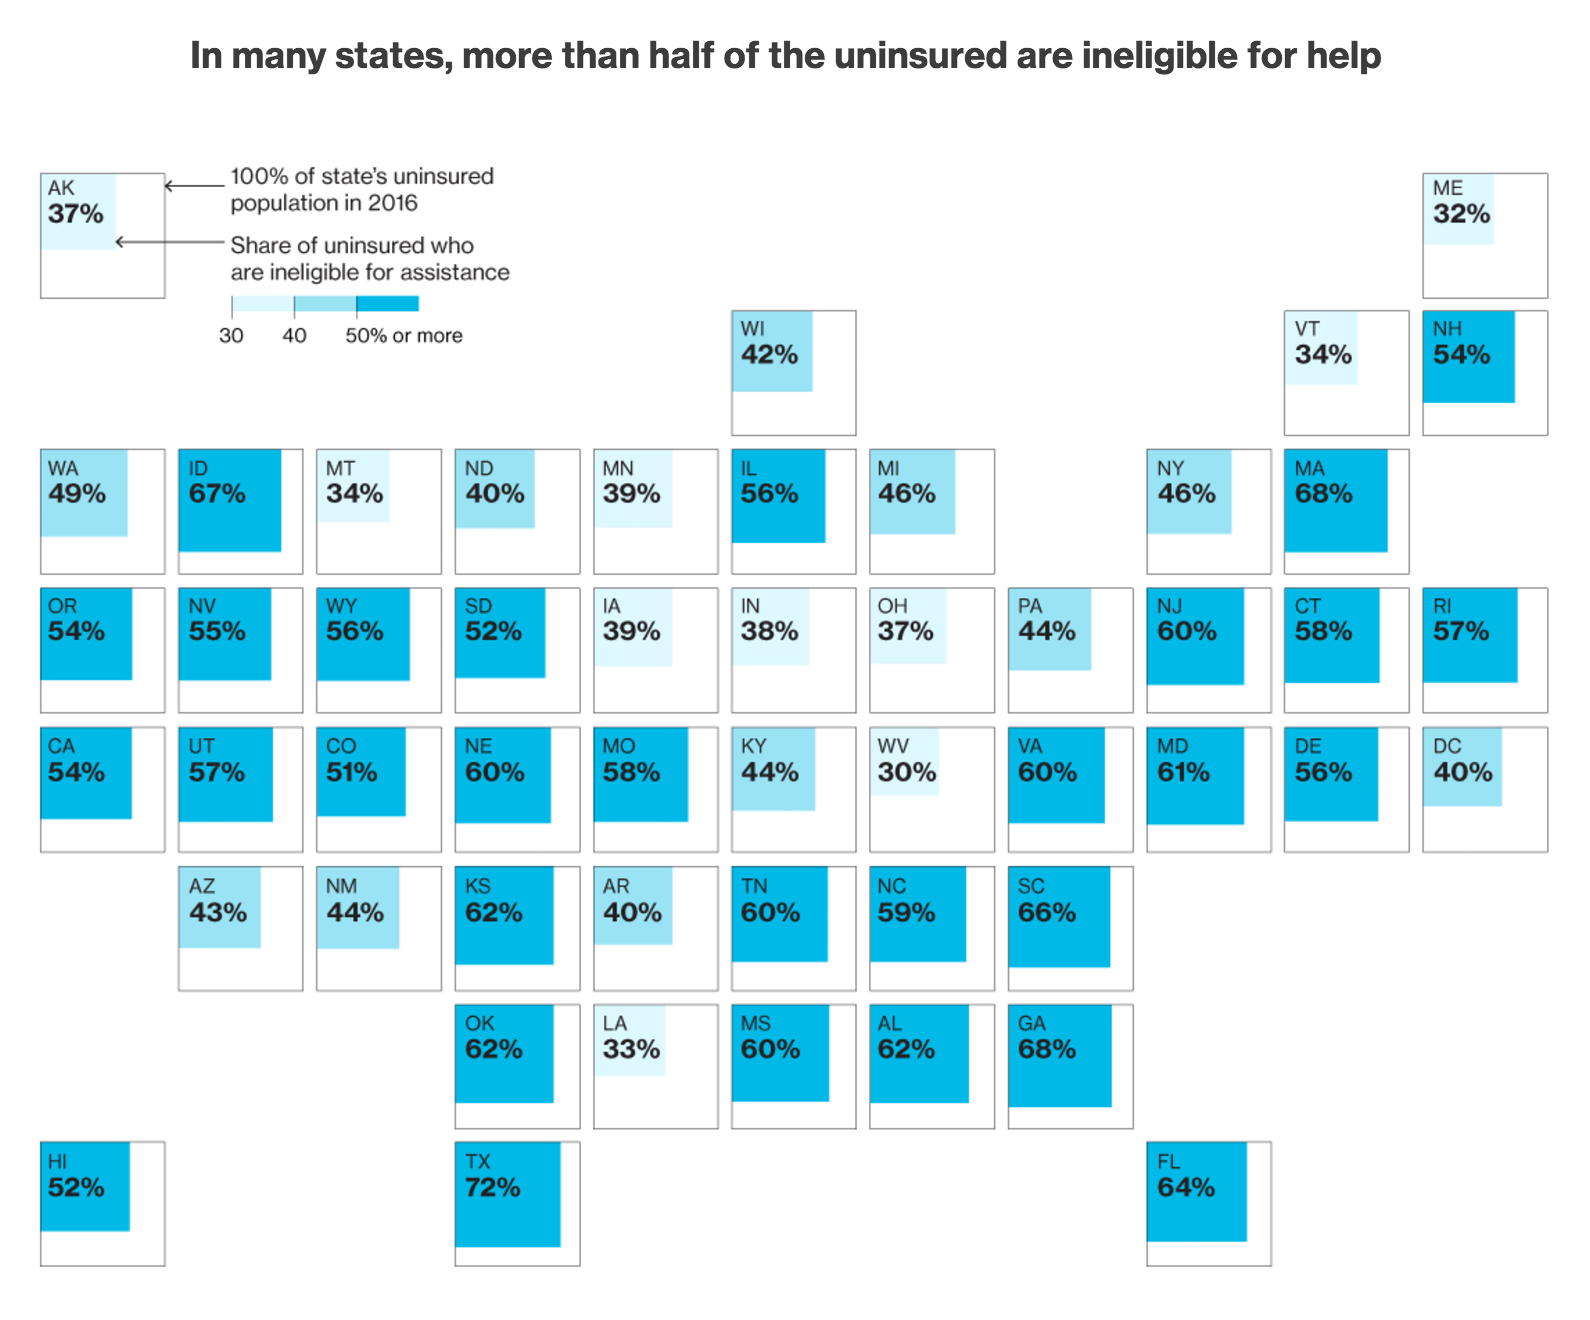
So in the end, this becomes one of those cases where I actually think the tree map worked to great effect. Now there is a cartogram in the article, that I am less sure about. It uses squares within squares to represent the number of uninsured and ineligible for assistance as a share of the total uninsured.

Some of the visible patterns come from states that refused to expand Medicaid. It was supposed to cover the poorest, but the Supreme Court ruled it was optional not mandatory and 19 states refused to expand the coverage. But surely that could have been done in a clearer fashion than the map?
Credit for the piece goes to Jeremy Scott Diamond, Zachary Tracer, and Chloe Whiteaker.
