Today’s post comes via a friend. We look at a video comparing the details of two typefaces: Helvetica vs. Arial. Happy Friday, everybody.

Credit for the piece goes to Charles Cultrara.
Today’s post comes via a friend. We look at a video comparing the details of two typefaces: Helvetica vs. Arial. Happy Friday, everybody.

Credit for the piece goes to Charles Cultrara.
Today’s piece is not a chart, nor is it some complicated piece of data visualisation. Instead, we are looking at a piece from Medium that attempts to explain the disappearing Polish S. Basically, it is a roundabout way of saying that it is very difficult to type in foreign languages on American keyboards because of the additional letters and/or diacritics. If you are at all interested in typography, the article makes nice use of comparative photographs and highlighted colours in the alphabet to illustrate its case.
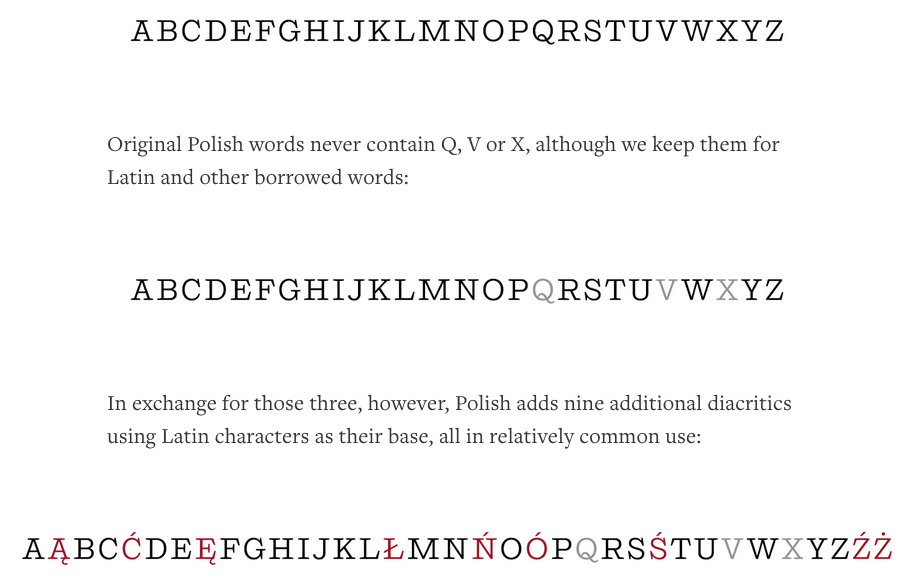
Credit for the piece goes to Marcin Wichary.
Massimo Vignelli died yesterday at the age of 83. Fastco has a much better article than I think I could read, this image is from their piece but is of Vignelli’s transit map for New York. I wrote about an interactive piece several years back that allowed you to compare Vignelli’s map to the new system map for the MTA.

Credit for the piece goes to Massimo Vignelli.
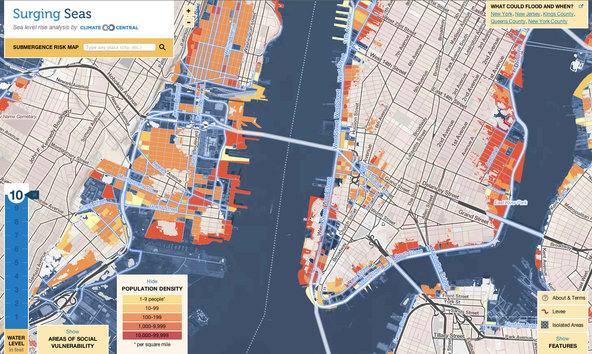
Okay, we have all watched enough science fiction to know that there is not one future, but multiple futures. All options existing as if taken in parallel universes. Today’s post is not about a specific graphic, but rather a short article in the New York Times examining data visualisation. Through the work of Eric Rodenbeck of Stamen Design, it looks at how we may need to change our current vocabulary, if you will. Naturally the article offers a counterpoint nearer the end about how older forms are still useful.
Where do you fall?
This small graphic is one of several from a very smart piece on redesigning the traffic map. Have you ever looked at a Google or an Apple traffic map to find the quickest route home or to get an idea of how long it will take you to get to the ballpark? According to Josh Stevens, your traffic map is lying to you.

The article is a summary or overview of a research paper not-yet-published. When you have a few moments, the whole thing is worth the read for its analysis of popular transit map designs and the five big lies.
Credit for the piece goes to Josh Stevens.
Today is the odd day where I don’t have an actual graphic to share, but rather one of those abstract theory wishy washy brainheady thinky things. It’s an article in Fast Co. that discusses an essay written by Kim Rees and Dino Citraro wherein they define the concept of digital poster. Think big, vertical, scrolly infographics.
Happy Friday, everyone. Today’s post comes via colleagues of mine in London, who shared with me the Guardian’s selection of 16 useless infographics. They are shit infographics. Well, at least one is. Check them out and you’ll understand.
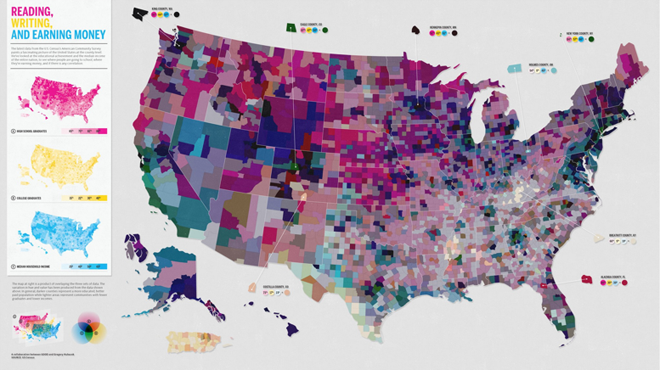
Credit for the selection goes to Mona Chalabi. Credit for each infographic belongs to the infographic’s respective designer.
Earlier this week, the Office of National Statistics in the United Kingdom released census results for England and Wales. (Northern Ireland and Scotland are reported separately.) England has more people than expected, most likely because of undercounting of immigrants, and Wales is now some three million and counting. There are fewer Christians than expected—and fewer Jedi than I expected—as the ranks of the non-religious grow. But from of course all of this comes a bevy of visualisations. These are but a few, but if anybody finds others worth nothing, please feel free to send them my way.
Straight from the source is a set of interactive mapping applications from ONS that compare 2001 data to 2011 data. As best it can, census districts are compared on a one-to-one basis, but with boundary changes that isn’t always possible. Clicking on district provides one with details about the responses for that area.
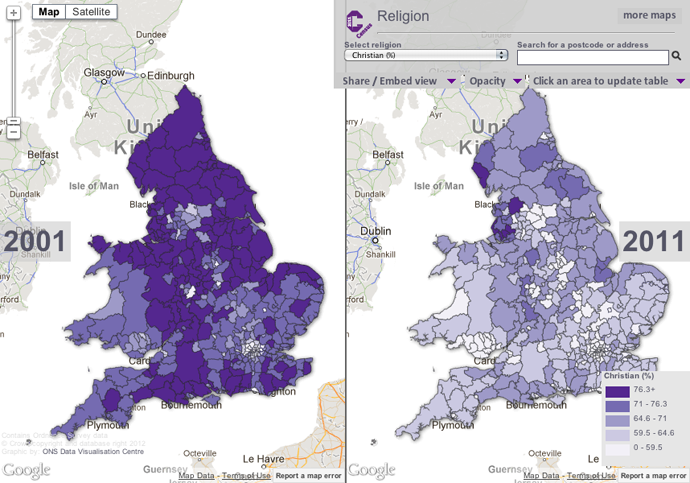
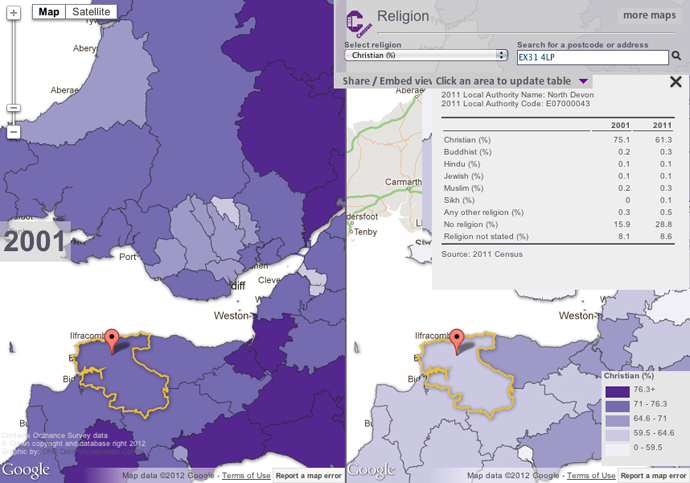
Perhaps the one thing missing from these—and it may well owe to the aforementioned boundary changes—is a map of changes to see which areas have been most impacted. Or a map of the results compared to the average to see where the average can be found and where the positive and negative extremes can be found.
An infographic from the Guardian looks at the overall dataset with quite a few maps and then circle-y things. While the large map is the white population in 2011, the remaining maps are before and after comparisons. Again, an interesting look would have been perhaps deviations from the average or of the actual change per district.
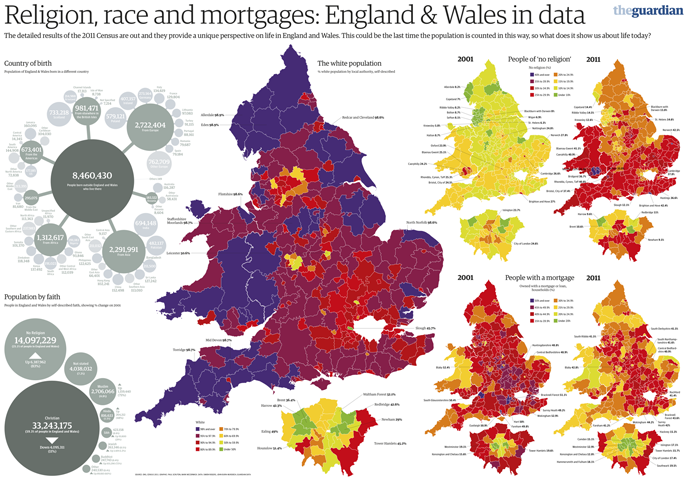
I appreciate the impact of the main story, the increasing diversity of England and, to a lesser extent, Wales. London in particular is now minority white. However, I am less keen on the circle-y things and that data could probably have been presented in a clearer, more direct fashion. I am not a fan of red, yellow, and green traffic light colours, but I also recognise that the Guardian is working within their brand on this.
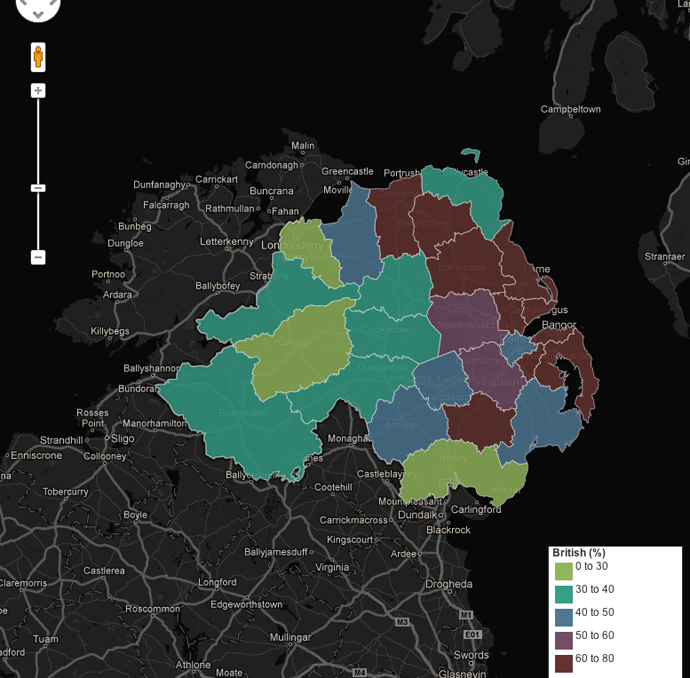
Unfortunately this interactive map of Northern Ireland’s national identity does not quite work for me. I appreciate the toggle between the different response options, however, I find the responses themselves hard to compare. The colours remain the same, but the scales for the results change. For those identifying as Northern Irish, the top value is clearly less than those identifying as either British or Irish. But I would have liked to have seen the scales for British and Irish to closer match. I also find the black background distracting and overwhelming the colours. I wonder how the result would have worked if treated with the above aesthetic.
The BBC took a stab too with a section devoted to the results. Unlike the ONS visualisation above, however, the side-by-side comparison is forced to be smaller with the included text. And when one zooms into a particular district, the map degrades into crude polygons—a particular pet peeve of mine—that would be unrecognisable to someone familiar with the intimate geographic details of their home region. (Yes, simple shapes make the files smaller for overview maps, but when seen up-close, they lose their value by making ugly maps.) Also, the colours and bins in this particular view are not as informative as in the view above.
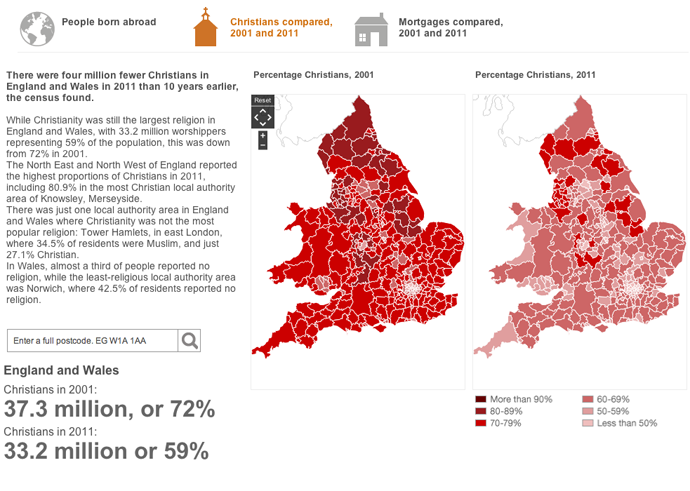
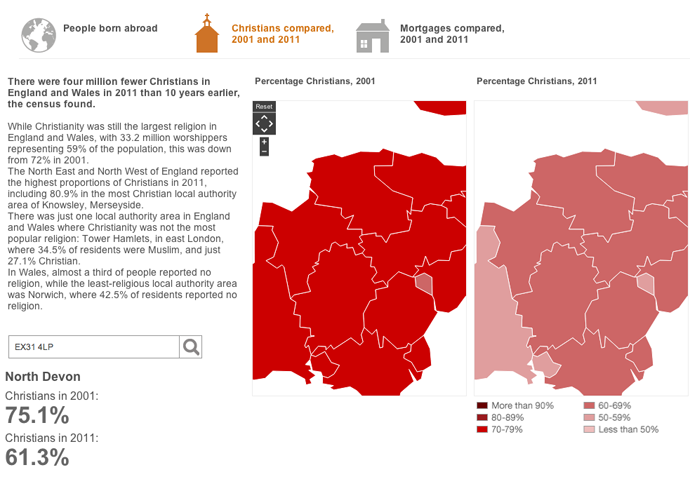
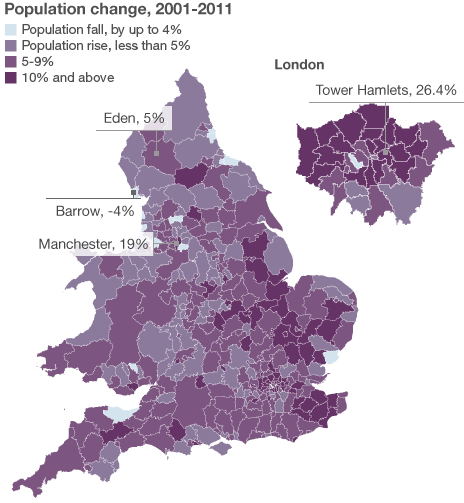
The BBC, however, did create a small graphic for an article that showed population changes in the districts, alas the colours did not work as well as one would hope.
That’s a lot for people to digest, but, overall I think the clearest visualisations go to the ONS. They lack the commentary that can be brought by journalism organisations, e.g. the BBC, but one needs a clear and powerful visualisation before one can start writing an analysis.
Credit for the ONS results goes to the ONS Data Visualisation Centre, for the Guardian infographic credit goes to Paul Scruton and Mark McCormick, for the Northern Ireland piece credit goes to John Burn-Murdoch, and credit for the BBC goes to the BBC.
I make a lot of maps in my line of work. Often times, they are not particularly interesting. Mostly because they follow similar patterns to this. More stuff is bought and sold where there are more people. More stuff is bought and sold where more people have more money. Et cetera, et cetera.

Maps are sometimes very useful. But I have a saying when people ask for a map of some kind of data tied to geographies: Maps are not silver bullets. That is to say, just because you throw data about countries, states, or counties onto a map does not mean you are going to see anything worthwhile let alone new or unexpected.
Credit for the XKCD piece goes to Randall Munroe
Mitt Romney lost badly last night. No way around that. But as I watched the results come in through various sources, I noticed two interesting design decisions that made me think; one from the Guardian (the British perspective), and the other from the New York Times.
Using only Colorado as an example, here is the map of county results by the Guardian.
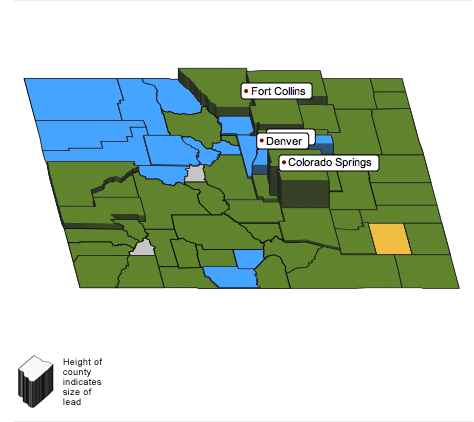
Note how the map is presented in 3-D that therefore allows the use of height as another encoded variable, in this case the size of the lead. Now compare that to the map used by the New York Times.
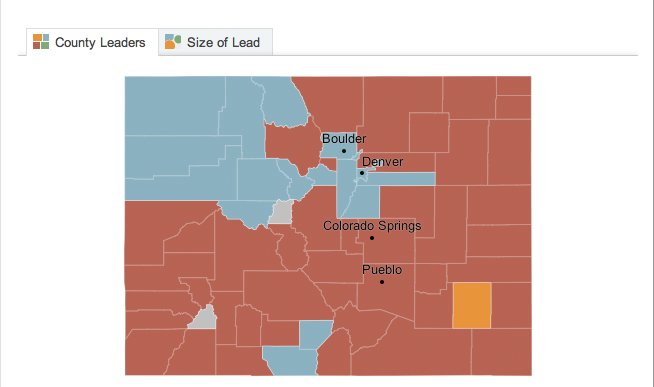
Note how this map is flat. So much less cool, right? But try to compare the results in Denver County. When I look at the Times’ map, I see blue; Mitt Romney won. When I look at the Guardian’s map, I see…actually, I can’t. That label is in the way. And then even when I begin to interact with the map, Denver County is hidden by the height of Arapahoe County.
But what about the size of the lead? I cannot see that encoded in the New York Times map. No, one cannot. However, they added a toggle function to change the data displayed on the map—though the utility of that view can be left for another discussion.
And now to a minor point about comparing the totals.
Again, a look at the Guardian’s presentation.

And now the New York Times. Numbers are numbers and faces are faces. But look at the graphic element representing the percentage. With the Guardian, I can just barely discern that the size of the circles for Santorum and Romney are not the same. And the same goes for Gingrich and Paul. But when I look at the Times’ presentation, I see a simple bar chart that more clearly shows the relationships between the results.

So interesting design decisions lead to one view that I find far more successful in showing the data: the New York Times.