Maps Made by Hand (Or Simulations Thereof)

Le Monde is a French-language publication and so I never really bother with it, despite favourable reviews. However, they do have a small site with some content in the English language that I check from time to time. Frequently they have maps or other graphics of some interest, and this time upon visiting—done to see if they have anything on Libya given the lead taken by France and the UK—they had a few maps of the situation in North Africa.
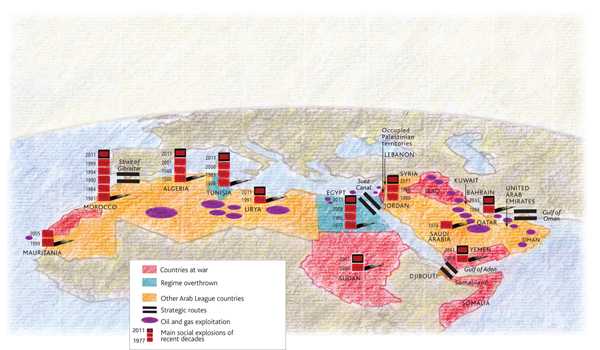
Political Situation in North Africa and the Middle East

By and large, nothing radical or ground-breaking in the maps. But, the designer, Philippe Rekacewicz, used a different cartographic perspective than I am at least accustomed to seeing for infographics. And then the aesthetic of the map is interesting, and quite different than what one typically sees. In a refreshingly interesting way. Now, whether he used a texture or filter in Photoshop to create the background map or whether he physically drew the map (and then overlaid the informational elements digitally), it matters little as the style works. I enjoy the idea of mixing the hand-made and data visualisation—though it needs to be well-executed.

He created a few sets of maps; each makes use of a slightly different palette. These certainly help create the visual distinction necessary between data sets. The pie charts are not particularly helpful, but they at least are kept simple: looking at only two parts of the whole. The comparison within each nation by bar charts of internet connectivity and higher-education learning works. It begins to work not so well as one tries to compare country to country. Though, the separation of the bars into ten-percentage point sub-bars begins to alleviate that issue. The main map, that highlights the political situation does a nice job of putting these countries into broader context. That is, who has oil and who has control over the key waterways in the region.

the three smaller maps

All in all, a refreshing set of maps that illustrate the fluid situation in North Africa and the Middle East.

Complex Nigeria

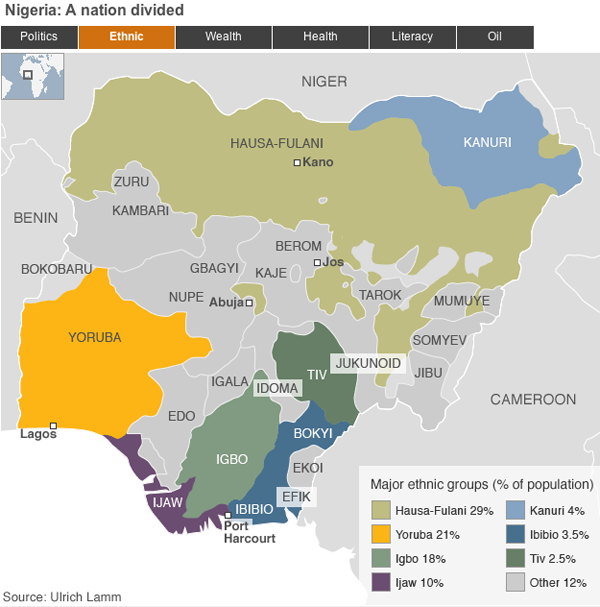
The BBC has a new feature on Nigeria, one of Africa’s most important—and most complicated—countries. And a few days ago it was supposed to hold elections. But these have been postponed, apparently on logistical problems. This piece attempts to explain the complexities of modern Nigeria across several different metrics via maps. Overall, it is very similar to a piece I mentioned that the BBC ran on South Sudan in the run up to that soon-to-be-country’s independence referendum.

Map of Nigeria by Various Metrics

Overall, the piece works for me as a means of quickly and broadly explaining the geographic breakdown of Nigeria in terms of ethnicity, politics, health, et cetera. The colours work, especially shifting between hues for the one-variable maps. The one thing that the Nigeria map adds over the Sudan map is the name of each state. However, these begin to become a bit cluttered and distracting—not to mention that in all-caps they sit at roughly the same level of the neighbouring country names despite being a touch smaller. Perhaps the maps could have been made to do more with less, and only label those states mentioned in the explanatory text. Or they could have been included but treated in a subtler fashion.

iPads on eBay

This post comes to us from eBay via cnet. Ebay does a wonderful thing, it fills in the gaps in the marketplace. If you live in, say, the Netherlands, and want something that is available only in the United States, chances are you might find somebody willing to sell it to you from the US.

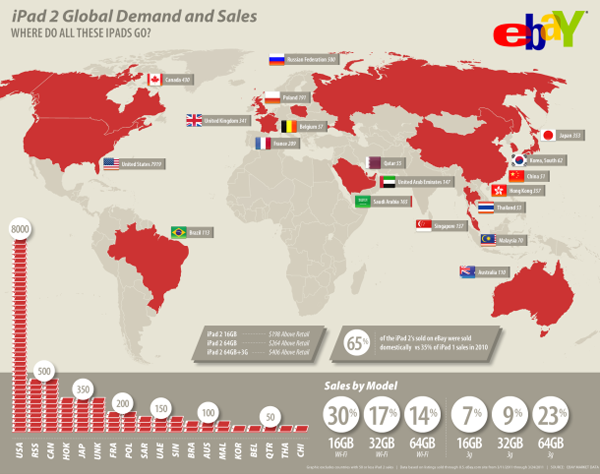
Among those things that people want are iPad 2s. So here eBay has put together an infographic about their sales of iPad 2s from US sellers to foreign buyers.

sales of iPad 2s abroad

I must admit to being a bit underwhelmed here. Maps are great and all, but here this map adds nothing to the story except that I can now identify where Poland is. It’s an island country north of Belgium. Or is that France? Wait, what is this lonely sticker-tag for the United Kingdom out in the Atlantic? The data encoded in the map is already present in the datagraphic, if you look to the bar chart of iPad shapes in the lower left quadrant.

But the bar charts do confuse me, I very rarely like using symbols of things for measuring precise numbers of things when those symbols of things represent a number of things more than just one thing. (And that is about as confused as I feel.) And then on another level, I have to strain for a moment to figure out what these three-letter identifiers are. As it just so happens, there is a standardised set of country abbreviations in both two and three letters. When I see UNK, I immediately think Unknown. And RSS makes me think of RSS feeds. Neither connects me to the United Kingdom or Russia.

In the bottom right is the breakdown of sales by model type. Here, where the treatment is simpler we see more success at clearly communicating the information. Could it be more succinct and a touch better organised, yes. But, in all, this is clear and effective. Ergo, it works.

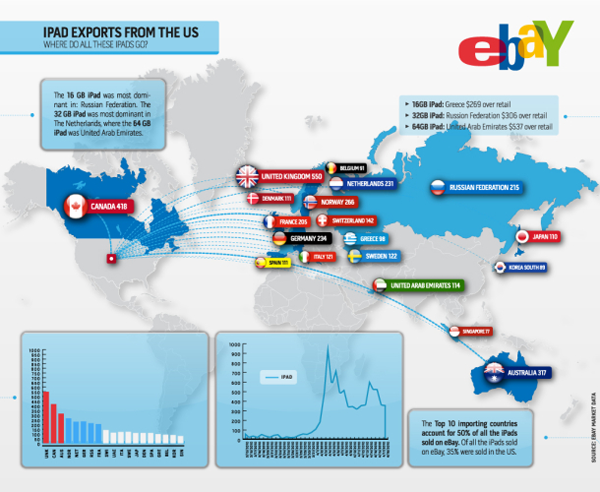
Interestingly, cnet also posted the previous year’s infographic by eBay for sales of the first iPad.

sales of the iPad abroad
sales of iPads abroad

Very loosely (and quickly), I think it is more successful and tells more data. The data on the map, like this year’s, need not be communicated by a map, that much is true—why are the countries two shades of blue, I have no idea if that encodes data. However, the same data is also duplicated in the chart in the lower left quadrant, but here far more succinctly and far more accurately than by weird symbols of the iPad. Last year’s infographic is missing the breakdown by model type, however, instead of those six datapoints, here we have a timeline of iPad sales that, it is safe to say, references more than six datapoints.

In a sense, eBay took a step backwards in their infographics. A pity, because one imagines that if they have the sales data for time periods, they probably have other sets of data that would make for an interesting and richer piece.

Credit to the designers at eBay and cnet for posting the article.

Having Your (Presidential Birthday) Cake and Eating It Too

Presidents’ Day originally celebrated the birthday of George Washington, the first president of the United States. (Though, one could get crazy and say it was actually Samuel Huntington, but I fear I would digress.) Now technically the holiday still does celebrate Washington as the official name of the federal holiday is Washington’s Birthday, but by and large we group folks like Lincoln in there too.

Regardless of who exactly is remembered, we remember a United States of the 18th and 19th centuries. And thus it seems appropriate to share a piece from Charles Blow over at the New York Times.

United States' Ranking

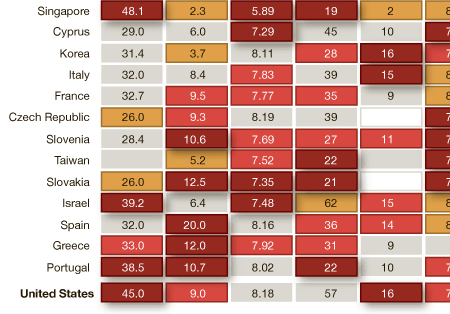
The information graphic is a heat chart of various rankings and index numbers that compare the United States across various metrics to the rest of the world’s “advanced economies”, as decided by the IMF. I certainly have some issues with a few of the metrics, for example what exactly does Gallup mean by percentage of people thriving? And are the math and science scales out of 600 total points? I presume as much but cannot be certain. These could have briefly explained in the footer, or similar to how the food insecurity metric is handled—though I suspect that would be too much from an aesthetic standpoint. The use of drop shadows, from a design perspective, I disagree with; the dark crimson should surely be enough distinction to stand alone. And for completeness, I would have included what appears to be the beigish middle ground between the best and the worst in the scale at the top of the piece.

As to the story the piece supports, I leave that for the audience to decide. Is the United States of the President Obama/Bush as great as that of President Washington/Adams?

If Money Grew on Trees…

I would have become an arborist…alas, I am a mere designer in a world where trees shed leaves, not cash. The government, on the other hand, now that sheds a lot of cash.

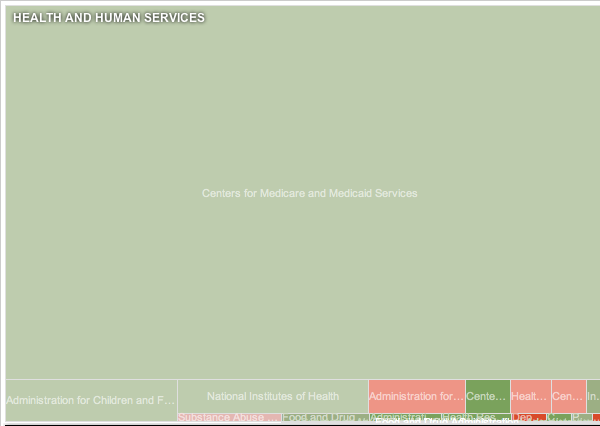
President Obama released his budget proposal for 2012, proposal because the responsibility actually falls to the House of Representatives to pass spending bills and budgets. The New York Times, crediting Shan Carter and Amanda Cox, has put together a nice little interactive piece explaining the proposal. (It would be rather interesting to see if they compare the proposal to the passed budget, whenever that happens.)

Cropping of the US Budget for 2012 (Proposed)

From one side of the aisle we hear arguments about how we must cut spending from things like education and infrastructure while the other side pushes back. However, what this piece does quite nicely is allow the user to isolate mandatory spending. That is, we see that if we really wanted to cut spending, we would need to look at reforming Medicare, Medicaid and Social Security and then cutting the Defense Department budget. At last, something on which we see bipartisan agreement, reforming and cutting those budgets is too tough (read likely to cost representatives, senators, and presidents their jobs) and so they are left alone. But, I digress.

Furthermore, the piece adds the change in spending since 2010 for the various programs by way of greens and reds. While certainly not necessary—one could argue that the inclusion of such data makes a sometimes difficult chart type that much more difficult—I think that in this case the additional data is more than worthwhile. This year’s theme seems to be austerity and that means cuts. So while highlighting, say, the massive portion of government spending that is Medicare, Medicaid, and the US military we can also highlight that much of all that spending is still rising.