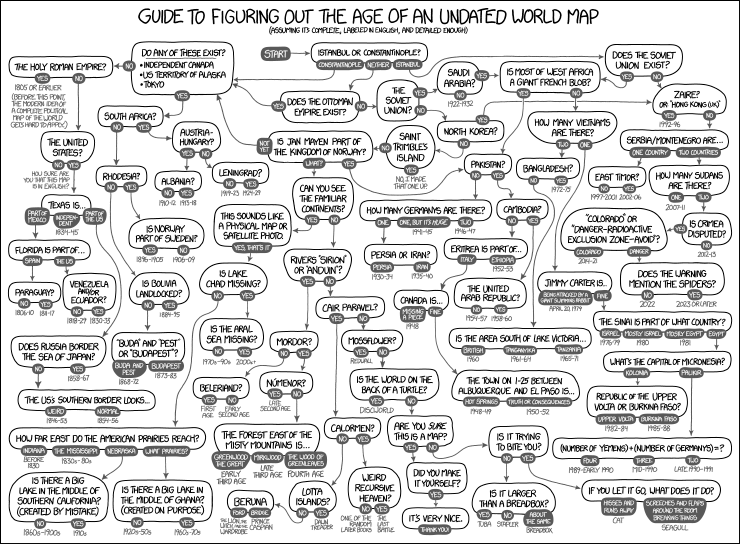
Don’t you just hate it when you stumble upon a map, but you cannot place the time period of the geographies? Well if you haven’t, who cares, because xkcd has a great flowchart to help you anyway.
Credit for the piece goes to Randall Munroe.
Don’t you just hate it when you stumble upon a map, but you cannot place the time period of the geographies? Well if you haven’t, who cares, because xkcd has a great flowchart to help you anyway.

Credit for the piece goes to Randall Munroe.
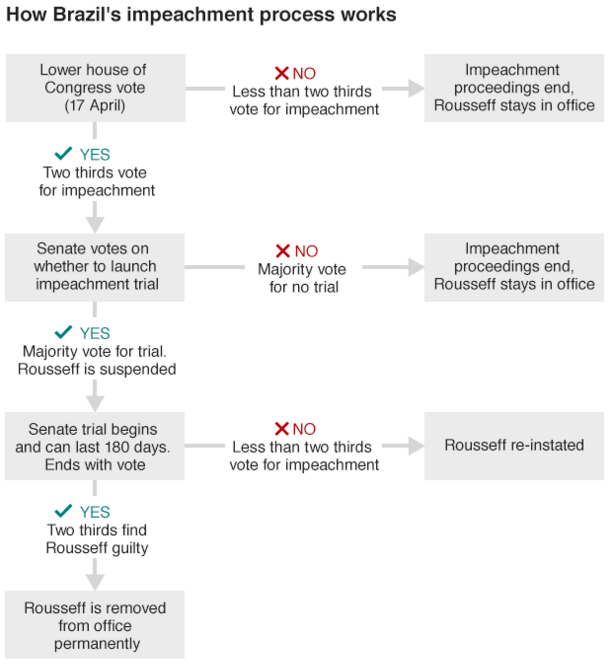
Who is Rousseff? She is the president of Brazil and both she and her government are currently mired in a corruption scandal. Yesterday a parliamentary committee voted in favour of proceeding with impeachment, the first step in a lengthy process. What is that process? Thankfully, we have a BBC graphic to explain it all.
Credit for the piece goes to the BBC graphics department.
Well, I mean trying to is this piece by the Washington Post. Included are several diagrams at key phases of the conflict that attempt to show how the various parties interacted with each other.
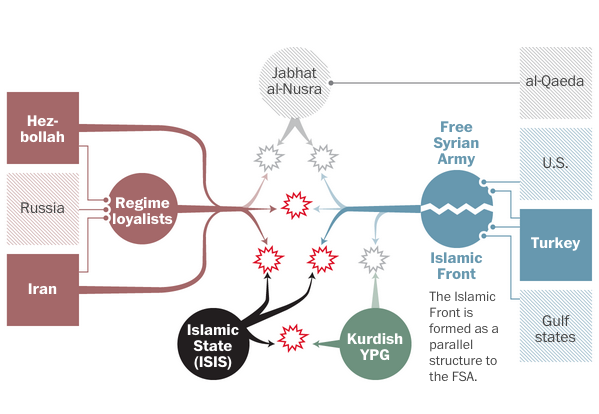
Ultimately the key takeaway is that Syria is a mess and it is not getting any better. So let’s just add some more lines in there, am I right?
Credit for the piece goes to Denise Lu and Gene Thorp.
The Christmas holidays are known for many things. One of them is the office holiday party. Today’s post looks at a flow chart put together by the company for which I work, Euromonitor International. As it was put together by the design team, you might very well think that I had something to do with it. But I couldn’t possibly comment.

Credit for the piece goes to the Euromonitor design team.
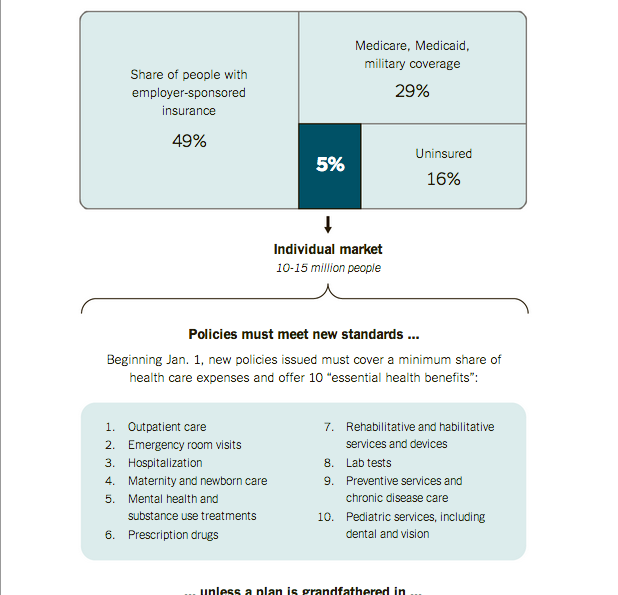
I have received a few questions in the non-blog world about why certain people have been receiving notices in the post that they are about to lose their insurance plans. The short answer for many of those people is that they likely bought individual, private plans and those plans fall short of the new minimum requirements. But, if you are not satisfied with that explanation, the New York Times does a much better job explaining it than I ever could. It is a piece worth a quick read.
Credit for the piece goes to Larry Buchanan, Alicia Parlapiano, and Karen Yourish.
I am not terribly familiar with local politics outside of my local areas. So the background and details of this piece escape me. However, this interactive graphic and story from the Los Angeles Times does a really great job of leading the reader through the story.
First, the piece starts with a general overview or flowchart of the network of connections. Mouseovers do a fine job of highlighting and filtering for the appropriate piece. For example, a person shows the entities to which he is connected whereas the entities show the people to which it is connected.
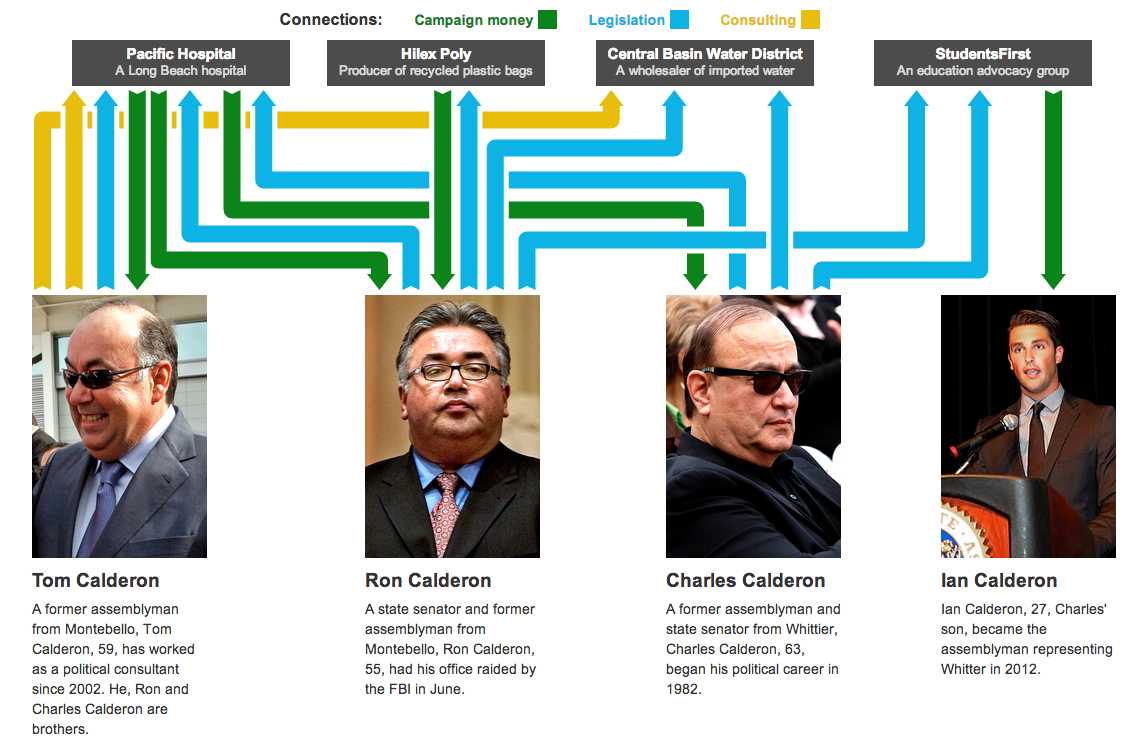
Secondly, the piece then goes in detail about the different connections. The example screenshot below shows how each story is highlighted by a red dot as the user scrolls down the page. When that story is highlighted, the network diagram to the left changes, either replacing the contacts or highlighting the contacts specifically noted in the story.
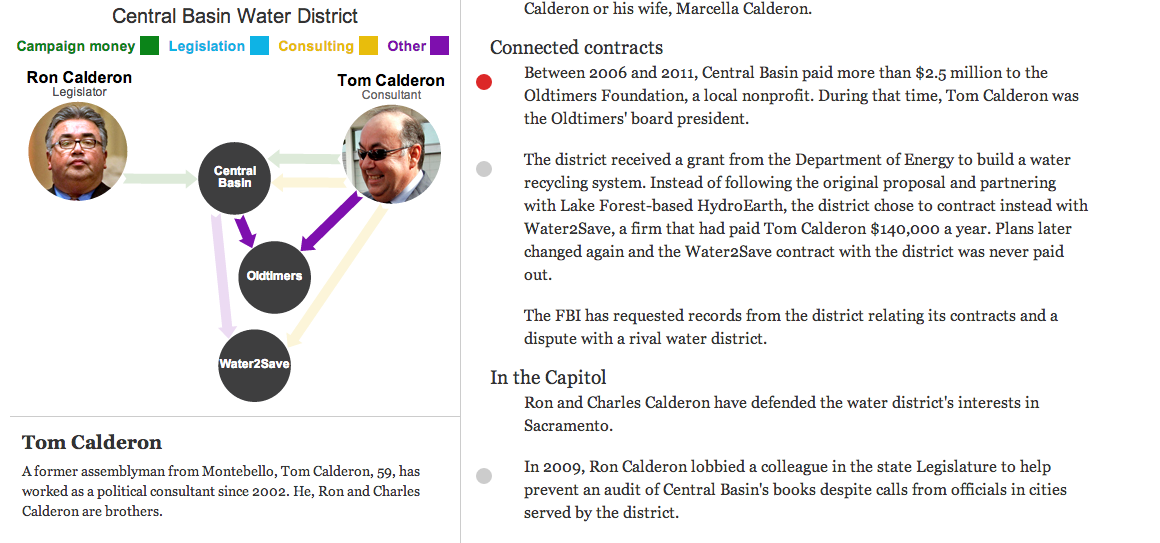
As I said at the outset, this is a very nice piece that step-by-step shows and explains how all the connections work while filtering out the momentarily irrelevant data. Very well done.
Credit for the piece goes to Byron Lutz.
In the interests of transparency and full disclosure, for my employer I design interactive web-based applications that display significant amounts of data on various countries and industries—along with other design things. So I am always curious to see how others handle similar types and quantities of data. This interactive application—I hesitate to call something like this an interactive infographic because of its scale and scope—comes from the Global Economic Dynamics project.

I commend the designers for opting not to use a map despite the nature of a dataset that focuses on countries. Especially in this application, where the full pattern of trade or migration would only be visible through multiple clicks to load maps of export/import markets of a particular country.
The user can add multiple countries, switch to a different dataset, change the year of the displayed data, currency, metrics, &c. There is quite a bit going on in this application and the controls are carefully placed in the margins of the piece.
And while I could probably write a lot more about this piece, I will end up the ability to share any insights made while using this application. Because what is the value of a kernel of knowledge if you cannot share it? Consequently, this piece offers a multitude of options. The usual social media options are present. You can also download a .png for use in a presentation, e.g. PowerPoint, or you can download the data. But fascinatingly, the application allows you to embed the piece into your own site.
Unfortunately, I cannot find any specific designers attached to the project. So credit goes to the Global Economic Dynamics project.
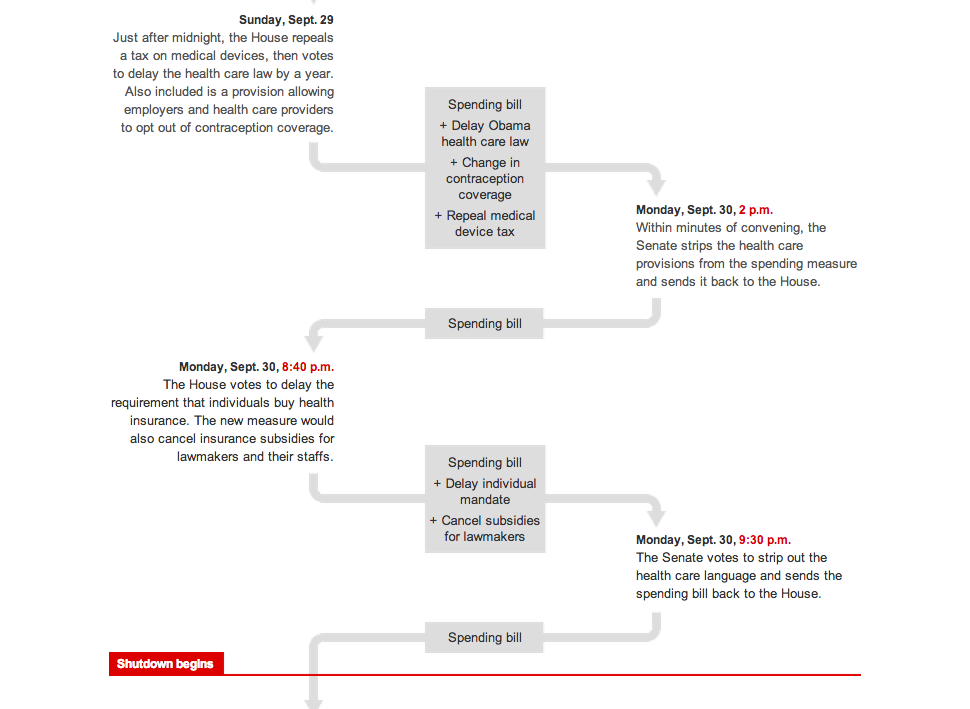
So the House Republicans’ Tea Party wing added several different non-budget riders centred around the Affordable Care Act (which they have labelled Obamacare) to the budget. And then the whole House Republican caucus passed it despite threats of immediate vetoes from both the Democratic Senate and the White House. The House Republicans have shut down the US government because of their refusal to remove non-budget legislation from the budget. This after the Affordable Care Act was deemed to be constitutional. After 42 separate votes on scrapping it. After the 2012 elections where the Democrats, who ran on keeping the Affordable Care Act, won more votes than Republicans, who ran on scrapping it. But, it gets even more zany than that as this fantastic infographic shows the pinball-like refusal of the Tea Party to remove the Affordable Care Act knowing well in advance that the Senate Democrats were not going to allow the rider.
Credit for the piece goes to Karen Yourish and Archie Tse.
Today’s Friday. So maybe at this point, after a week of baseball-related posts, you are ready to go see a game yourself. If you go, here is a flow chart from SB Nation to help you choose your foods and drinks for the game.

Credit for the piece goes to Eric Wayne.
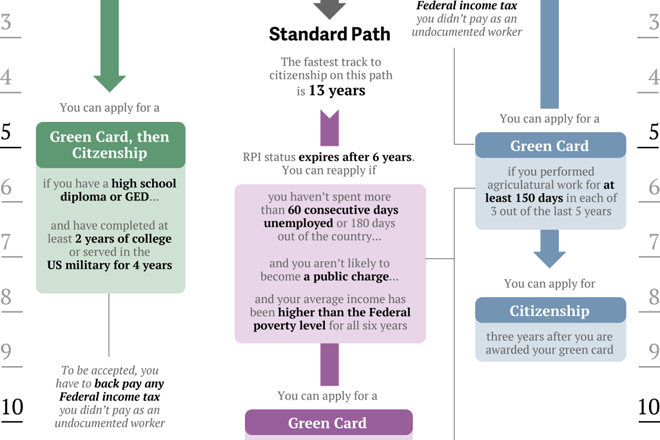
Last week several important stories were drowned out by the bombings in Boston. One of those stories was that a group of senators agreed on a compromise immigration bill that would offer undocumented workers in the United States definite plans to citizenship. Of course now that we know the suspects in the Boston bombings were legal, documented immigrants—one of whom was a naturalised citizen—the immigration debate might take on an entirely different character.
Here is a cropping from a graphic put together by Quartz that explains how the different paths work.
Credit for the piece goes to Ritchie King.