Adding Guided Context to Maps

Maps are cool. They show the geographic distribution of data. And that is fantastic if there is a story in said distribution. But even if there is a story, sometimes given both the scale of the map and the amount of data encoded in the map, how could you possibly expect to find the story? Which little region of the map do you search to find the interesting nuggets?

On Sunday, the New York Times published an interesting solution to that very quandary. The context is an article looking at the anger and resentment felt by some towards government assistance via the social safety net, and yet how these very same people depend upon that safety net through programmes like Social Security, Medicare, Medicaid, &c. The map, a choropleth, examines several different metrics that comprise government assistance, e.g. Medicaid payments as a percentage of income.
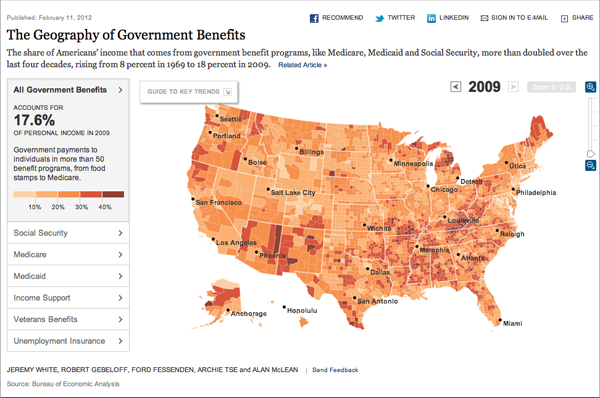
Government benefits overview

One can easily toggle through the various metrics at the scale of the entire United States. This is a rather standard feature for such maps. However, in the upper-left corner, the designers placed a ‘guide’ that provides context and stories for each metric. But, not only does the guide provide text to support the map, but it zooms in on specific areas and regions that then support the text and best exemplify the point.

Here we see the map of the whole US for Medicaid, which appears to be scattered pockets of higher percentages. Interesting perhaps, but the user likely has few ideas as to what that visualisation actually means.
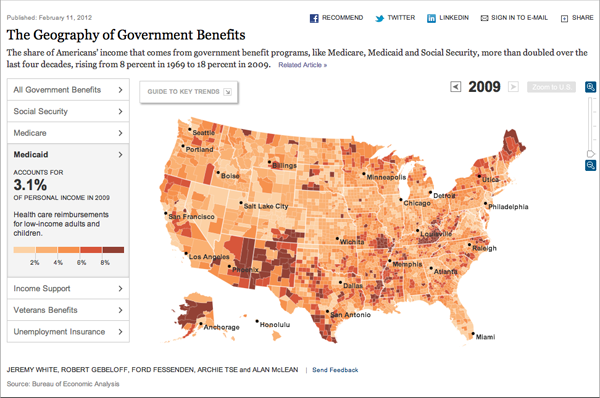
Medicaid's broad overview

Compare that to the guide’s view of the map, which focuses on the large cities on the East Coast.
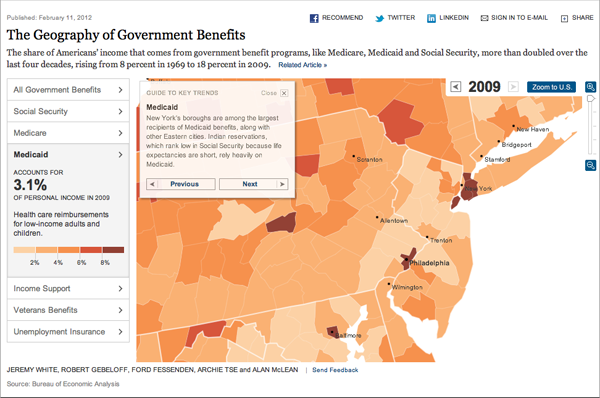
Medicaid's eastern core context

Providing context and guiding a reader/user through the stories contained in the map, or at least those deemed interesting by the designers and editors, is an interesting solution to the problem of finding the story in maps such as these. However, by moving away from a strict visualisation of the data, the New York Times and others that try similar avenues introduce human biases in the story-telling that may otherwise be unwanted or distracting.

Credit for the piece goes to Jeremy White, Robert Gebeloff, Ford Fessenden, Archie Tse and Alan McLean.

How to Use Good Data Visualisation in Your Private Life

Often we think of graphs, charts, and other forms of data visualisation as a means to exploring the economic growth of so and so, or visualising traffic patterns, of explaining the complexities of science, or the reporting of yesterday’s news. But, we can all use data visualisation in our own lives to help make better decisions.

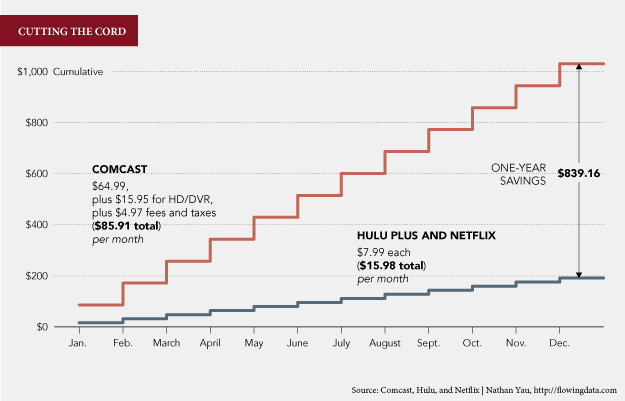
While I normally opt not to post links to other data visualisation blogs—I figure most people are also already checking those out—Nathan Yau posted about why he wants to cut the cable, i.e. lose his cable television subscription. He has two separate charts that are simple but effective in driving home the point that he really ought to think about cutting cable out.

Cutting cable
Cutting cable

The article, while a bit longer than usual, is well worth the read. The charts with the explanation make for a compelling argument.

Housing Prices Fall Some More

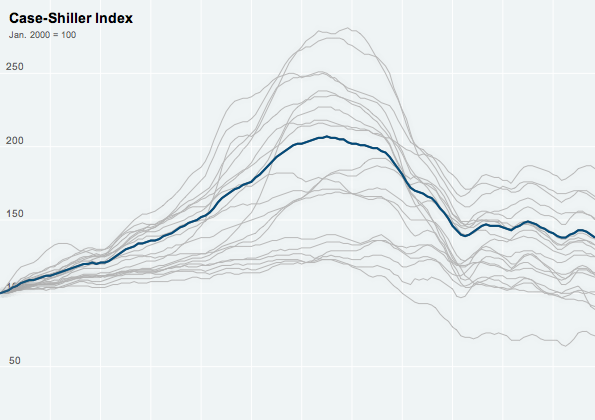
Houses are meant to be lived in. Which is good to know if you’re a real estate investor because the housing market in the US is still not so good. According to an article in the New York Times, we’re back to 2003 levels (on average of course) for single-family homes.

Accompanying the article is an interactive chart that lets users view the full breadth of the survey while highlighting specific markets of interest and showing actual values along the length of the chart.

The Case-Shiller Index for Housing Prices

Credit for the piece goes to Kevin Quealy and Jeremy White.

Florida Primary

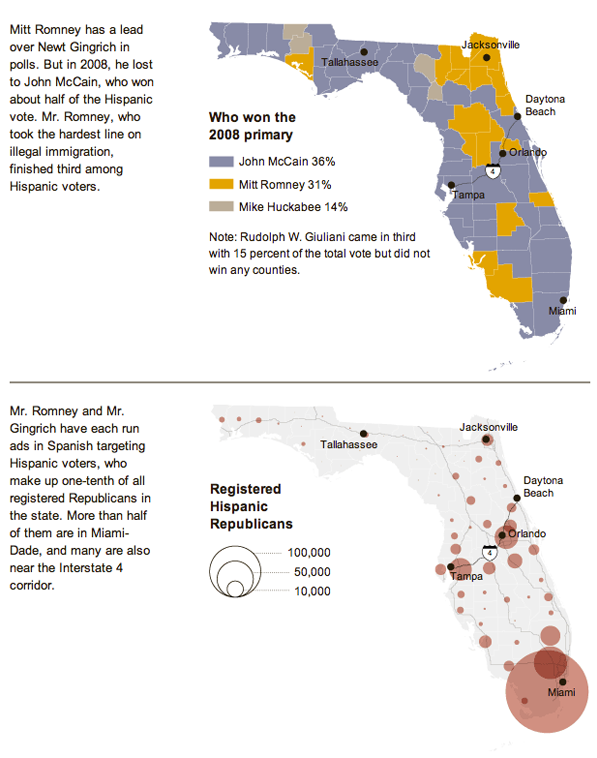
The Republican primaries…they’re still going on…on the long inevitable road to Romney’s coronation. Next up is Florida, always an interesting state to watch. There are a lot of people there with a whole host of interesting demographic slices. Perhaps one of the most interesting ones, at least to the media, is the Hispanic vote. Other things to look at in Florida include the burst housing bubble and rather high unemployment.

The New York Times published a graphic with a few maps and charts trying to paint the landscape of the Florida primary battle. These two selections below show which Republican primary candidates won which counties in 2008 as well as the size of the Hispanic population registered Republican.

Florida primary landscape

Credit for the piece goes to Haeyoun Park.

Apple And Its Suppliers

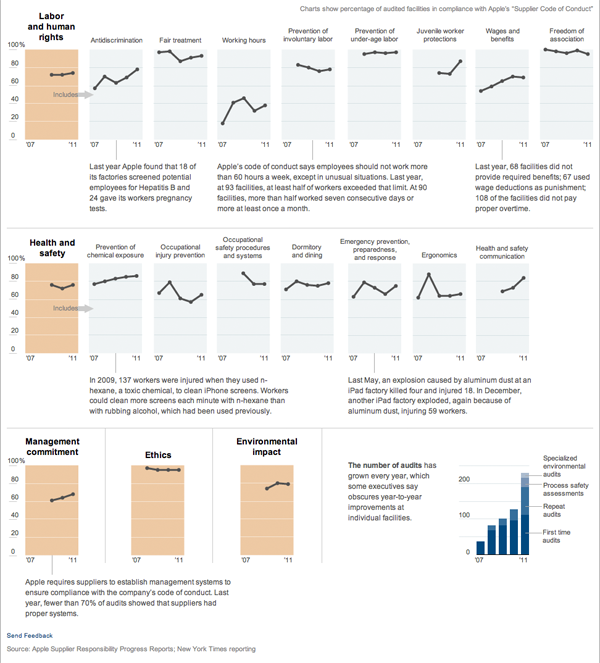
American companies have long been moving their manufacturing overseas. Apple is no exception. However, Apple does audit its suppliers to ensure they are in compliance with the company’s code of conduct. The New York Times reported on this and included a graphic along with its article.

Apple Audits Its Suppliers

We have small multiples of line charts with small blurbs of text to highlight key stories. Clean, clear, and communicative. I contrast this with the number of charts one might see in business presentations, which presumably would have similar content in terms of audits and performance for a company, where these lines would normally be smashed together into one chart. At that point lines become indistinguishable from each other and the individual stories are missed among a muddle of a main story. Furthermore, in my experience, a business presentation would make full use of the width of the medium, in this case some 900 pixels or so. And for this story in particular that would mean, at most, by my count, 900 pixels for 5 plotted points in a timeline.

Seeing work like this is refreshing.

The Rise of Newt

The Iowa caucuses are quickly approaching. And that means for many candidates a scramble to gain as many supporters as possible and then convert their poll ratings into votes. For the Republicans, this has been a truly topsy-turvy cycle with the distant refrain of “anyone but Mitt” echoing in the background.

So, here we are looking at the return of Newt Gingrich. Over the weekend, the New York Times published a graphic comprised of small multiples of poll numbers for the various candidates. Each chart plots the individual polls and then the moving average.

The rise of Newt Gingrich

What one can clearly see is a moving wave of discontent. It begins small with Michelle Bachmann before rising with the arrival of Rick Perry. He floundered, however, and was soon overtaken by Herman Cain. And as his support ebbed, it buoyed Gingrich to the top or near-top, depending on the poll, of the Republican candidates.

All in all, a good series of charts that tells a convincing story rather quickly and succinctly.

The Finances of Social Security

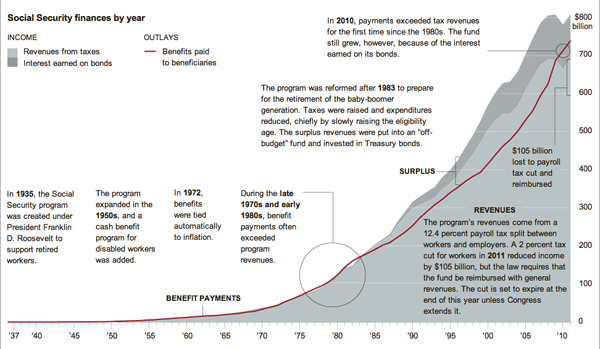
Simple graphs can tell great stories with little annotations. This graphic by the New York Times illustrates that point well with a stacked line chart set behind a line on the same scale. The two should match, or at least the red should be beneath the greys. When they don’t, you have a story and the Times calls it out.

Social Security Revenue vs. Expenditure