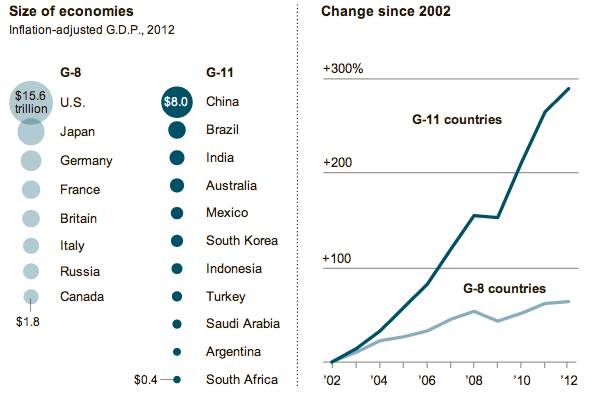
On Sunday the New York Times featured a small graphic highlighting the disparity in growth rates across the G-20 if broken into the ‘core’ G-8 and then what one might call the emerging markets of the G-11.

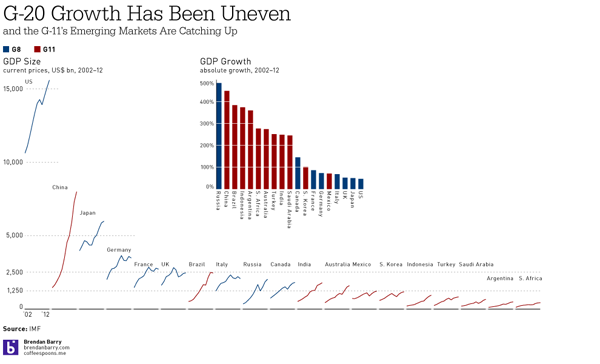
The charts are small yet compelling in telling the story of how the two different groups are performing. However, I was left wanting to better understand the comparisons between the sizes and growth of the various countries. The areas of circles are difficult to compare and aggregates mask interesting outliers. So, using what I imagine to be the same data from the IMF, I took a quick try at the data to create my own infographic.

Indeed, interesting stories began to appear as I plotted the data. Russia is a member of the G-8, but perhaps has more in common with the G-11. After all, Russia’s growth was nearly 500%. Similarly interesting were Canada and Australia. The former, a G-8 country, was the only G-8 country besides Russia to have greater than 100% growth. And Australia, certainly not an emerging market in most senses, experienced nearly 300% growth. Whereas the emerging markets of Mexico and South Korea lag behind the rest of the G-11.
Then, when plotting the sizes of the economies, China was no surprise as the second-largest economy. However, that Brazil has managed to already surpass the G-8 economies of Italy, Russia, and Canada was a bit shocking. And Brazil looks nearly ready to surpass the UK, but for its apparent recent downturn. Also interesting to note are the Financial Crisis dips in GDP across most countries. Some countries, like China, unsurprisingly did not suffer greatly. However, that Japan and South Africa kept on a steady pace of growth was unexpected.
All of that would have been missed but for a slightly deeper dive into the IMF data. And a few hours of my time.
