My/Your Dialect

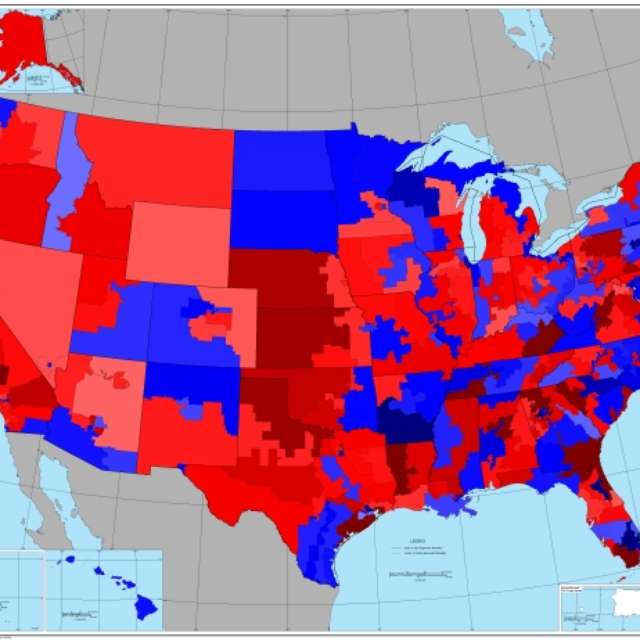
Joshua Katz from North Carolina State University has created an interactive version of the dialect survey maps first perhaps popularised several years ago. Katz has also created an interactive map that looks at a city’s dialect and maps its areas of similarity and difference. An interesting extension of the original survey data, however, is the ability to take the survey yourself and see where your dialect fits. There are two versions, a 25-question survey and a 140-question survey.

The screenshot below is my result from the 25-question version. And it fits me fairly well since I spent most of my years in the suburbs of Philadelphia but every summer in South Jersey (and quite a bit of time in Allentown). Click the map to take the quiz for yourself. Feel free to reply and share your results.
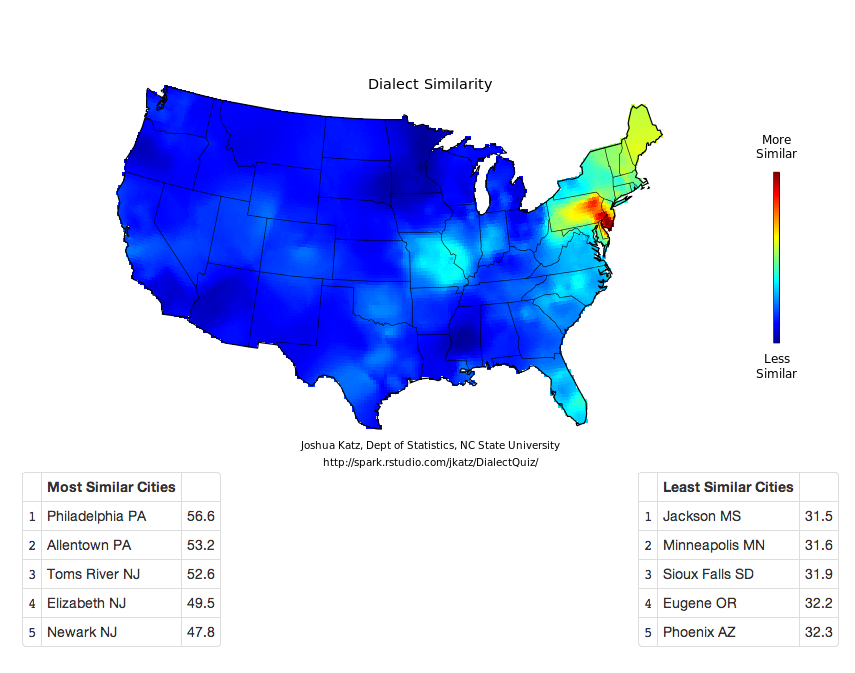
Clearly I am Philadelphia raised

From the technical side, for those wondering, this is a piece that is done in Shiny, the interactive version of R.

Credit for the piece goes to Joshua Katz.

The Best and Worst States for [Insert Topic]

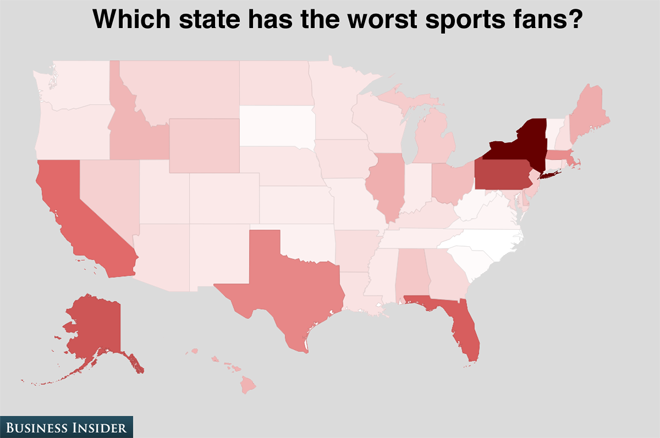
It’s Friday, and mercifully this is a Friday before a three-day weekend. (For all of those who, like me, have a day off coming up on Monday.) So before everyone starts travelling to places here and there and everywhere in between, you best check this series of maps. Why? Because Business Insider has polled us, well 1600 of us, to find the best and worst states for a number of metrics. My personal favourite:

“Most likely due to the fact that most Americans have never been to Philadelphia, the rest of the country believes New York also has the worst sports fans. I blame John Rocker.”

Worst sports fans
Worst sports fans

Credit for the piece goes to Walter Hickey.

Hong Kong and Hongkonger Identity

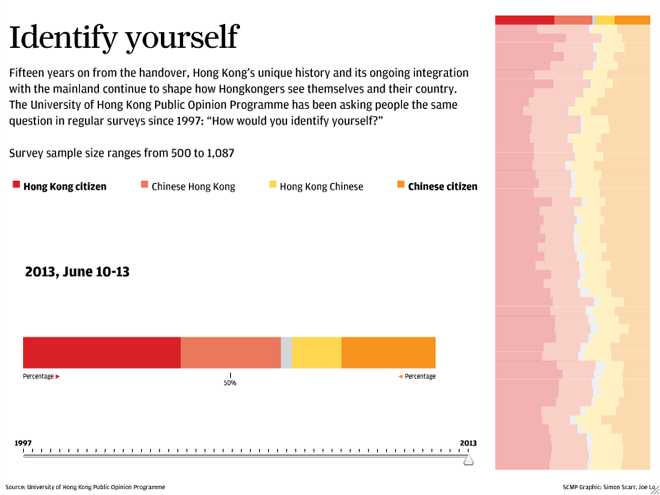
Hong Kong—and to a similar extent Macau—is part of China, but at times not so much. Because of the long history of British control through their colony, the people of Hong Kong, Hongkongers, are accustomed to a more liberal, democratic, and perhaps Western lifestyle than those of mainland China. Since the British handover, a local university has been asking the inevitable question of “Are you Hongkonger or Chinese?”. This interactive piece from the South China Morning Post looks at how that answer has evolved over nearly 20 years.

Hongkonger identity
Hongkonger identity

The piece presents a broad overview on the right with the specific survey results displayed larger on the left. Broadly speaking, the piece is successful. In particular, the decision to highlight the particular survey on the right brings that into focus without losing the context of the historical results. And providing a timeline beneath the larger stacked bar chart on the left offers a second means of choosing a survey of interest.

Yet I think the piece lacks two, perhaps three, elements that would improve the piece. First, sometimes I like to see the numbers for data visualisations. Adding a hover or mouseover state would help with that. Second, while the chart on the left includes a 50% line, I wonder if that would not also be helpful in the historical display on the right. Thirdly, and perhaps not too important for those not terribly interested in the data, the overall piece states the sample size for all surveys being within a range. People wanting more data on the survey responses might be interested in seeing the sample size per survey.

Credit for the piece goes to Simon Scarr and Joe Lo.

Office Space(s)

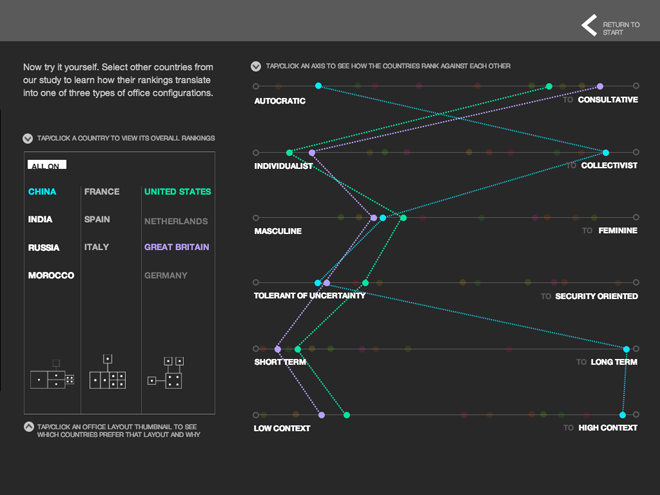
Today’s piece comes to me from my colleague Eileen. The Harvard Business Review published a report commissioned by Steelcase that looked at how different cultures prefer different office layouts, based upon different attitudes and traits exhibited by the people of different countries. That lead to three different types of spatial layouts.

But what is really nice is that the piece prompts you to start through an example or case study to see how the data works to shape the conclusion. You can of course skip to the data exploration mode, but that is not the default mode. But when you do arrive at the exploration area, you can click through different countries and see how their surveyed opinions plot against each other.

Cultural characteristics

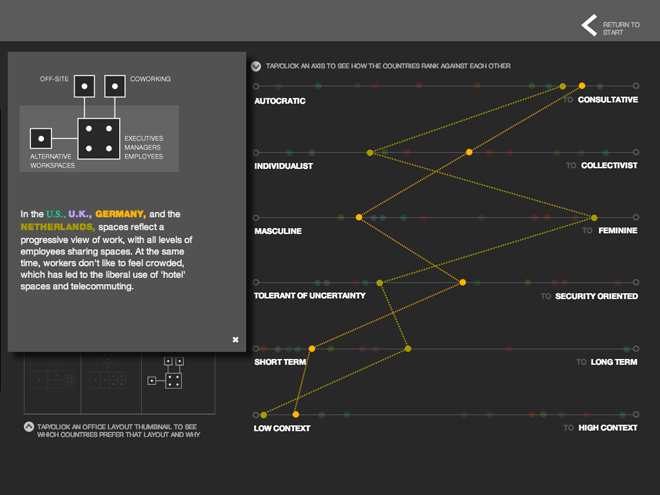
And if you want to understand more about the different layouts presented for each group of countries, you can click on the layout to bring up more information. This panel of information provides context and explains just how the general traits shared by those geographies leads to the preferred office space layout.

Explaining a layout
Explaining a layout

Credit for the piece goes to Christine Congdon and Catherine Gall.

The Muslim World

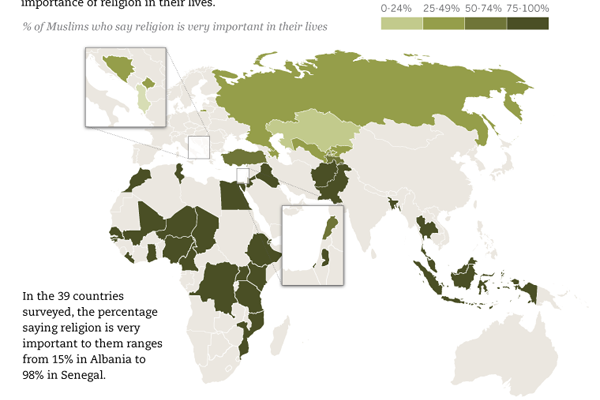
Today’s post comes via a co-worker of mine and is from the Pew Research Center’s Forum on Religion and Public Life. The infographic is of the long-running image type, but in this case is neatly sliced into digestible morsels of tasty infographic-ness. Below is a cropping of the longer piece. It looks at how Muslim populations in different countries feel about the importance of their religion in their daily life.

The Muslim World
The Muslim World

Let’s Talk About the Weather

Global warming is probably not the worst-branded concept out there, but it is not particularly effective. Mostly because it implies the world will warm and warm evenly. In truth, some parts will get colder, some parts drier, some parts wetter, and yes, some parts warmer. Hence the better term is climate change.

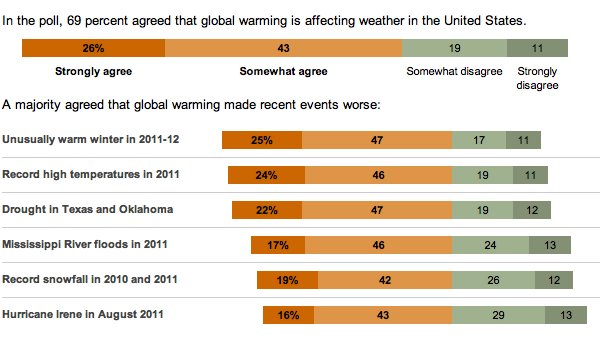
In the US, we have a tendency to be rather skeptical of climate change and the degree to which, if not whether entirely, it is due to mankind. So, the New York Times released the results of a survey about whether Americans believe recent weather events are related to global warming—their word choice, not mine.

Survey on global warming

While not all bars sum to 100, probably due to rounding, note how the bars are all aligned against the point of divergence between the scales of agreement and disagreement and then sorted according to agreement.

Surveying Sentiment

How do you feel about the economy?

Economic Outlook, scaled

The New York Times has posted an interesting interactive visualisation detailing the sentiment expressed by participants—defaulting to the most recent 100—answering several questions on the state of the economy. As a survey, this is—and it is framed as such—an unscientific sampling of trending opinions of only those who feel inclined to comment and are registered members of the New York Times.

What makes this more interesting is the ability to demographically filter the responses to find, for example, that the unemployed feel worse about their job status than the employed…perhaps that is not the best of examples, but, hey, it works.

One can also find the specific response tied to a marker on the field/band/spectrum of responses by mousing over and then clicking on the symbol. A little and unfortunate quirk here is that clicking on the person forces one down the page to the specific comment, but then leaves one with no easy way of returning to the broader picture short of scrolling all the way back to the top.