The Wall Today

This past Sunday I had a nice treat in the New York Times. They printed a piece looking at the state of the US-Mexican border wall as it is today. And not only was it an article, but it was a full-page article.
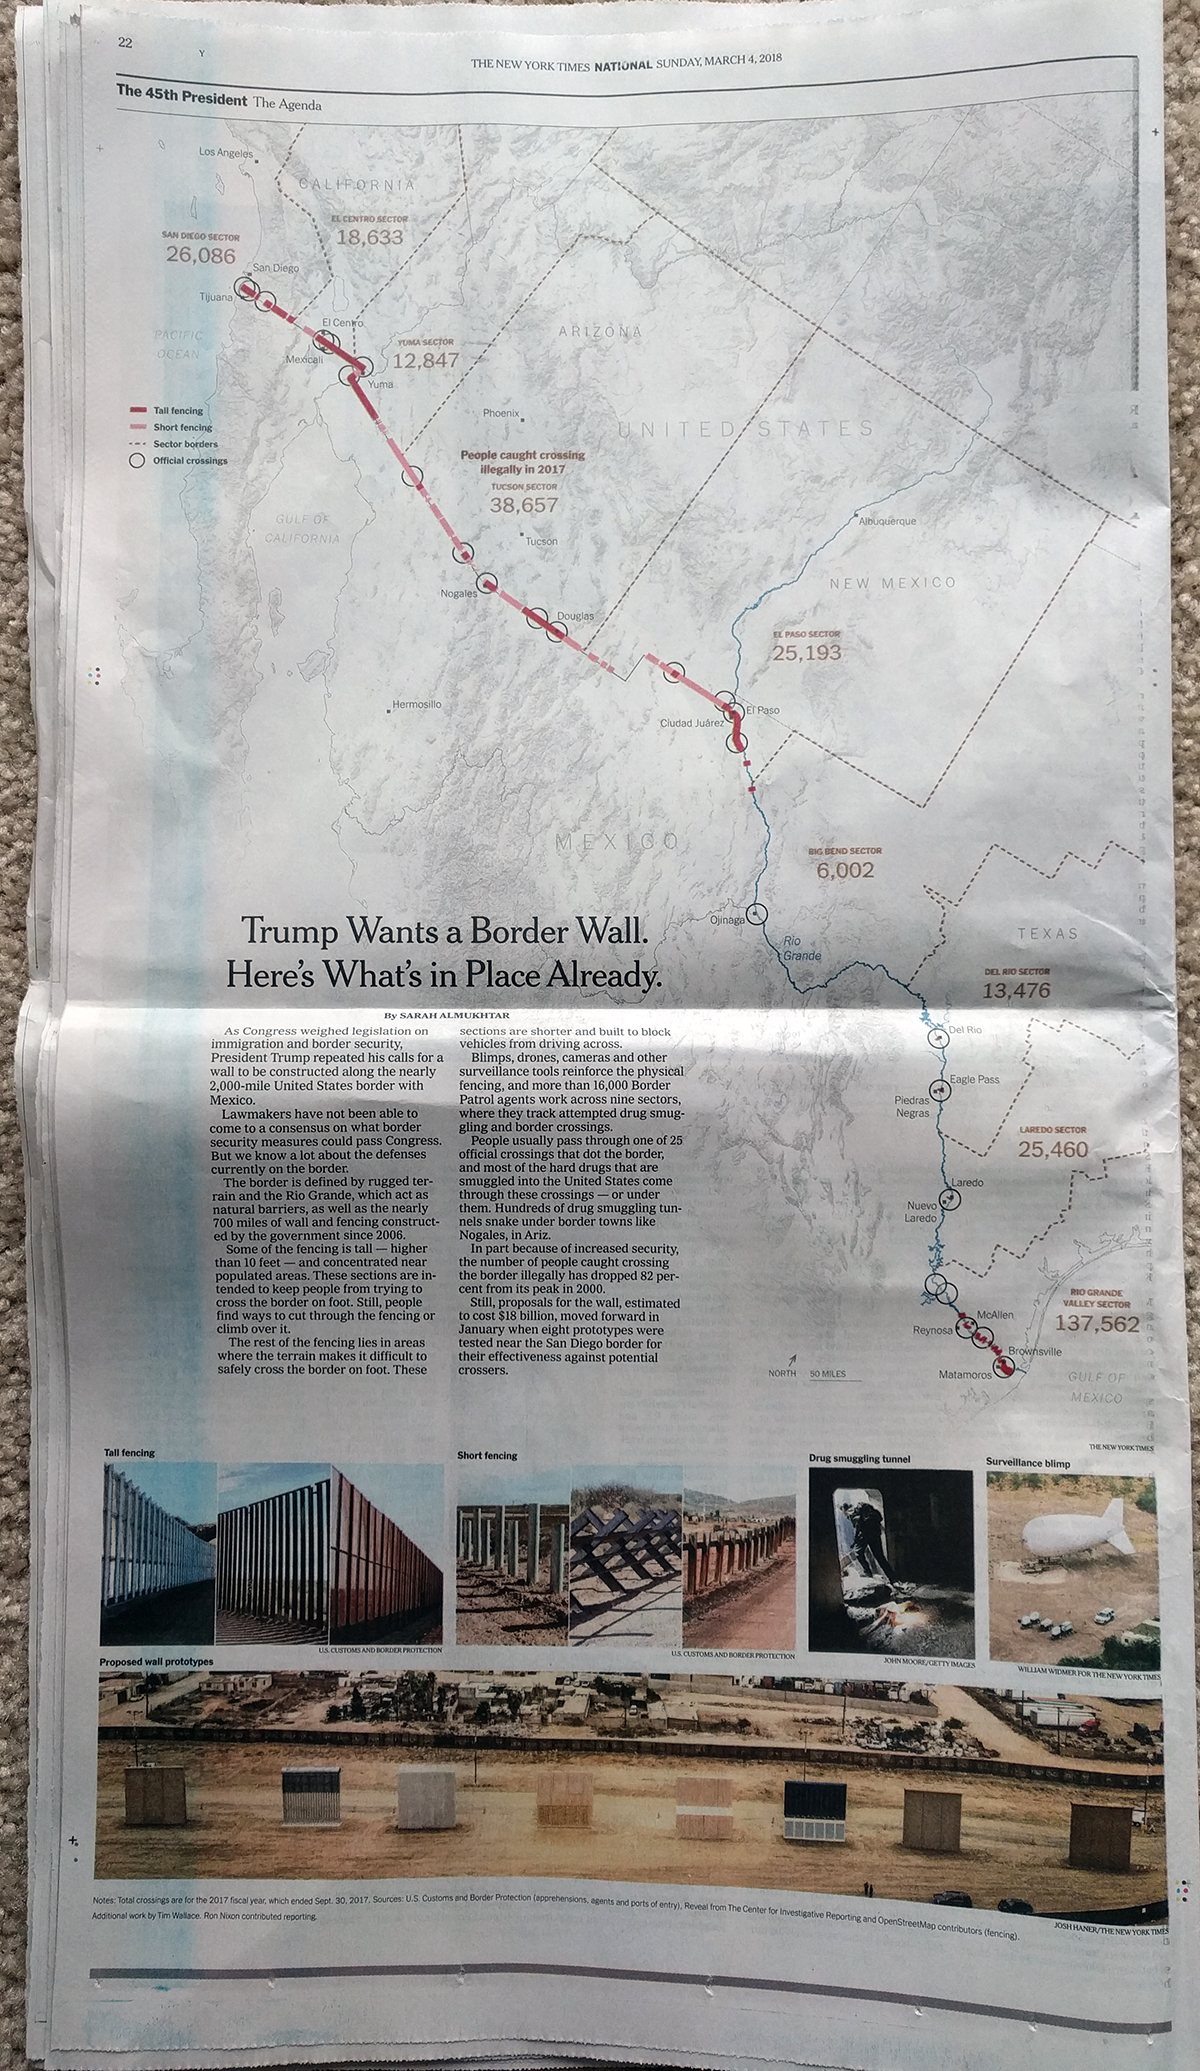
The Wall today
The Wall today

There isn’t a lot to say about it in particular. But what I really did like was the decision by the designer to tilt the map at an angle. Normally we would see a straight east-to-west, right-to-left map, but here the axis is more southeast-to-northwest, right-to-left map. And that creates a nice space for text in the lower left area, which the designer here did in fact use for the main block of text.

Credit for the piece goes to Sarah Almukhtar.

Why the Civil War?

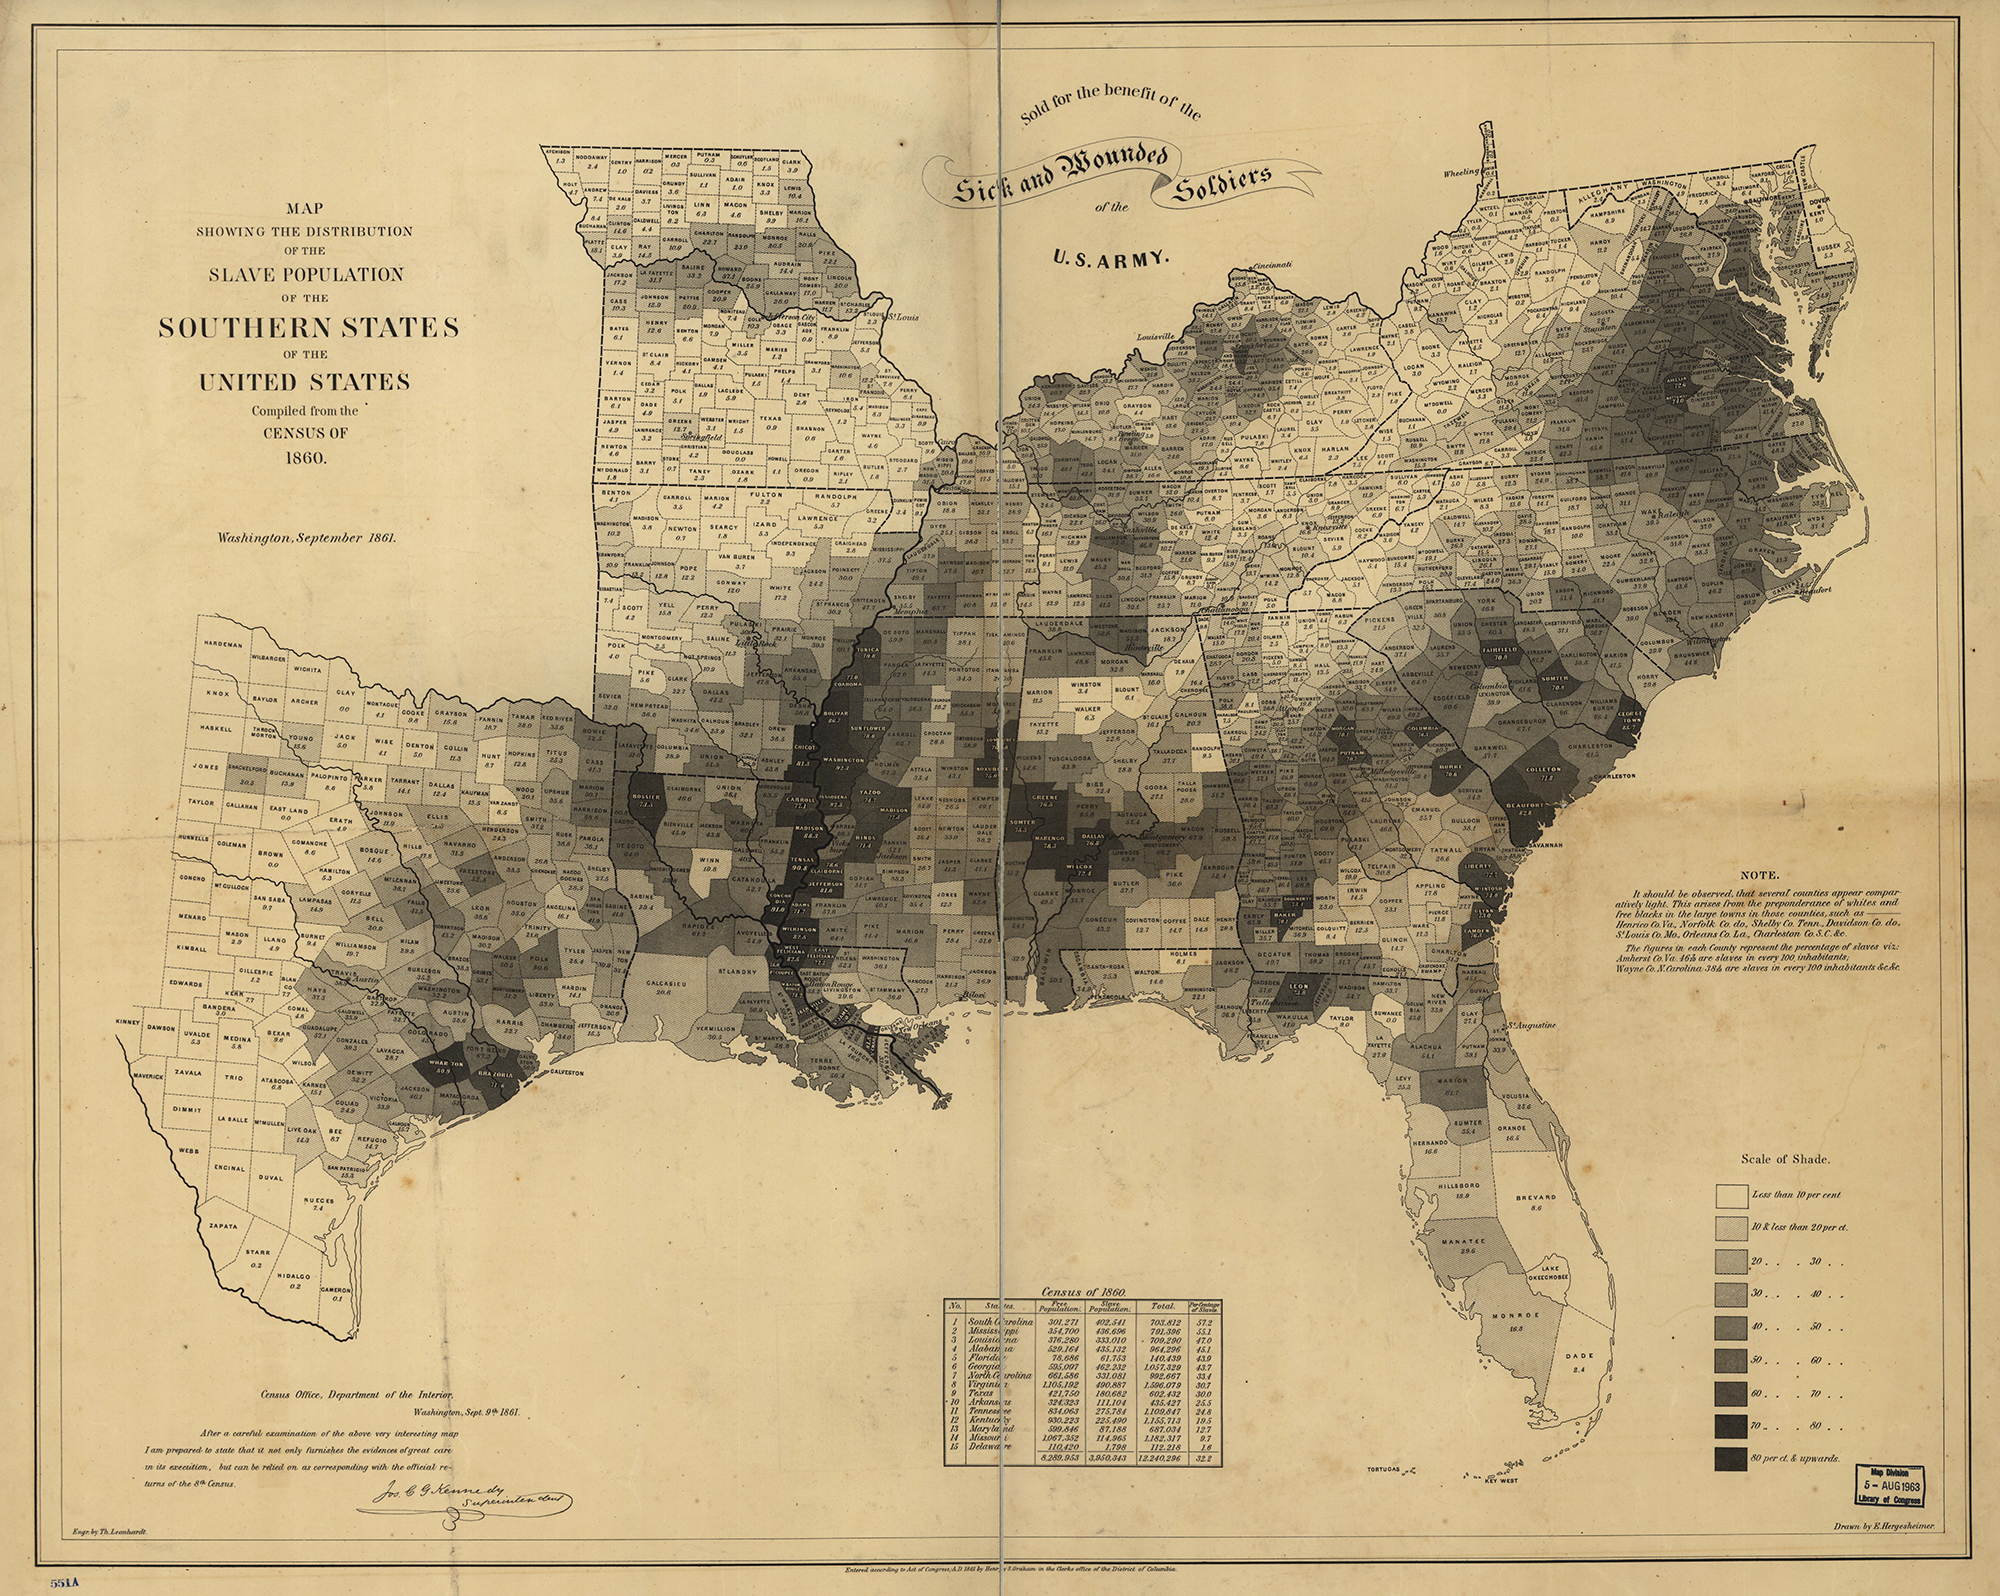
Yesterday, President Trump asked why there had been no discussion about the causes of the Civil War.

No, that is not a joke.

Well, Mr. President, turns out that there has been quite a bit of discussion over the last few years. And the broad consensus?

Do I even have to?
Do I even have to?

Note the above, with the darker shaded counties representing those with greater percentages of the population held in slavery. What do most of those states have in common with the Confederacy? That they are in the Confederacy.

To be clear, the Union was not perfect. Delaware, Maryland, Kentucky, and Missouri remained part of the Union, but were states where slavery was legal. In fact both Kentucky and Missouri had two governments. Kentucky provides a great example of the fault line with the pro-Union capital of Frankfort situated in the low-slavery east whereas the Confederate capital was located in western, high-slavery Kentucky.

But the point stands. Slavery was the link between Confederate states and Confederate-aligned parallel governments in Union states. So, Mr. President, when you are asked about the cause of the Civil War, now you know the answer.

Credit for the piece goes to E. Hergeshimer of the US Census Bureau.

North Korea’s Missile Programme

So here’s how this week was supposed to go. I was going to write about the Northern Irish election Monday and then Tuesday was going to be a piece from the New York Times that looked at the public’s concerns facing an incoming president. This piece I was going to save for later. But then Sunday night North Korea tested several missiles and flew them into the Sea of Japan. Sort of felt appropriate to move this one up a couple of days.

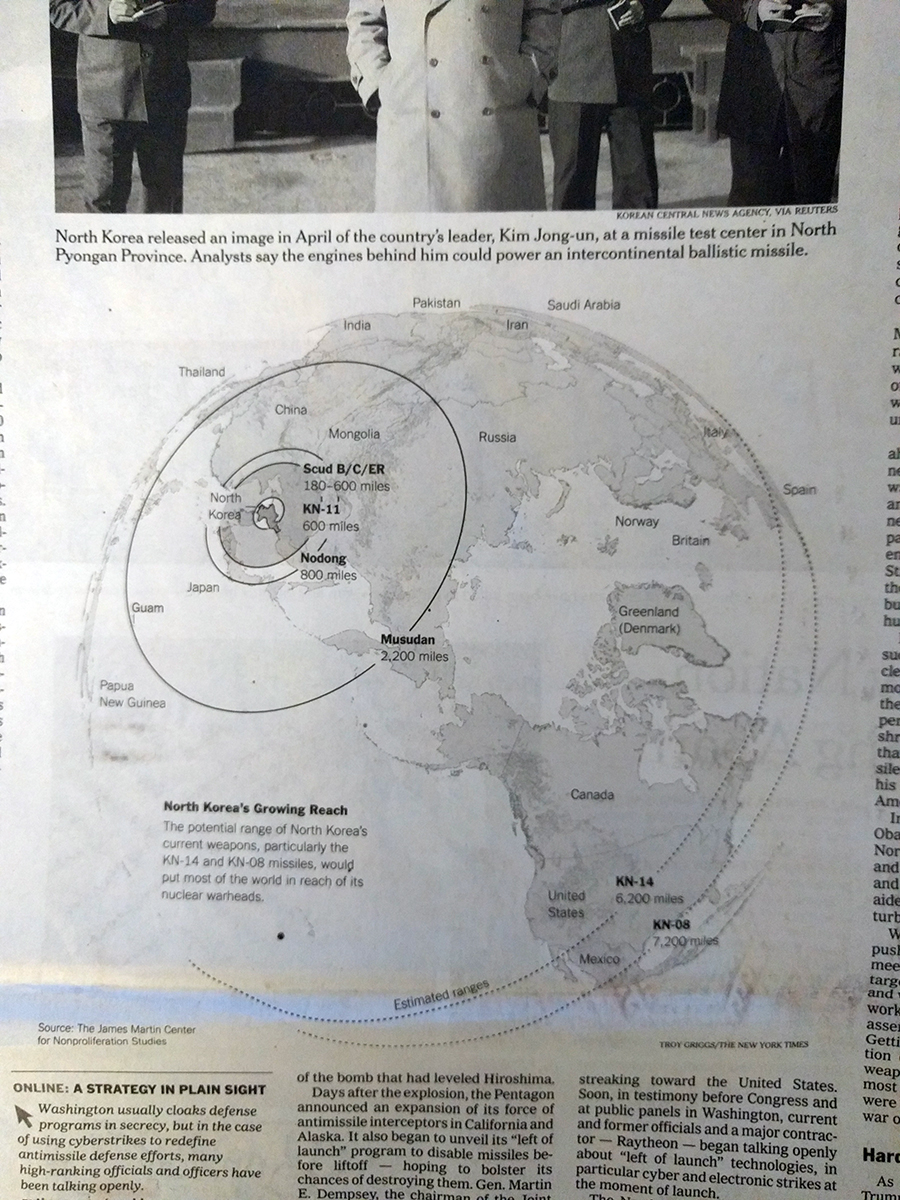
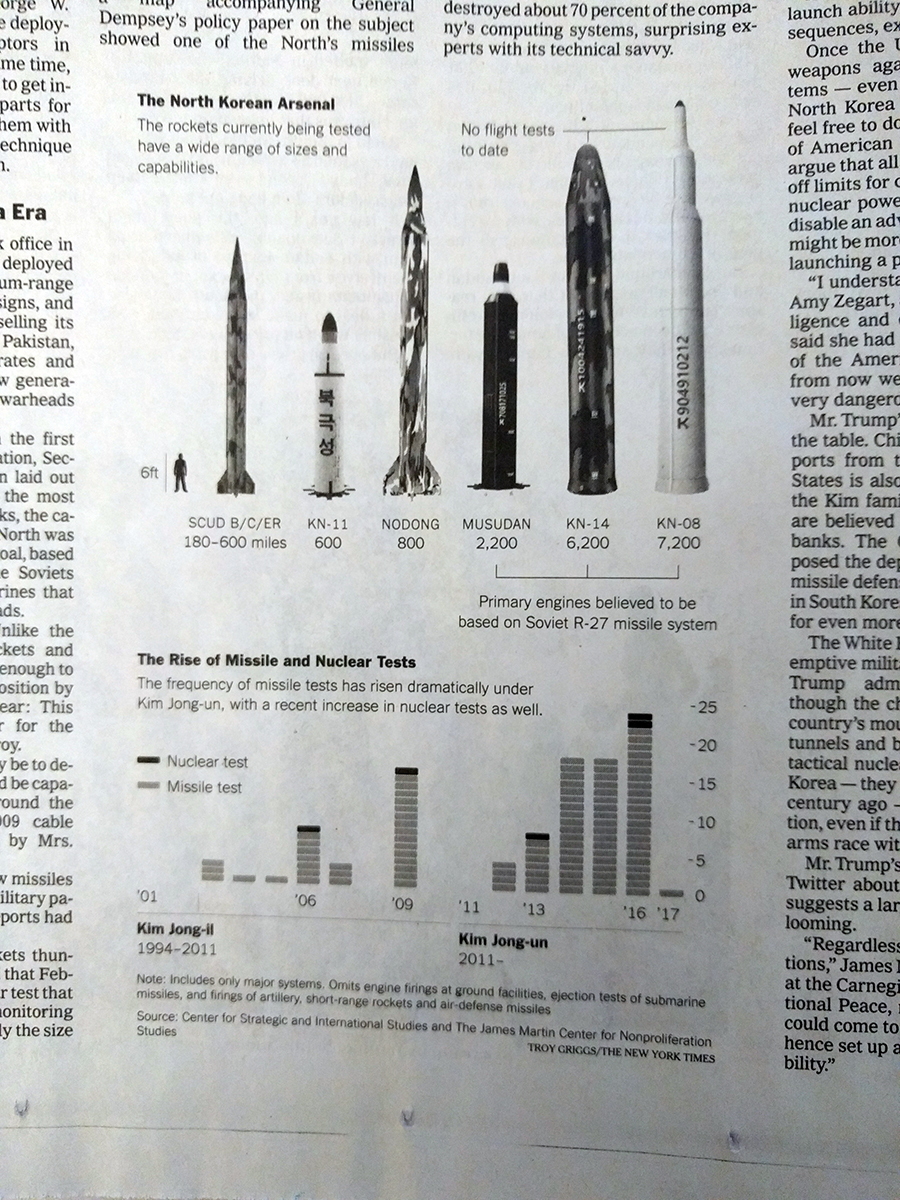
As you know, I like infographics and diagrams about military things. And in an article about the US cyberwar against North Korea, the New York Times included these graphics to provide context about the scale and scope of the North Korean missile programme.

missileRange_900
Where the missiles can reach, looking at you, West Coast
The size of the missiles and the number of tests
pageDesign_900
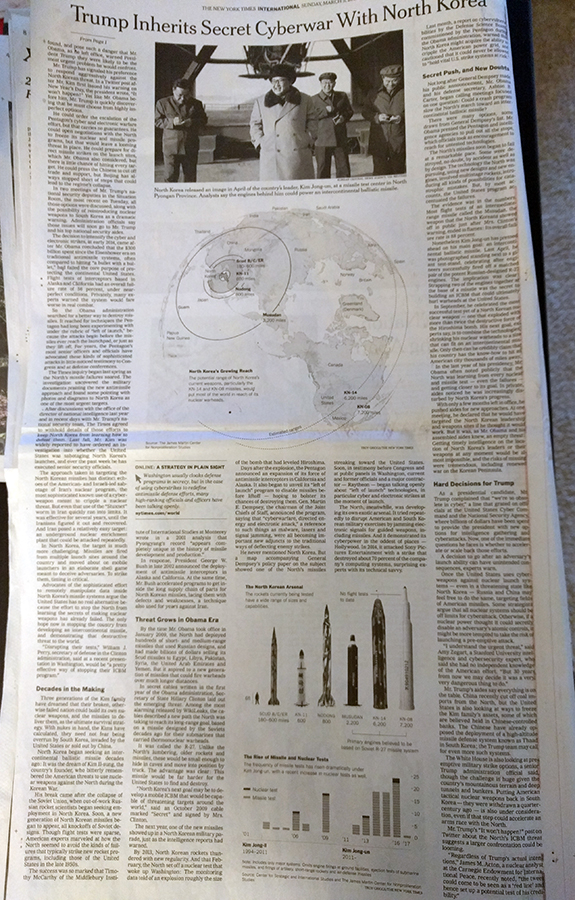
The overall design of the page

I don’t have the URL for the page on-hand, but if you can find it. The article is well worth the read.

Credit for the piece goes to Troy Griggs.

White (Immigrant) People

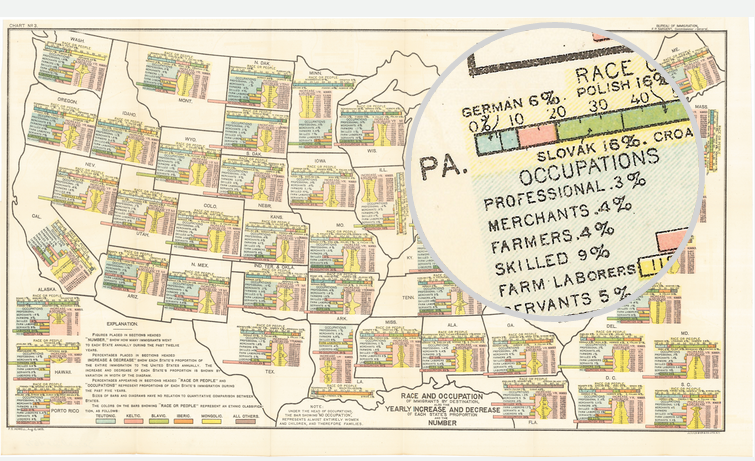
This is an old map that saw the light of day a while back. Featured on Vox, the map supports the notion that some white people are whiter than other white people. The map explores immigrant populations. Using a map for spatial arrangement of integrated components, the data looks at immigrants’ ethnic origins, their workforce breakdown, and their recent growth.

A look at PA, my ancestors are in that data set

Credit for the piece goes to FS Howell. (I presume.)

The American Empire

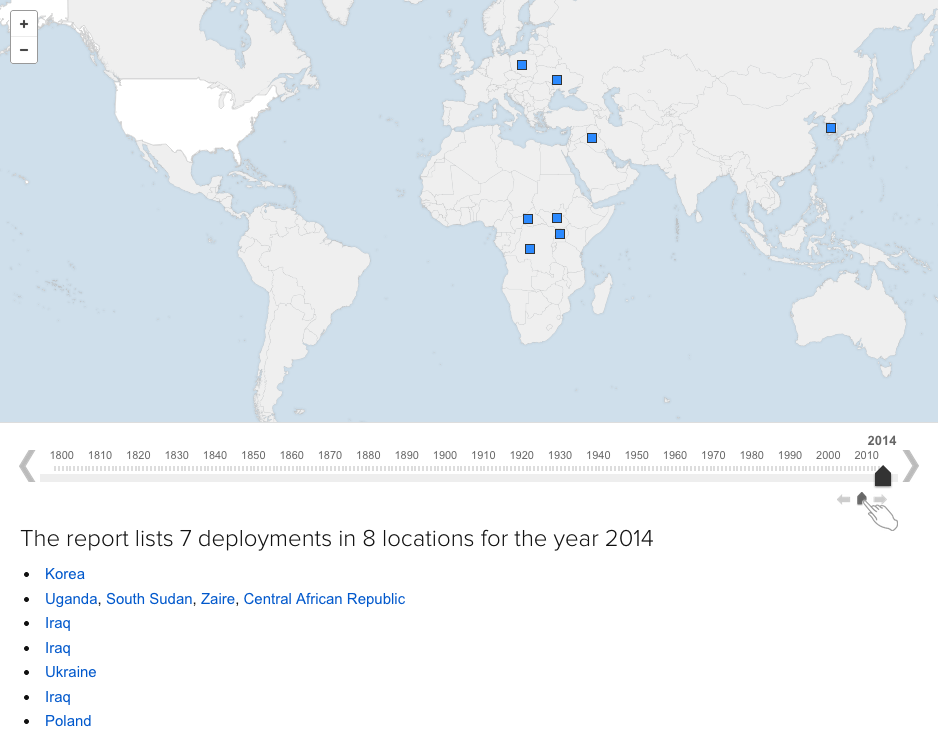
The United States has a long history of deploying troops overseas. How long? And where to? Well, ABC (as in the Australian Broadcasting Corporation) mapped out every US deployment dating back to 1798. I captured the year 2014, but if you are curious, you should check it out for yourself.

US Deployments Abroad

A neat little bonus, watch the growth of the borders of the United States from 1798.

Credit for the piece goes to Simon Elvery.

What if Britain Had Won?

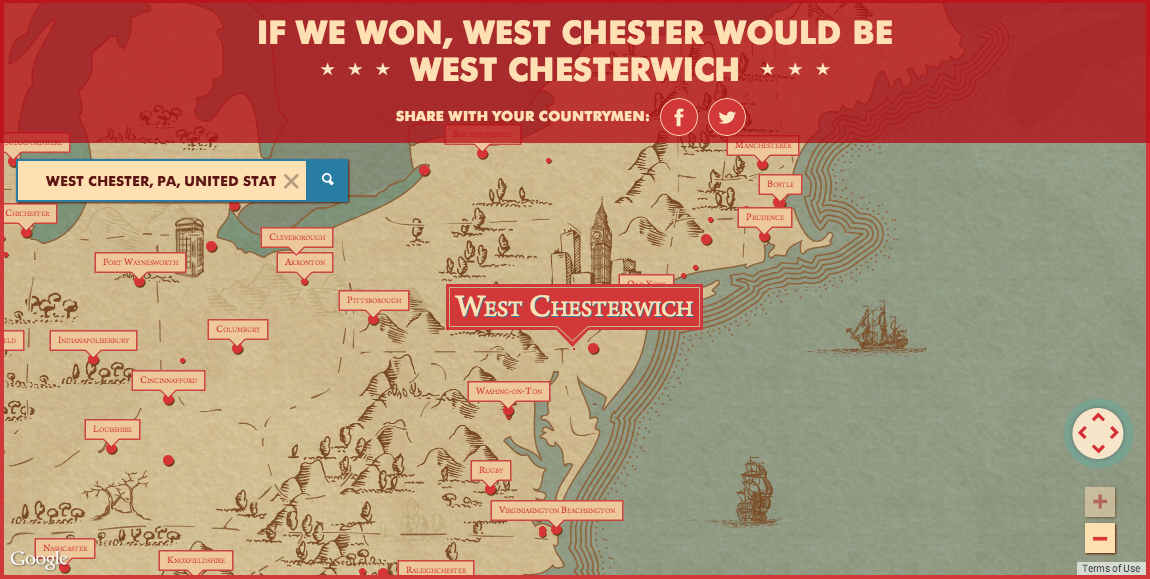
A few weeks ago, one of my coworkers, sent me a link to a Newcastle Ale campaign video asking what would America be like if Britain had won the Revolutionary War. Anybody who knows me really well knows I am an Anglophile. I say mobile instead of cell phone, from time to time I switch from apartment to flat or truck to lorry or elevator to lift. So naturally I checked out the campaign site and what did I find? A map of place names if the Americans had not won the war. You can search for your residence or hometown and see what the Brits would have named it.

Though this ignores the fact that most of where I am from was actually named by the Brits. West Chester was originally called Turk’s Head, but after the a bunch of boundary changes that separated the British named Chester from my area, Turk’s Head was renamed West Chester because it is west of Chester, located on the Delaware River. Anyway, place names are cool. Happy Friday, everybody.

I would have grown up in West Chesterwich

Credit for the piece goes to the design team behind the ad campaign.

Canada vs. the United States

Last week I was asked what was the population of Canada. I first said 30 million. I then figured that was too small so I said more like 50–60 million. Turns out I was closer to being correct the first time. A Google search that cites the World Bank among its sources listed the population as nearer to 35 million. But what does that mean?

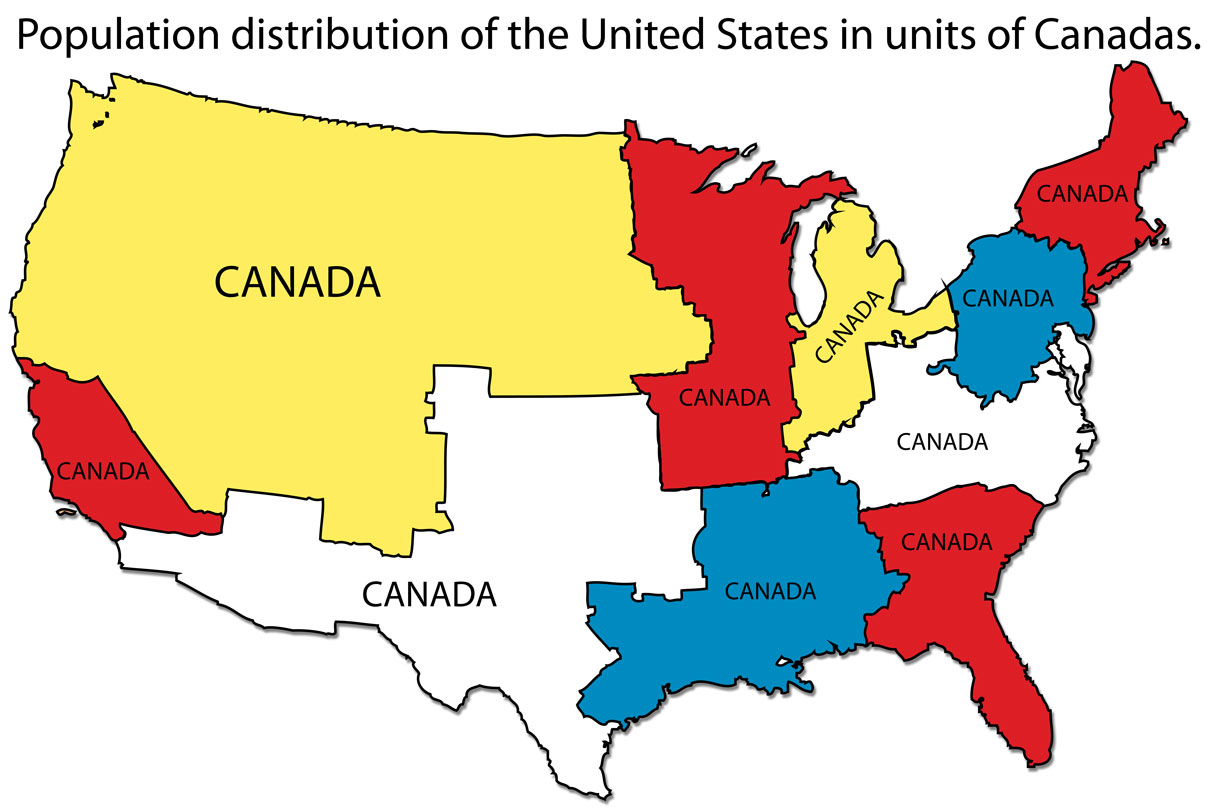
Over at I Love Charts, the United States was broken down into units shaped by the size of the population of Canada. Roughly, the United States = 10 Canadas.

How many Canadas in the US?

Credit for the piece goes to an unknown individual. If discovered, I would appreciate being informed.