This past weekend was some good Red Sox baseball. Okay, so we only won two of three from Oakland, but that second game was fantastic. John Lester dominated. Last fall I mentioned a studio called Statlas that was visualising the World Series. They continue to update and tweak their product and so it was great to see Lester’s performance documented.
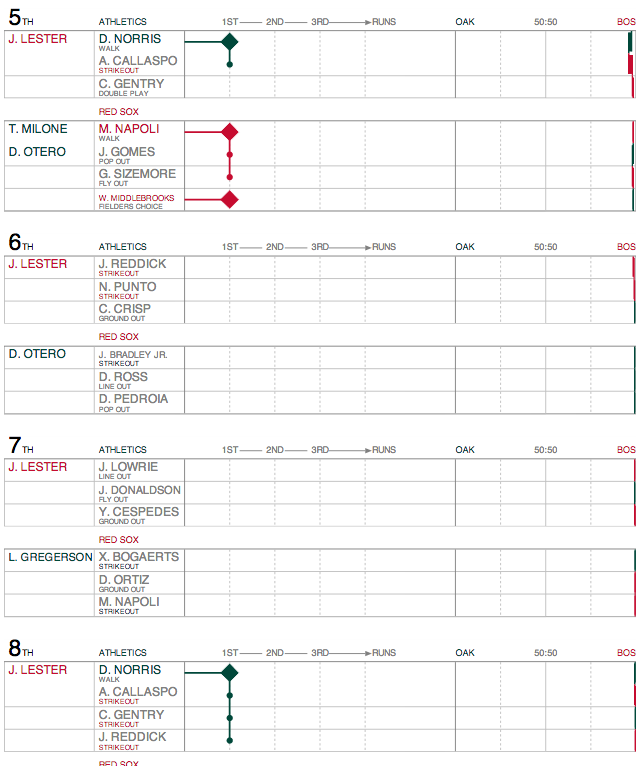
Though, as you can see, Lester so dominated the Athletics, you can see almost nothing happening from Oakland’s batters. But, I will skip the near ninth-inning implosion of Boston’s relief corps that nearly cost us the game. Mostly because the visualisations of the game tell a great story. And so if you like baseball and data visualisation, you should check it out.
Credit for the piece goes to Statlas.
Leave a Reply
You must be logged in to post a comment.