On Tuesday the United States had another round of primaries, this time in Arizona, Florida, and Illinois. Ohio was scheduled to be the fourth, but its governor postponed the vote to some point in the future due to the ongoing coronavirus COVID-19 epidemic.
As my regular readers all know, I thoroughly enjoy election season because we get all the data to look at and try to explain what is going on. And more data means more graphics, so I doubly enjoy it. And so the last few weeks have been exciting. But while there were twists and turns and excitement the last several weeks, we walked into Tuesday night with a common hypothesis or story line. Biden would probably win all three states, though Latinos could help Sanders in Arizona in a long shot, or an anticipated depressed turnout in Illinois due to COVID-19 could allow Sanders to pick up a victory there.
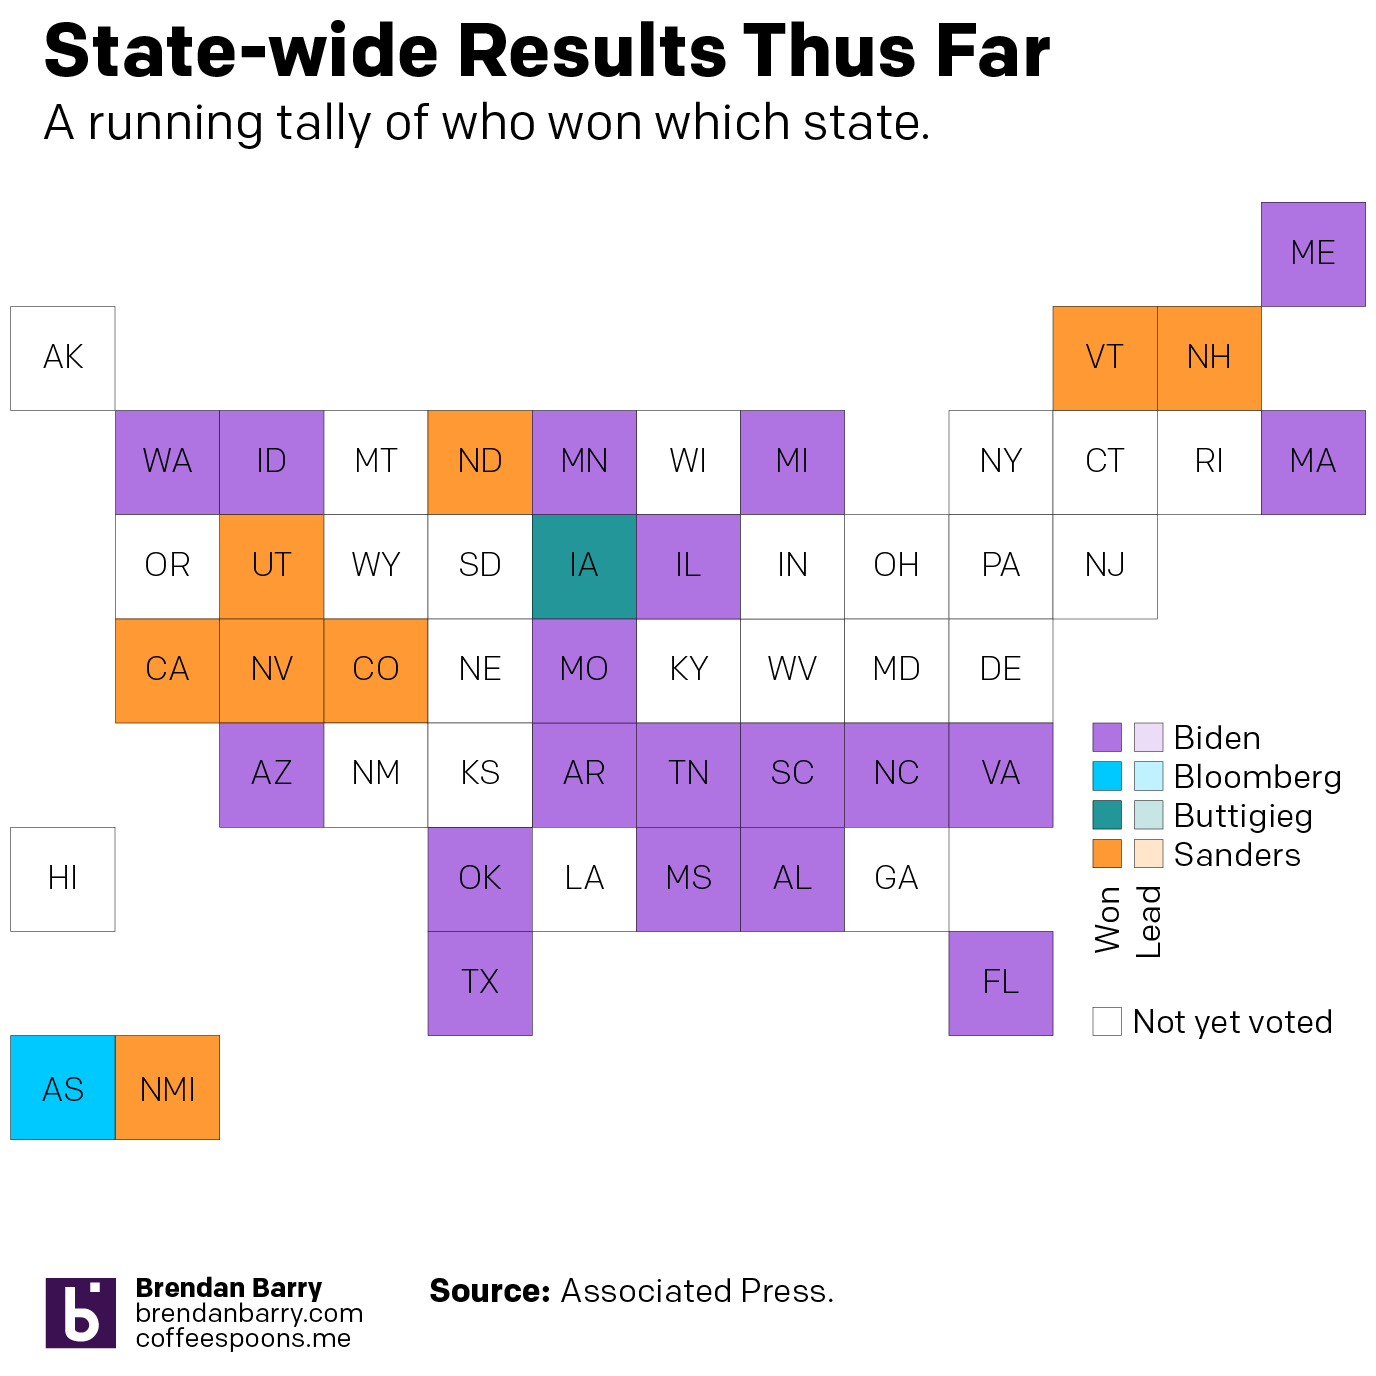
The results did not surprise most: Biden beat Sanders decisively in all three states. And over the last two weeks, that put eight of the nine states in play into Biden’s camp. Furthermore, Biden has won the majority of states now since primary season kicked off with that disastrous caucus in Iowa. You can see that in this graphic that I made Tuesday night and posted on Instagram. (All the images that follow I posted on Instagram that night and the night after Michigan voted.)
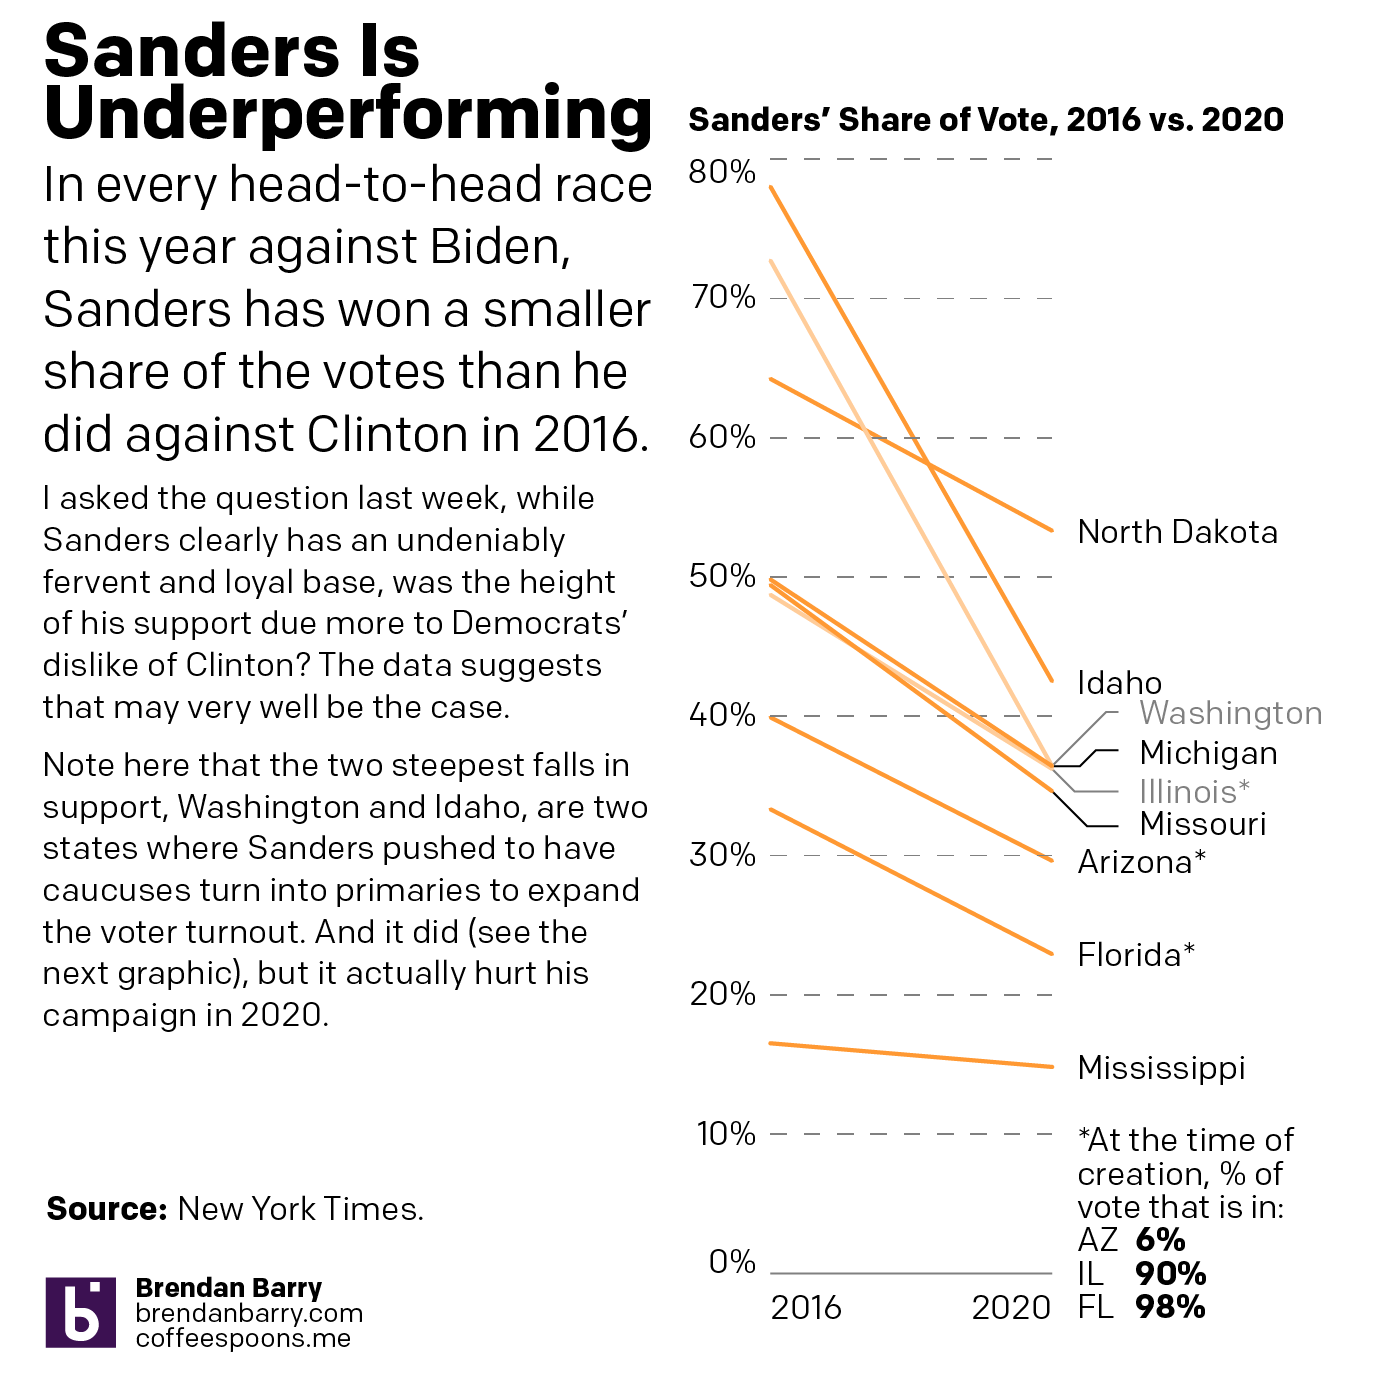
But beyond the top line figure of who won which state, I wanted to look at some of the underlying data on Sanders’ support. Specifically, the margins in the head-to-head contests seemed, as far as I could recall, vastly different than the close run races between Sanders and Clinton in 2016. For this, I had to discount everything up to and including Super Tuesday. All those contests featured multiple centrists/moderates and multiple leftist/progressives and that muddied up the data.
Instead I focused on the states over the last two weeks. (I noted that Washington and Idaho had switched from caucus to primary in an effort to draw out more Democratic voters, in an attempt to generate more support for Sanders’ campaign.) And I discovered that in every state, without exception, Sanders performed worse in 2020 than he had in 2016.
I hypothesise that one factor in this underperformance relative to 2016 is that he has Joe Biden as a foil instead of Hillary Clinton. Before the campaign began, Biden was one of the most favourably regarded Democratic politicians. There’s a reason people have given him the nickname Uncle Joe (though his gaffes certainly are another factor in that sobriquet). Conversely, Hillary Clinton was, well, suffice it to say, not popular. She was eminently qualified, but had low favourability numbers.
First, we can clearly establish that Sanders enjoys a strong and loyal core base of support. With squinting eyes and a little bit of spit, we can say the floor is probably in the 20–25% range of the Democratic voting bloc. Clearly in some states it is far higher, in others far lower. But was the 2016 vote, where, relative to 2020, he over-performed perhaps due to that low favourability of Clinton?
One possible hypothesis is that Sanders suffers from lower turnout than 2016. After all, his own campaign makes the point that he will bring out a larger, more diverse, and crucially younger electorate to propel him to victory.
On the youth front, one of the drawbacks to the coronavirus outbreak is that this week we had no exit poll data to understand the demographic breakdown of the voters in Arizona, Illinois, and Florida. (And I highly doubt we will see exit polling through the next several sets of primaries.) But we could take a look at it last week, and I did with the crucial state of Michigan. After all, that had been Sanders’ surprise upset that allowed him to carry on almost into the convention. But, what I found was that youth turnout was actually lower, proportionally, in 2020 than it was in 2016.
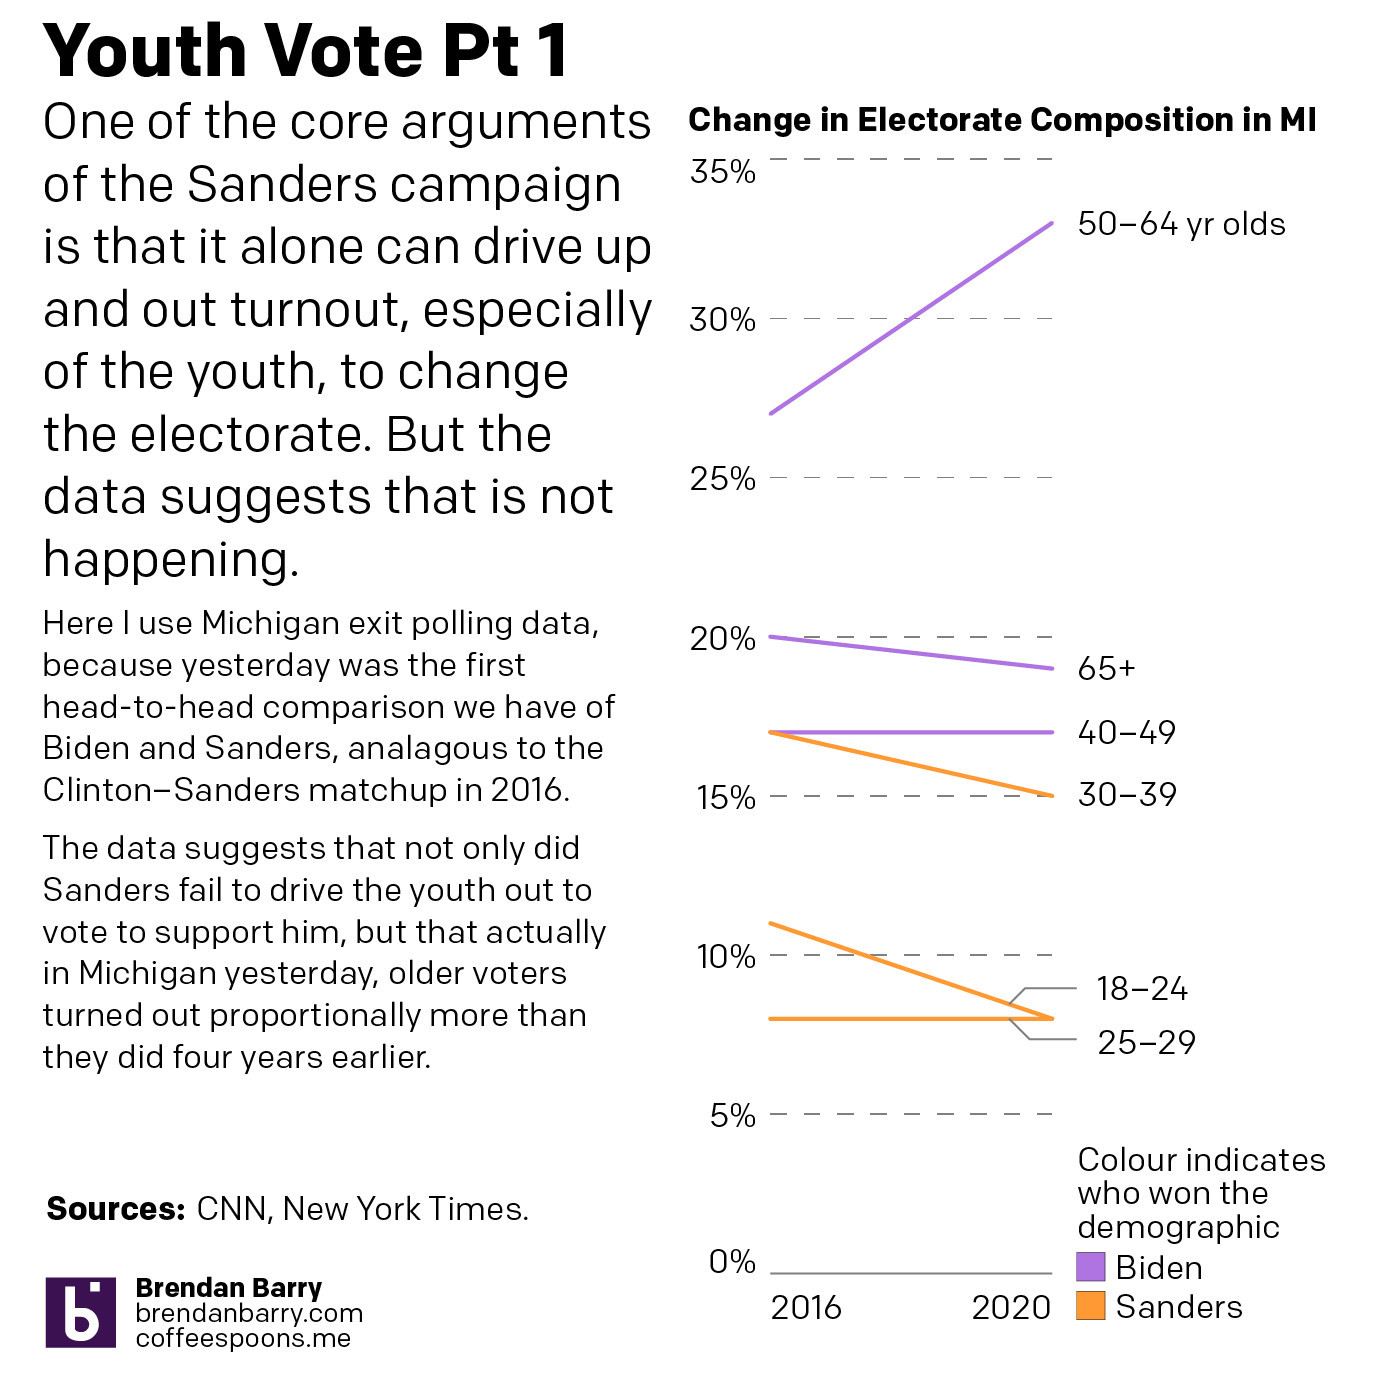
So, if the idea was that Sanders would be turning out the youth vote, well, it should have gone up and not down. Again, a more robust check on this hypothesis would be to look at exit poll data from more states, but right now we have few states to do that. Washington, which voted the same night as Michigan, would be a fascinating study, except it switched from caucus to primary and so the numbers cannot be directly compared.
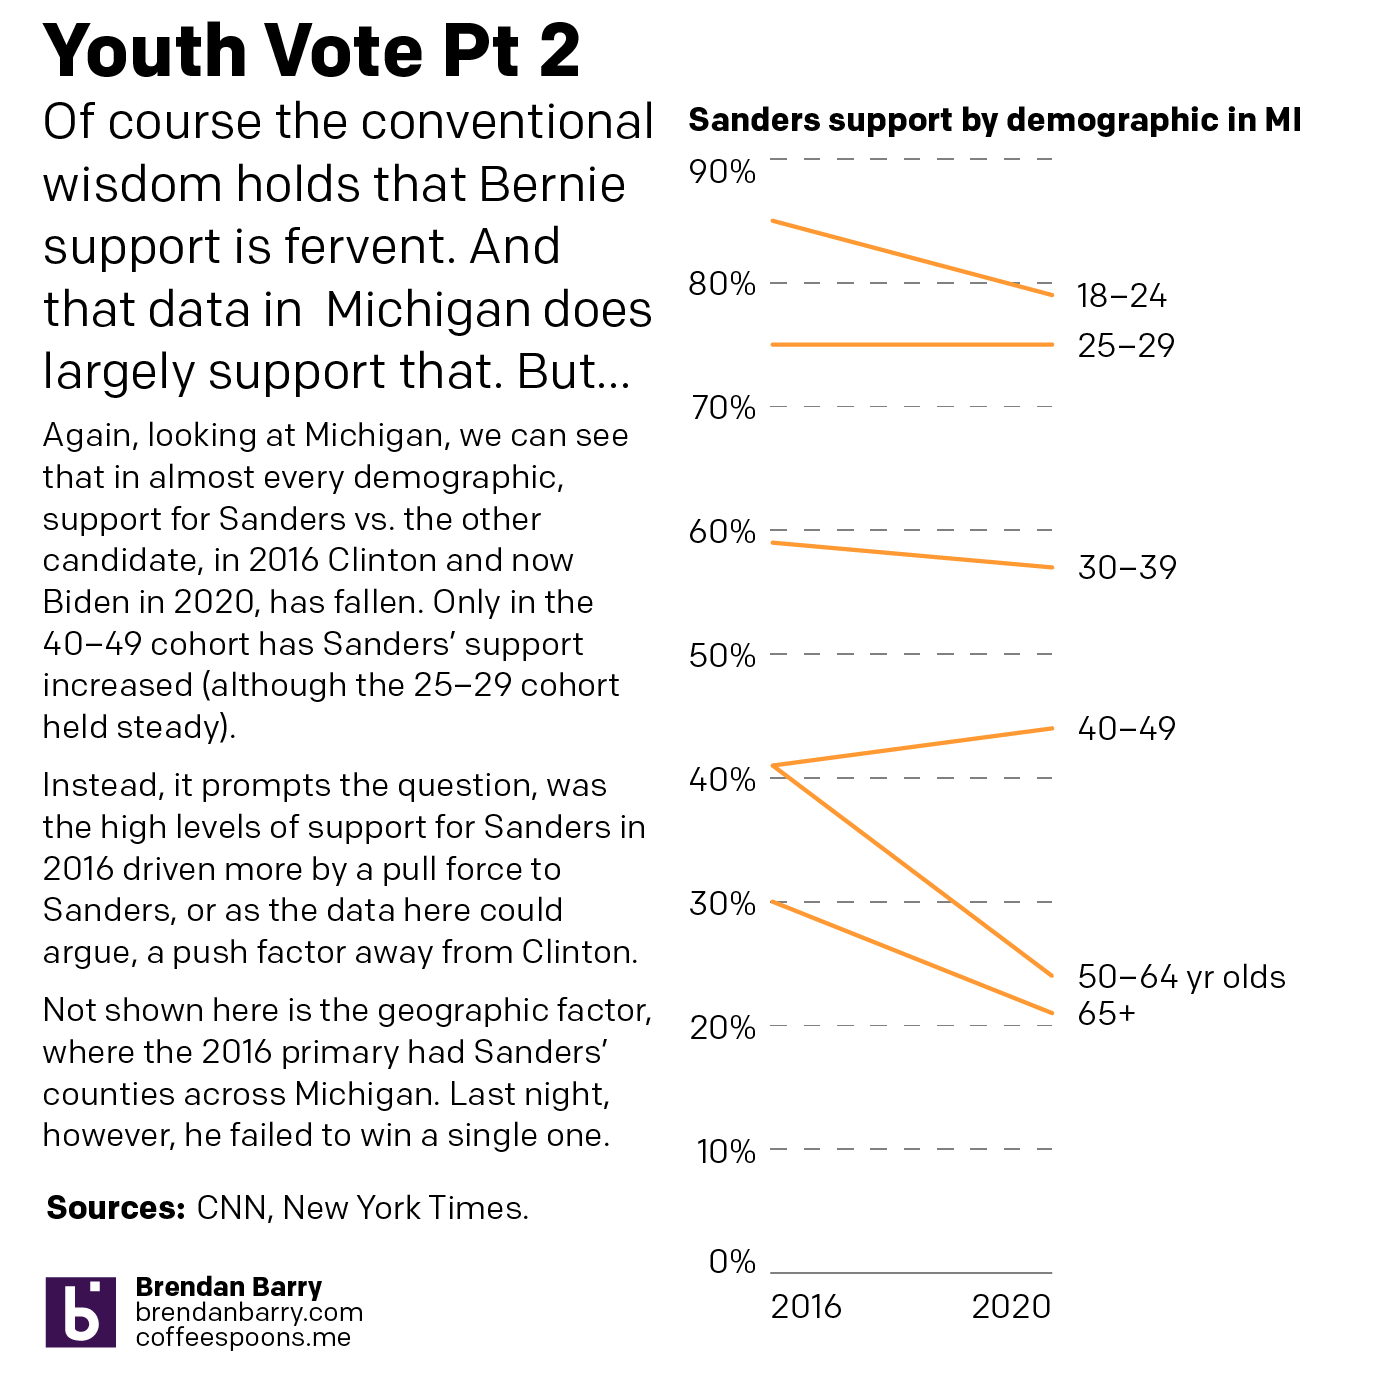
But it also wasn’t just the youth vote was down proportionally. In fact, a look at that Michigan data shows how Sanders had a lower share in most demographics, only seeing a rise in the 40–49 cohort.
If the youth (and potentially others) vote is down, maybe overall lower turnout is what hampers Sanders’ performance. Here, I looked at the total number of ballots cast in the states over the last two weeks. I noted that Illinois in particular would be lower given the outbreak as both Florida and Arizona do a significant number of mail-in ballots. And what I found is that, no, turnout is actually up almost across the board.
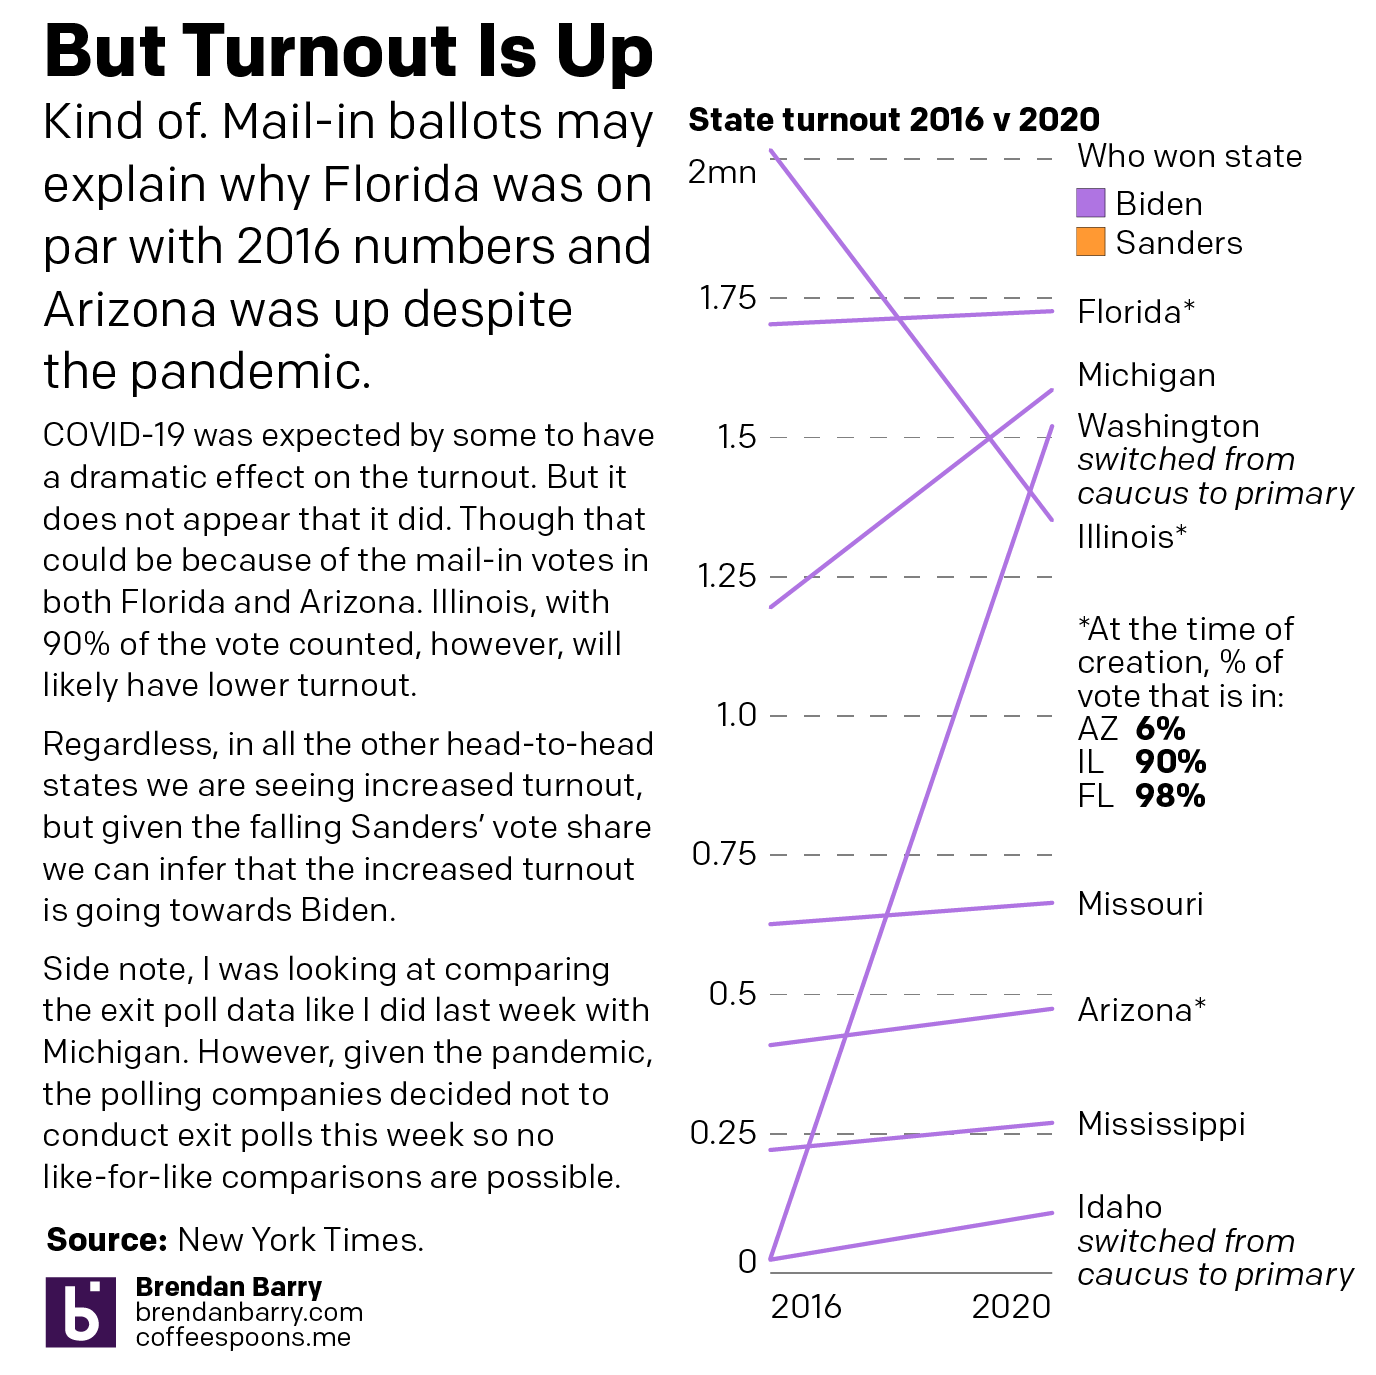
And so we can see clear evidence that despite Sanders’ strong and fervent support with his core supporters, he has been unable to grow that support and build a coalition. His share of the vote fell in every state where we had a head-to-head race and yet turnout is up, which runs counter to the argument of his campaign.
Sanders is clearly underperforming in 2020. 2016 was the year that people felt the Bern. Maybe in 2020 a significant number of his 2016 supporters are Berned out.
Credit for the pieces goes to me.
Leave a Reply
You must be logged in to post a comment.