As I ate breakfast this morning, I read through the Morning Briefing I receive from Bloomberg. These days, it provides a good update of what happened in Iran and the Middle East. Every once in a while I will flag one of their graphics to share here, but never decide to ultimately do it because in that space they are usually just very solid, very well done. But this morning was one of those that-is-a-very-odd-choice moments I figured I would share.
This is a screenshot of the map.
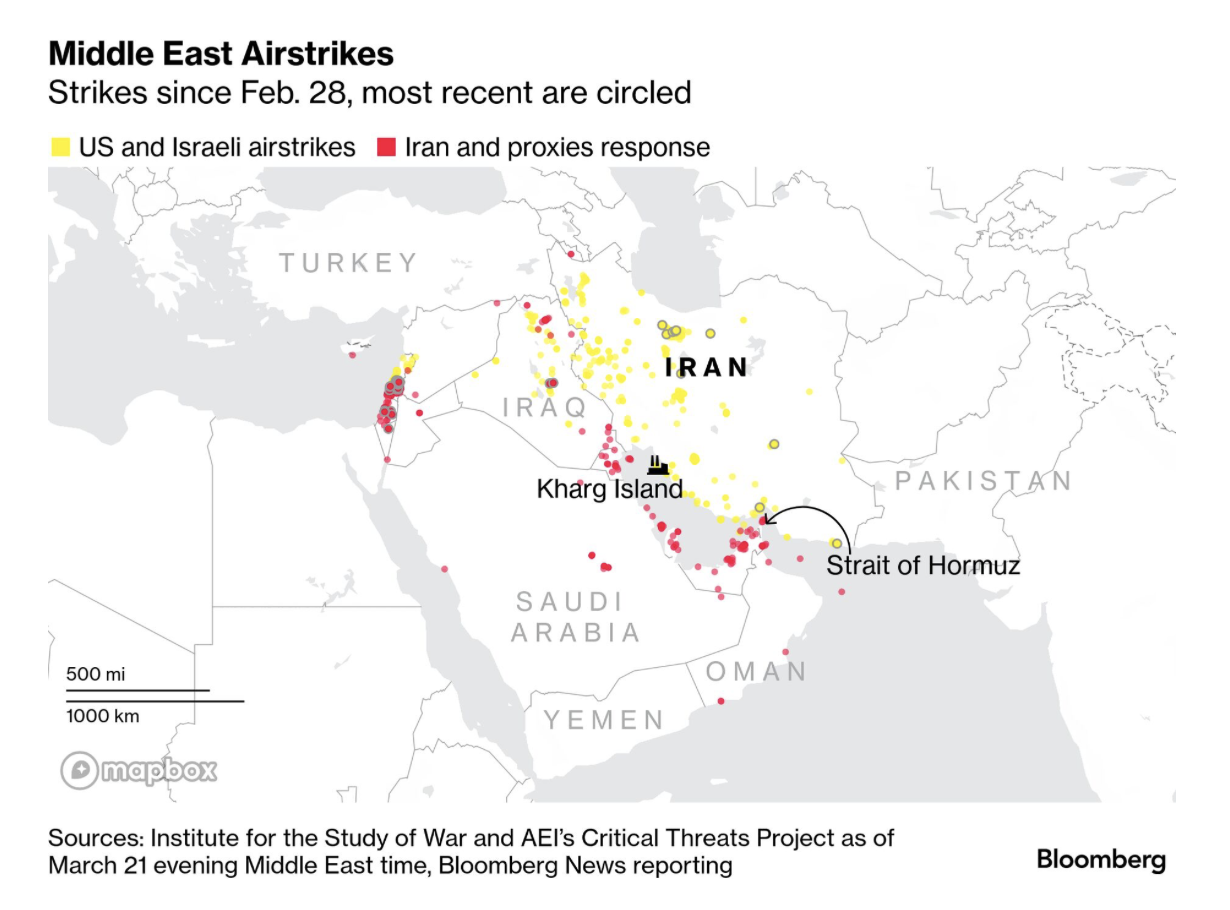
Now, before I reached it I saw in my peripheral vision a map full of red. Scary. Not good. When I reached it, between bites of oatmeal I saw US and Israeli airstrikes in red. But, that did not make sense, why would the US and Israel strike Saudi Arabia?
I took a sip of my breakfast tea and looked a little more closely—ah, yellow dots for US–Israeli strikes and red dots for Iran.
As I said, an odd choice.
Yellow is a very bright colour. I mean it’s the colour of the Sun after all—it’s not, but that is an avoidable tangent today. Taxis—remember them?—stuck out on the street because of their (often) bright yellow paint jobs. But it is also a very light colour and will often fall “behind” other, darker colours when we perceive them. Those properties can make it a tricky colour with which to work, especially in data visualisation.
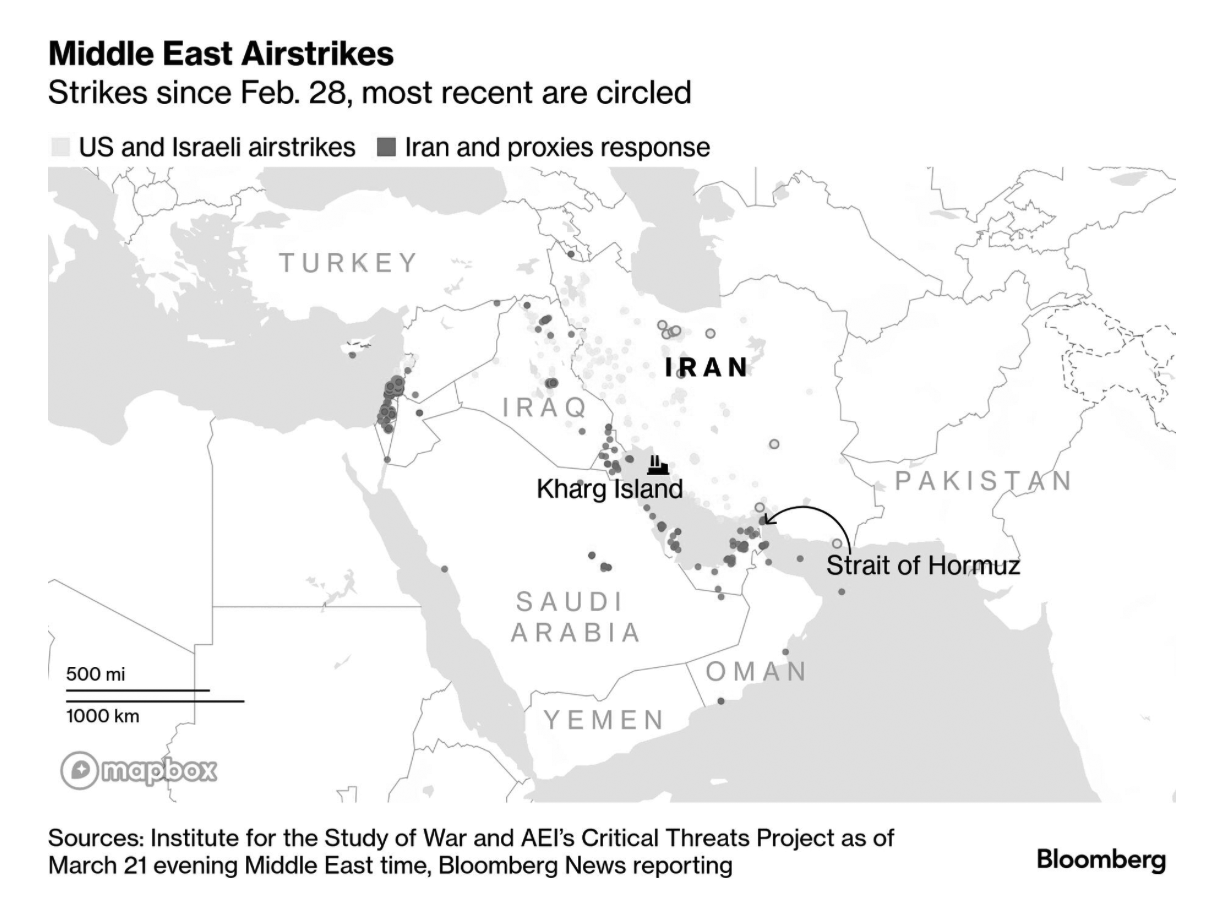
Here, the yellow dots failed to initially register with me, admittedly as I ate oatmeal. If we turn the whole graphic black and white, you can see the grey value of the ocean and seas is darker than that of the US–Israeli strike locations.
This could be a decision forced by brand standards and visualisation guidelines. As I said, yellow can work, but you have to be careful with it and I would consider not using it in these sort of situations where it appears as very small dots on a white field.
More sinisterly, the colour choice could be driven by a narrative preference. My preference here would be to present both sides of the conflict equally—treatment of airstrike locations by both sides equally visible and with equal weight. After all, that is what the graphic’s title reads: Middle East Airstrikes. But the result of the graphic is to highlight Iranian strikes at the expense of US–Israeli ones. You could interpret that as an attempt to de-emphasise US–Israeli actions in the war. To minimise their impact and emphasise that of Iran.
Given the reputation of Bloomberg, I am willing to bet more on the former and just a poorly executed colour choice. It happens.
Instead, however, you could take the yellows and make them a darker colour, say blue, and present the map this way, where the airstrikes by both sides are presented more even-handedly.
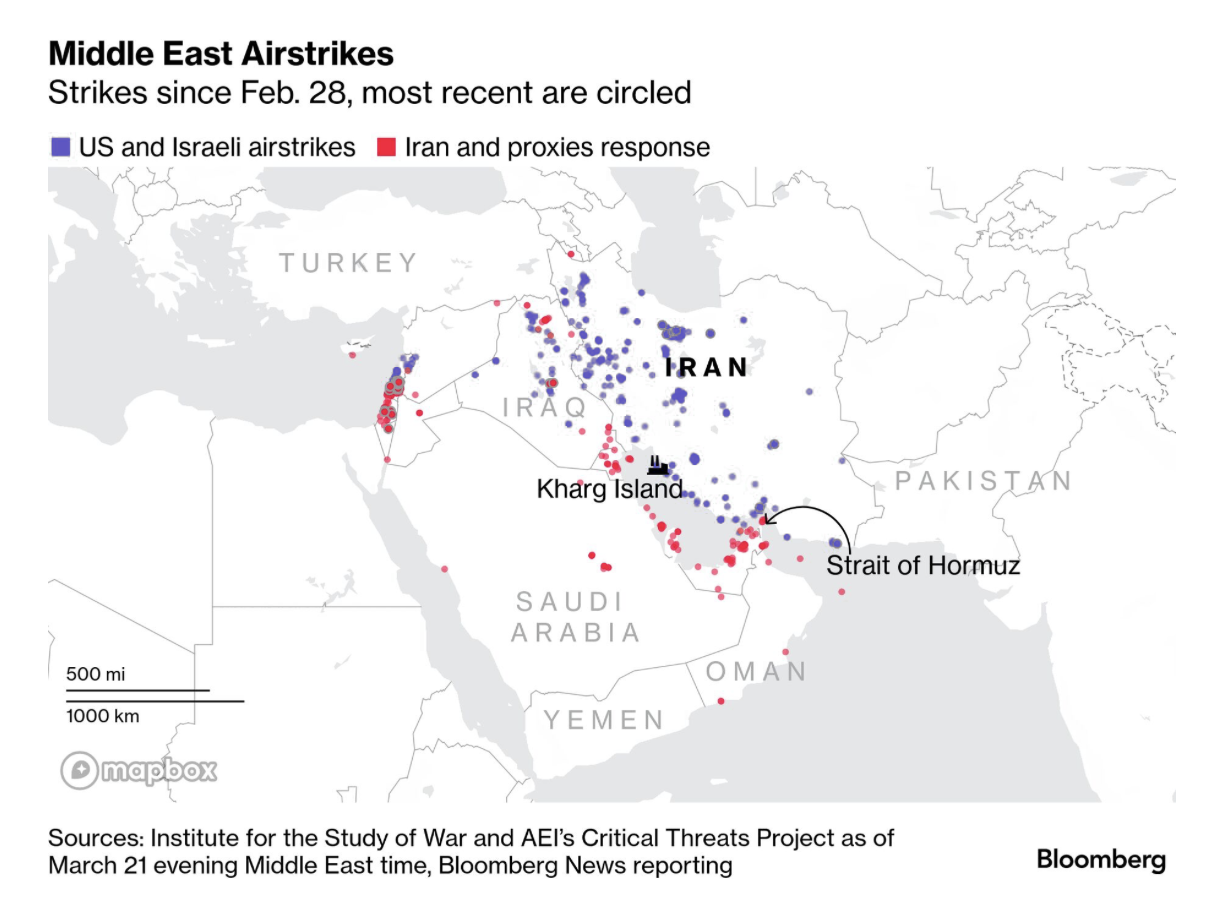
Here the map more clearly shows where US–Israeli airstrikes occur and at the same visual intensity of Iranian airstrikes, which fits the description offered by the graphic’s title.
And incidentally it’s in the classic red-on-blue colour scheme.
That all said, the rest of the original map is nice. White for the countries, grey text labelling and grey oceans put the visual emphasis on the conveyed information. Two little annotations highlight geographic locations—Strait of Hormuz and Kharg Island—of which most readers would be unaware or otherwise could not locate. The text for those locations—and of Iran—is black to draw emphasis there.
As to which countries are labelled, I do have some questions, but not like I had in my graphics about Poland the other day. Saudi Arabia, Oman, Iraq, and Turkey all make sense as all have been hit by missiles or drones. Amidst Yemen’s ongoing civil war, the southwestern area near Bab-el-Mandeb, or the Strait of Mandeb, remains under the control of Iran’s proxies, the Houthis—that whole Red Sea piracy thing—and my armchair generalship remains surprised that the Iranians have not attempted to shut or throttle traffic sailing through that bottleneck.
But Pakistan? Pakistan last year signed a mutual defence treaty with Saudi Arabia, agreeing to Saudi Arabia’s defence if attacked. Do I think it likely we will see Pakistani tanks rolling across the Iranian–Pakistani border? No, but if things keep up a second front could make things…interesting…and so Pakistan’s actions are very much worth keeping an eye on these days.
So if Pakistan, why not Syria? Why not Israel? Why not the United Arab Emirates? I could perhaps understand not labelling Kuwait, Qatar, and Bahrain because of their geographically small size despite their geopolitically massive size in the war.
Overall, a solid conceptual graphic from Bloomberg with my morning breakfast. But, I would have certainly avoided yellow.
On the other hand, it’s first thing Monday morning.
Credit for the original graphic goes to the Bloomberg graphics team.
Credit for the edits is mine.
Comments
One response to “Gooood Morning, Bomb Iran?”
[…] Friday, all. On Monday I critiqued a graphic from Bloomberg about airstrikes in the Middle East. As we head into the weekend, I opted […]