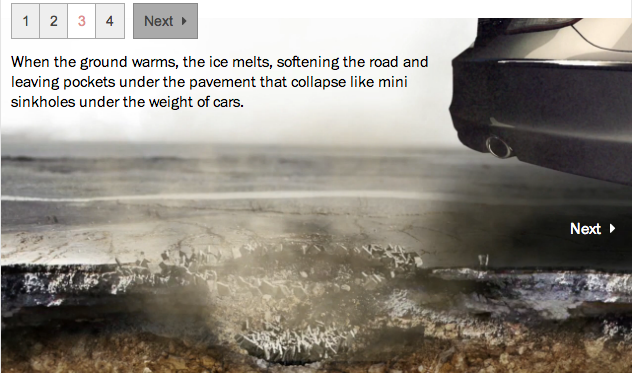
Today’s piece is from the Washington Post. However, it is less data visualisation and more of a neat little motion graphic explaining the formation of pot holes. Since it seems to be about that time of year when roads are destroyed by the things.
Credit for the piece goes to Sohail Al-Jamea and Bonnie Berkowitz.
Leave a Reply
You must be logged in to post a comment.