Rarely Shady in Philadelphia

After a rainy weekend in Philadelphia thanks to Hurricane Henri, we are bracing for another heat wave during the middle of this week. Of course when you swelter in the summer, you seek out shade. But as a recent article in the Philadelphia Inquirer pointed out, not all neighbourhoods have the same levels of tree cover, or canopy.

From a graphics standpoint, the article includes a really nice scatter plot that explores the relationship between coverage and median household income. It shows that income correlates best with lack of shade rather than race. But I want to focus on a screenshot of another set of graphics earlier on in the article.

On the other hand, pollen.

I enjoyed this graphic in particular. It starts with a “simple” map of tree coverage in Philadelphia and then overlays city zip codes atop that. Two zip codes in particular receive highlights with bolder and larger type.

Those two zip codes, presumably the minimum and maximum or otherwise broadly representative, then receive call outs directly below. Each includes an enlarged map and then the data points for tree cover, median income, and then Black/Latino percentage of the population.

I don’t think the median income needs to be in bar chart form here, especially given the bars do not line up so that you can easily compare the zip codes. The numbers would work well enough as factettes or perhaps a small dot plot with the zip codes highlighted could work instead.

Additionally, the data labels would be particularly redundant if a small scale were used instead. That would work especially well if the median income were moved to the lowest place in the table and the share charts were consolidated in one graphic. Conceptually, though, I enjoy the deep dive into those two zip codes.

Then I wanted to highlight some great design work on the maps. Note how in particular for Chestnut Hill, 19118, the outline of the zip code is largely in a thicker, black stroke than the rest of the map. At the upper right, however, you have two important roads that define the area and the black stroke breaks at those points so the roads can be clearly and well labelled. The other map does the same thing for two roads, but their breaks are shorter as the roads run perpendicular to the border.

Overall this was just a great piece to read and I thoroughly enjoyed the graphics.

Credit for the piece goes to John Duchneskie.

The Amazon Burns

The G7 conference in France wrapped up yesterday and they announced an aid package for Brazil. Why? Because satellite data from both Brazil and the United States points to a rash of fires devastating the Amazon rainforest, the world’s largest carbon sink, or sometimes known as the lungs of the Earth. I have not had time to check this statistic, but I read that 1/5 the world’s oxygen comes from the Amazon ecosystem. I imagine it is a large percentage given the area and the number of trees, but 20% seems high.

Regardless, it is on fire. Some is certainly caused by drier conditions and lightning strikes. But most is manmade. And so after the Brazilian president  Jair Bolsonaro said his country did not have the resources to fight the fires, the G7 offered aid.

This morning, Bolsonaro refused it.

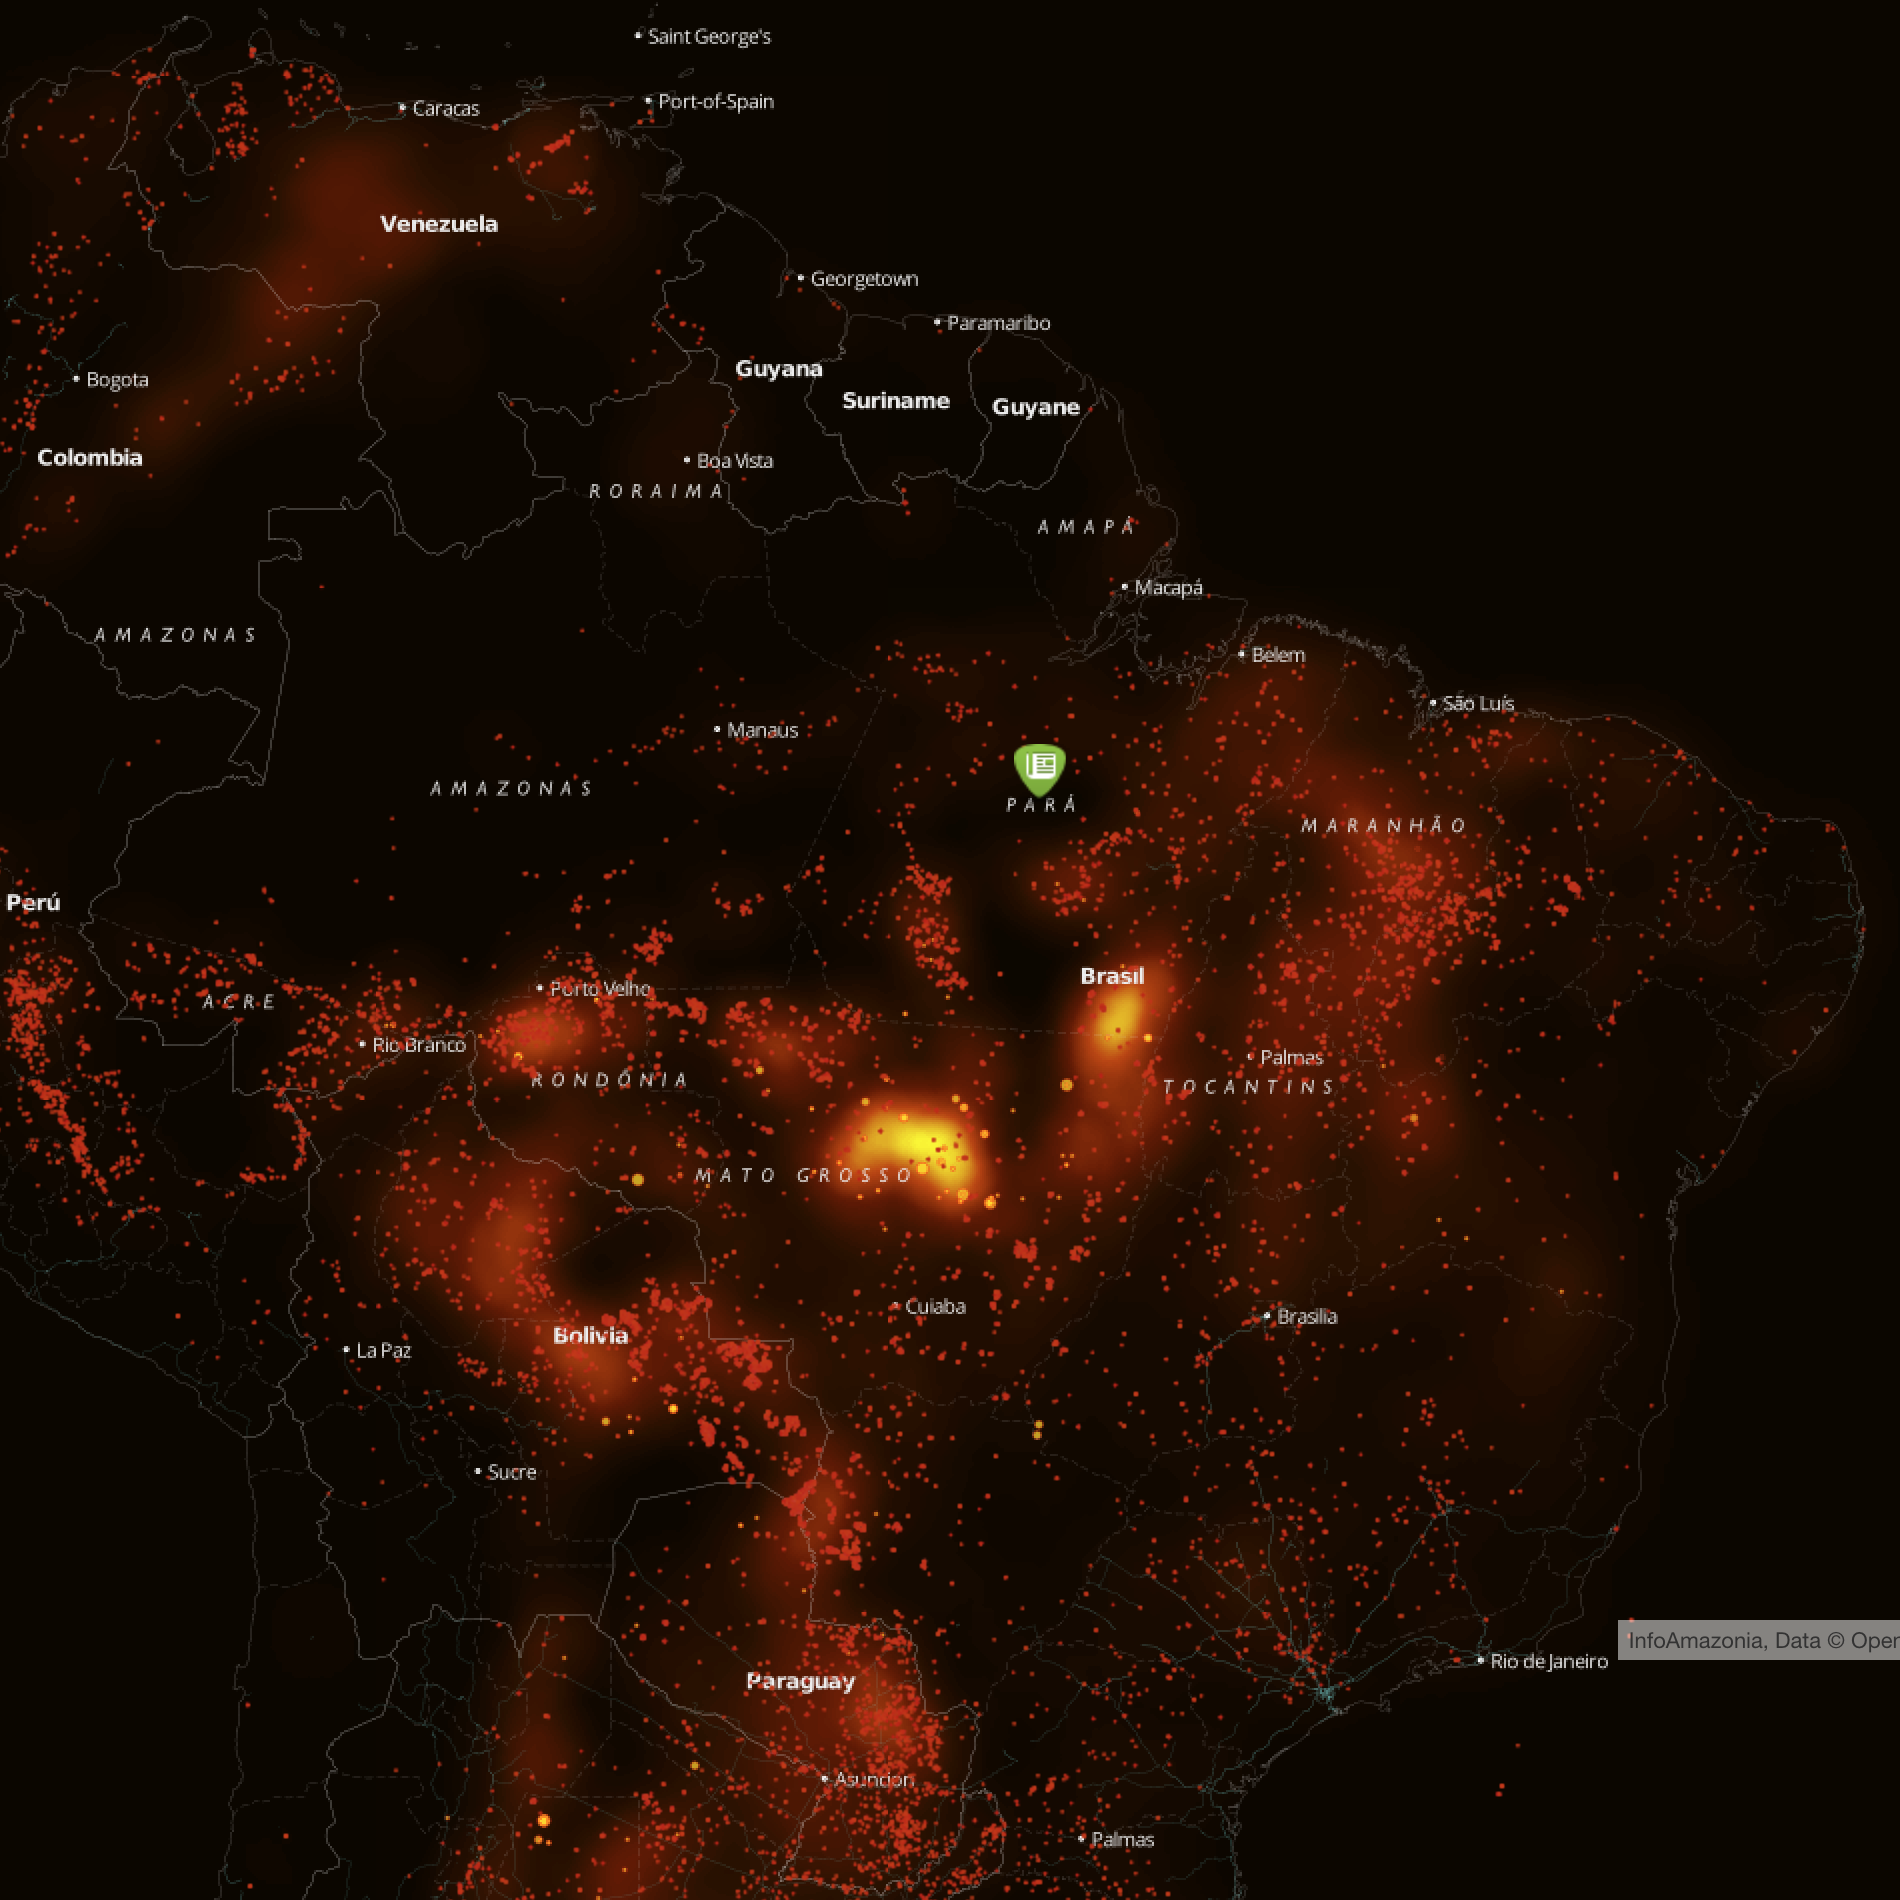
And so we have this map from InfoAmazonia that takes NASA data on observed fires for all of South America. I cropped my screencapture to Brazil.

You should also see the smoke maps

A key feature to note here, in addition to that black background approach, is that you will see three distinct features: yellow hotspots fading to cold black areas, yellow dots with red outlines, and red dots. Each means something different. The yellow to red to black gradient simply means frequency of fires, the yellow dots with red outlines represent significantly hot fires from 2002 through 2014. The red dots are what concern us. Those are fires within the last month.

Sure enough, we see lots of fires breaking out across the Amazon. And Bolsonaro not only rejected the aid, but a few weeks ago he rejected similar data. He fired the head of a government agency tasked with tracking the deforestation of the Amazon after he released the agency’s monthly report detailing the deforestation. It had risen by 39%.

From a design standpoint, it is a solid piece. I do wonder, however, if some kind of toggle for the three datasets could have been added. Given the focus on the new fires breaking out, isolating those compared to the historic fires would be useful.

But before wrapping up, I also want to point out that there are a significant number of red dots appearing outside Brazil. The Amazon exists beyond borders, and there are a significant number of fires in neighbouring Bolivia and Paraguay. Let alone around the world…

Credit for the piece goes to InfoAmazonia.org.

The Rise of the Tropic(al Plant)s

Last week I had three different discussions with people about some of the impact of climate change upon the United States. However, what did not really come up in those conversations was the environmental changes set to befall the United States. And by environment, I explicitly mean how the flora of the US will change.

Why? Well, as warmer climates spread north, that means tropical and subtropical plants can follow warmer temperatures northward into lands previously too cold. And they could replace the species native to those lands, who evolved adaptations for their particular climate.

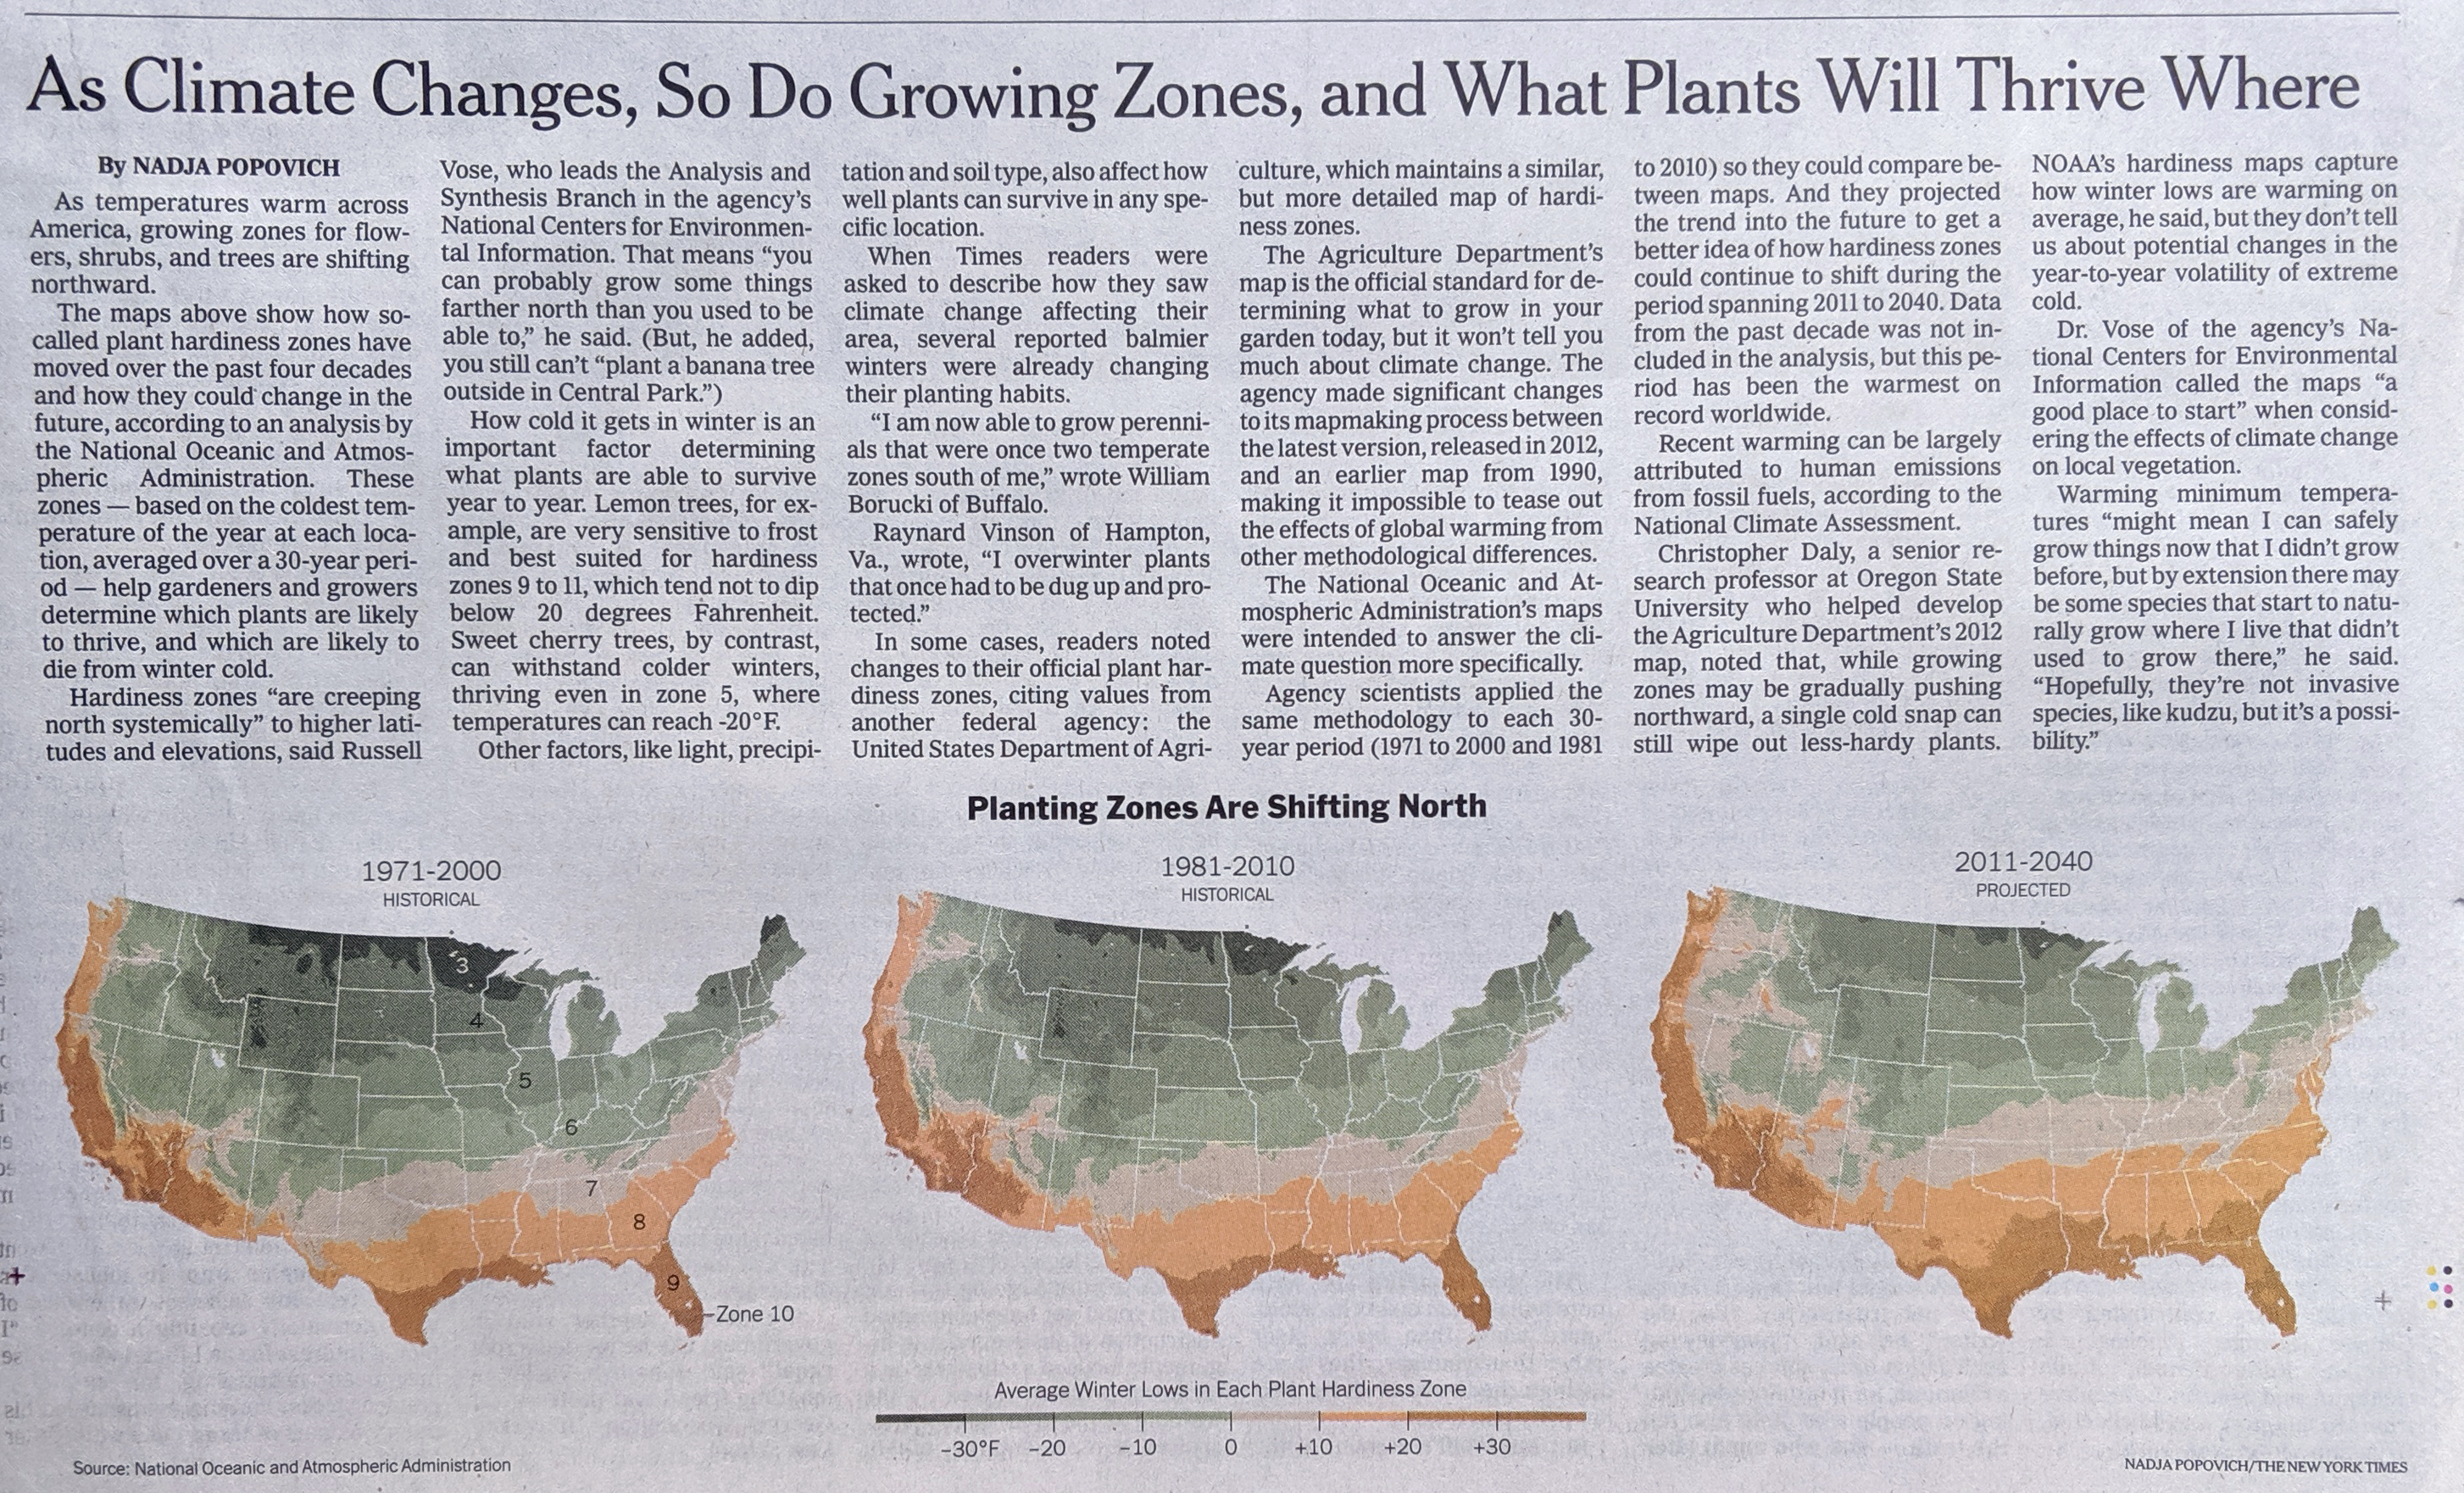
Thankfully, last week the New York Times published a piece that explored how those impacts could be felt. Hardiness zones are a concept designed to tell gardeners when and where to plant certain crops. And while the US Department of Agriculture has a detailed version useful to horticulturists, the National Oceanic and Atmospheric Administration produces a very similar version for the purpose of climate studies. And when you group those hardiness levels by the forecast lowest temperatures in an area, you get this.

More palm trees?
More palm trees?

There you have it, the forecast change to plant zones.

From a design standpoint, I like the idea of the colour shift here. However, where it breaks seems odd. Though it could be more influenced by the underlying classifications than I understand. The split occurs at 0ºF, which is well below freezing. I wonder if the freezing point, 32ºF could have been used instead. I also wonder if adding Celsius units above the same legend could be done to make the piece more accessible to a broader audience.

Otherwise, it’s a nice use of small multiples. And from the editorial design standpoint, I like how the article’s text above the graphic makes use of a six-column layout to add some dynamic contrast to what is essentially a three-column layout for the graphics.

They're living on a grid
They’re living on a grid

Credit for the piece goes to Nadja Popovich.

Carbon Taxes

Last week the New York Times published an article about carbon taxes, looking at their adoption around the world and their effectiveness. It is a fascinating article about how different countries have chosen to implement the broad policy idea and the various forms it can take. And, most importantly, how some of those policies can end up blunting the intended effect of carbon emission reduction.

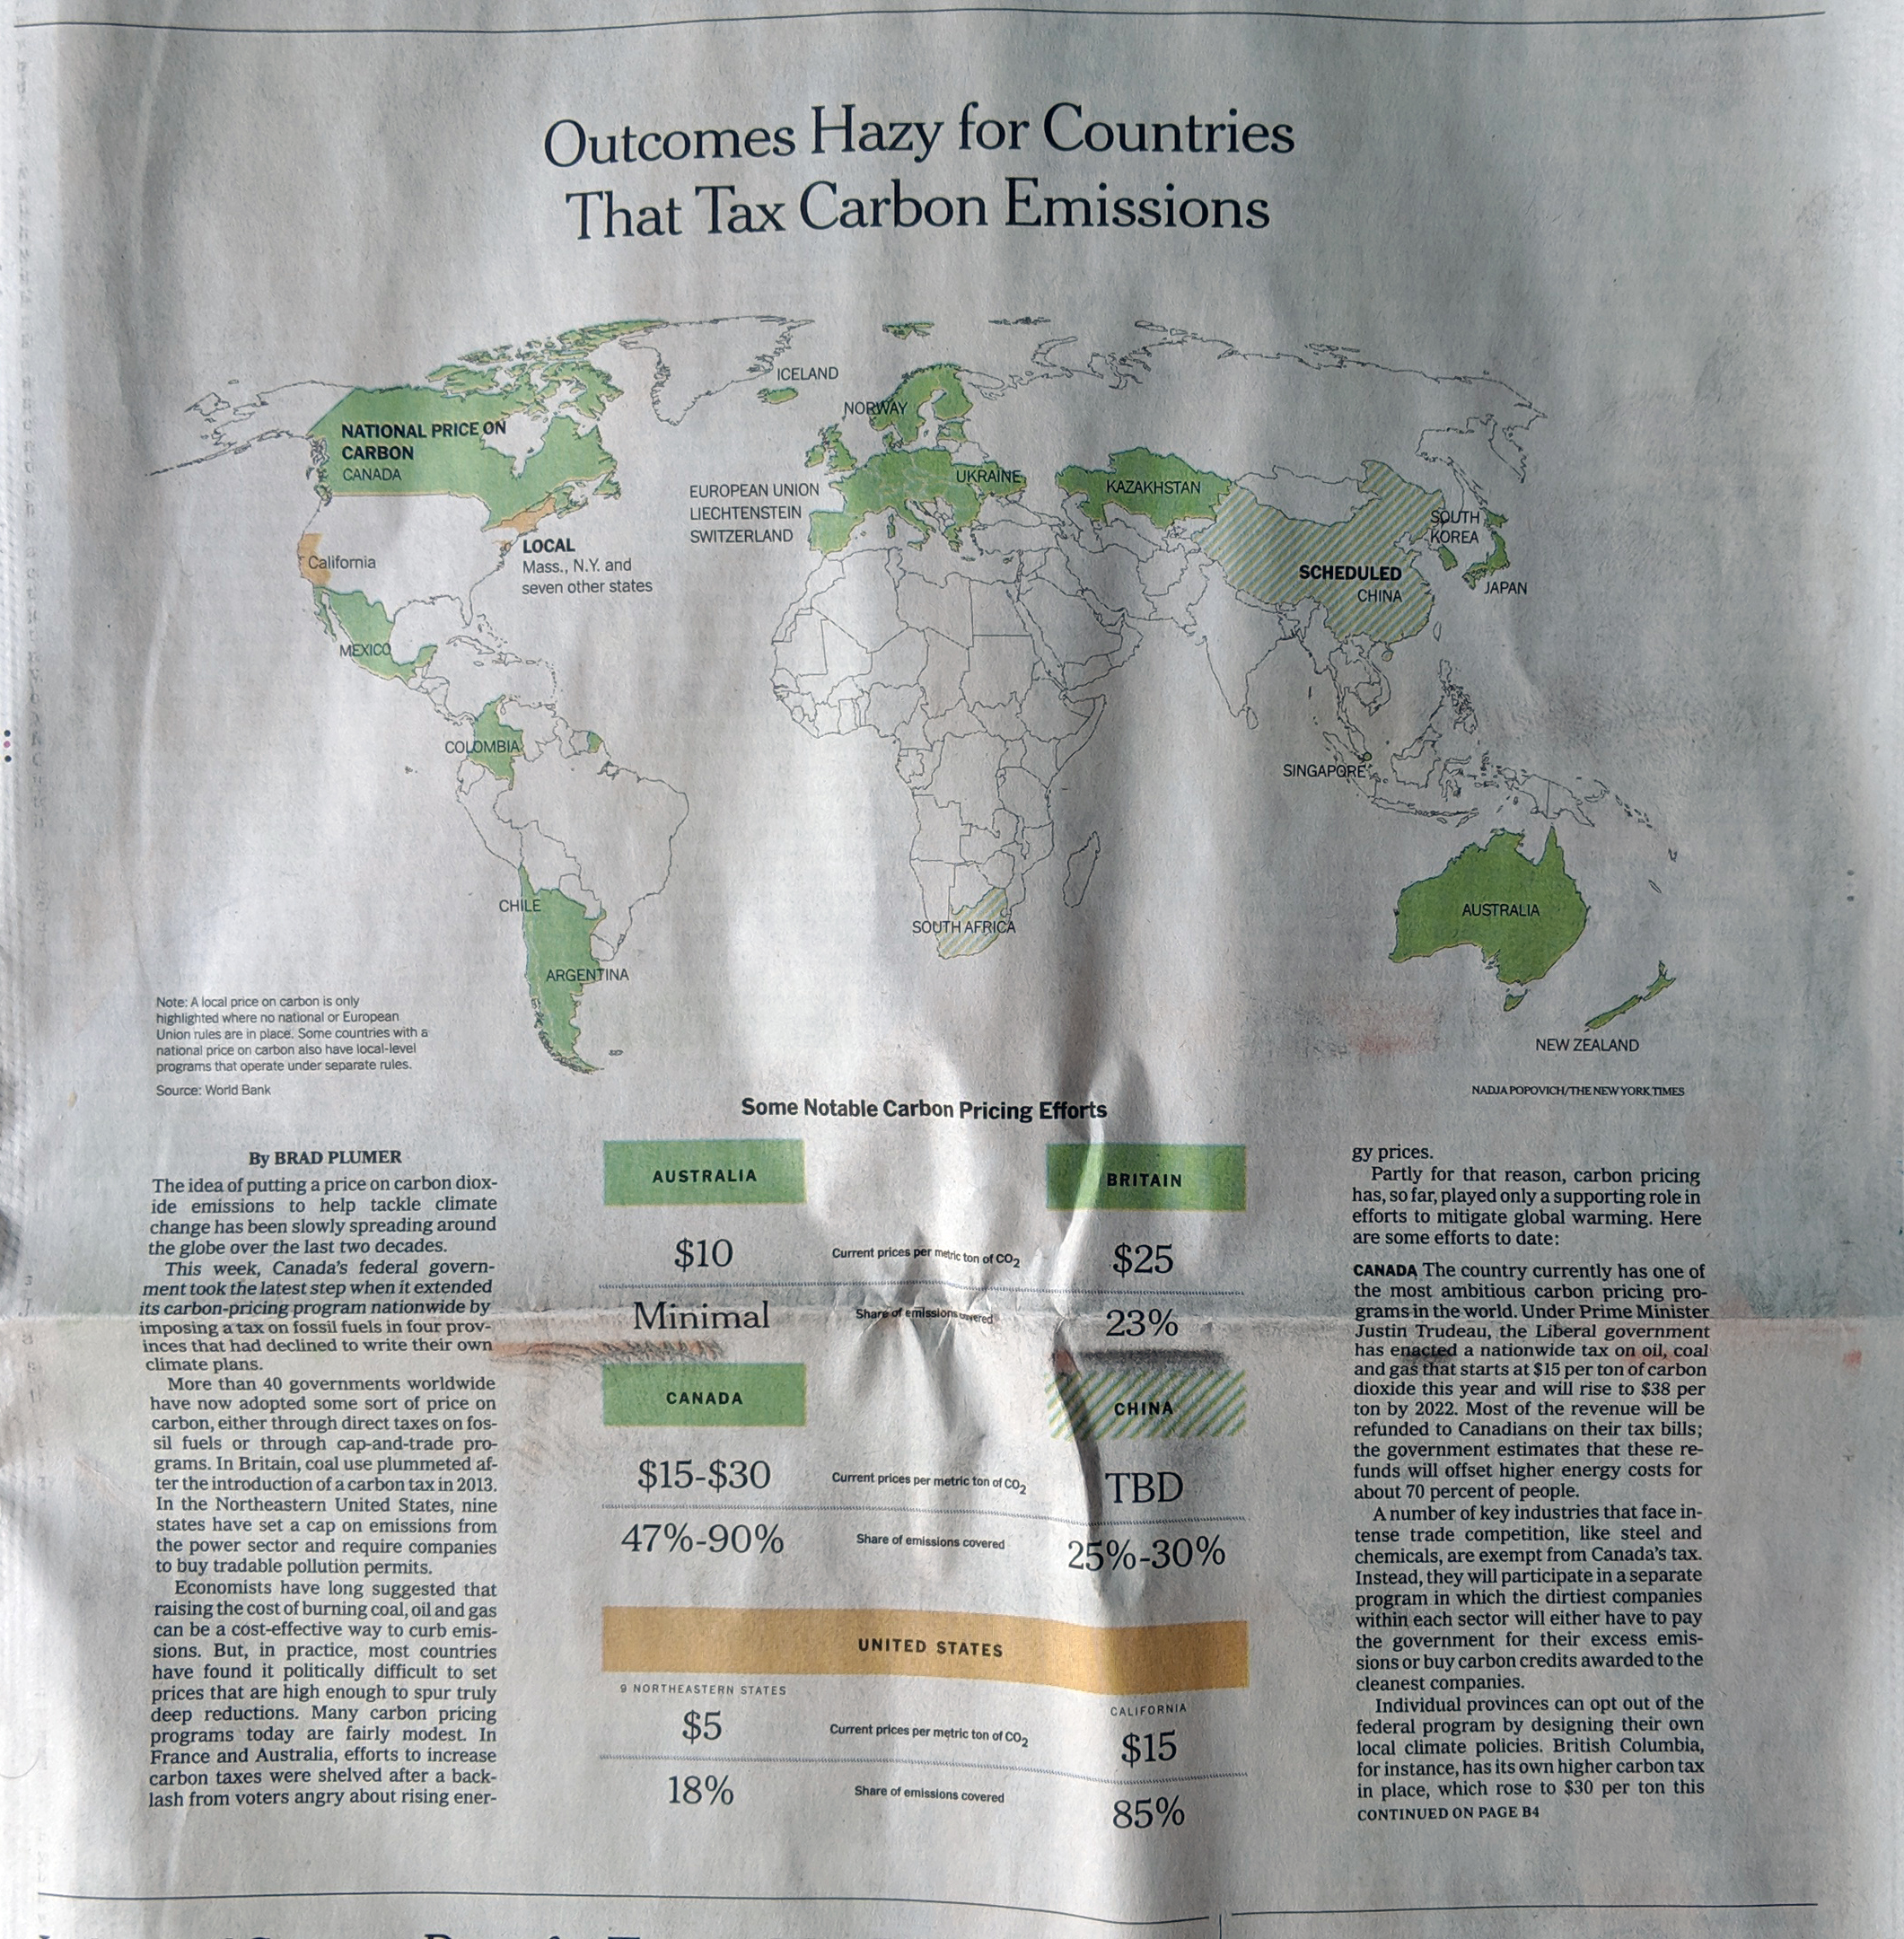
This, however, is about the print piece, because as I was flipping through the morning paper, I found the Business section had a world map above the fold. And we all know how I feel about big, splashy print graphics.

We could use some more green on this map

Here we have a pretty straight-forward piece. It uses a map to indicate which countries have adopted or are scheduled to adopt a carbon tax programme. The always interesting bit is how the federal system in the United States is represented. Whilst a carbon cap-and-trade deal failed in the US Senate in 2009, individual states have taken up the banner and begun to implement their own plans. Hence, the map shows the states in yellow.

There is nothing too crazy going on in the piece, but it is just a reminder that sometimes, as a designer, I love big splashy graphics to anchor an article.

Credit for the piece goes to Brad Plumer.

More on California’s Dry Heat

Yesterday we looked at the wildfire conditions in California. Today, we look at the Economist’s take, which brings an additional focus on the devastation of the fires themselves. However, it adds a more global perspective and looks at the worldwide decline in forest fires and both where and why that is the case.

California isn't looking too…hot. Too soon?
California isn’t looking too…hot. Too soon?

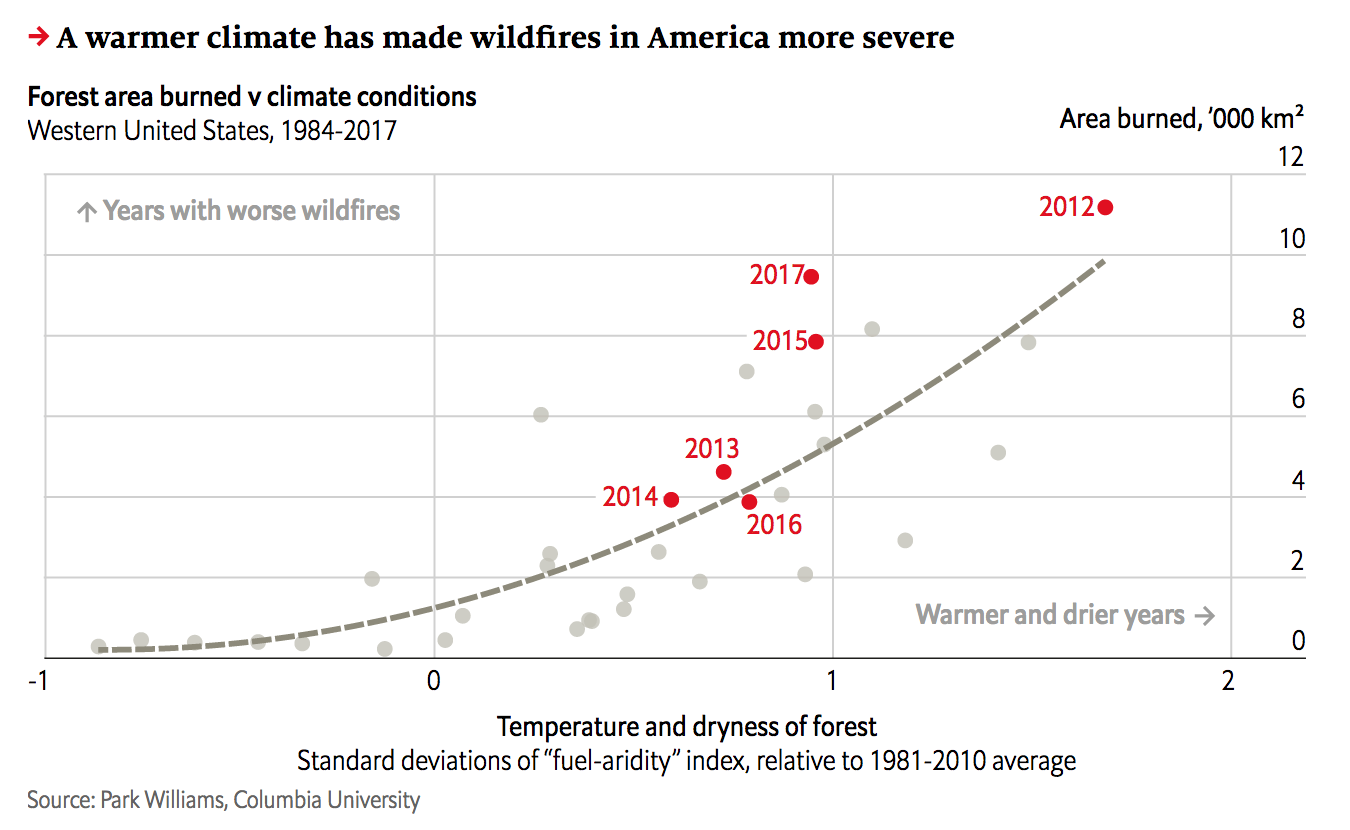
The screenshot here focuses on California and combines the heat and precipitation we looked at yesterday into a fuel-aridity index. That index’s actual meaning is simplified in the chart annotations that indicate “warmer and drier years” further along the x-axis. The y-index, by comparison, is a simpler plot of the acres burned in fires.

This piece examines more closely that link between fires and environmental conditions. But the result is the same, a warming and drying climate leaves California more vulnerable to wildfires. However, the focus of the piece, as I noted above, is actually on the global decline of wildfires.

Only 2% of wildfires are actually in North America, the bulk occur in Africa. And the piece uses a nice map to show just where those fires occur. In parallel the text explains how changing economic conditions in those areas are lessening the risk of wildfire and so we are seeing a global decline—even with climate change.

Taken with yesterday’s piece with its hyper-California focus, this provides a more global context of the problem of wildfires. It’s a good one-two read.

Credit for the piece goes to the Economist Data Team.

Dry Heat Is Only Part of California’s Problem

Wildfires continue to burn across in California. One, the Camp Fire in northern California near Chico, has already claimed 77 lives. But why has this fire been so deadly?

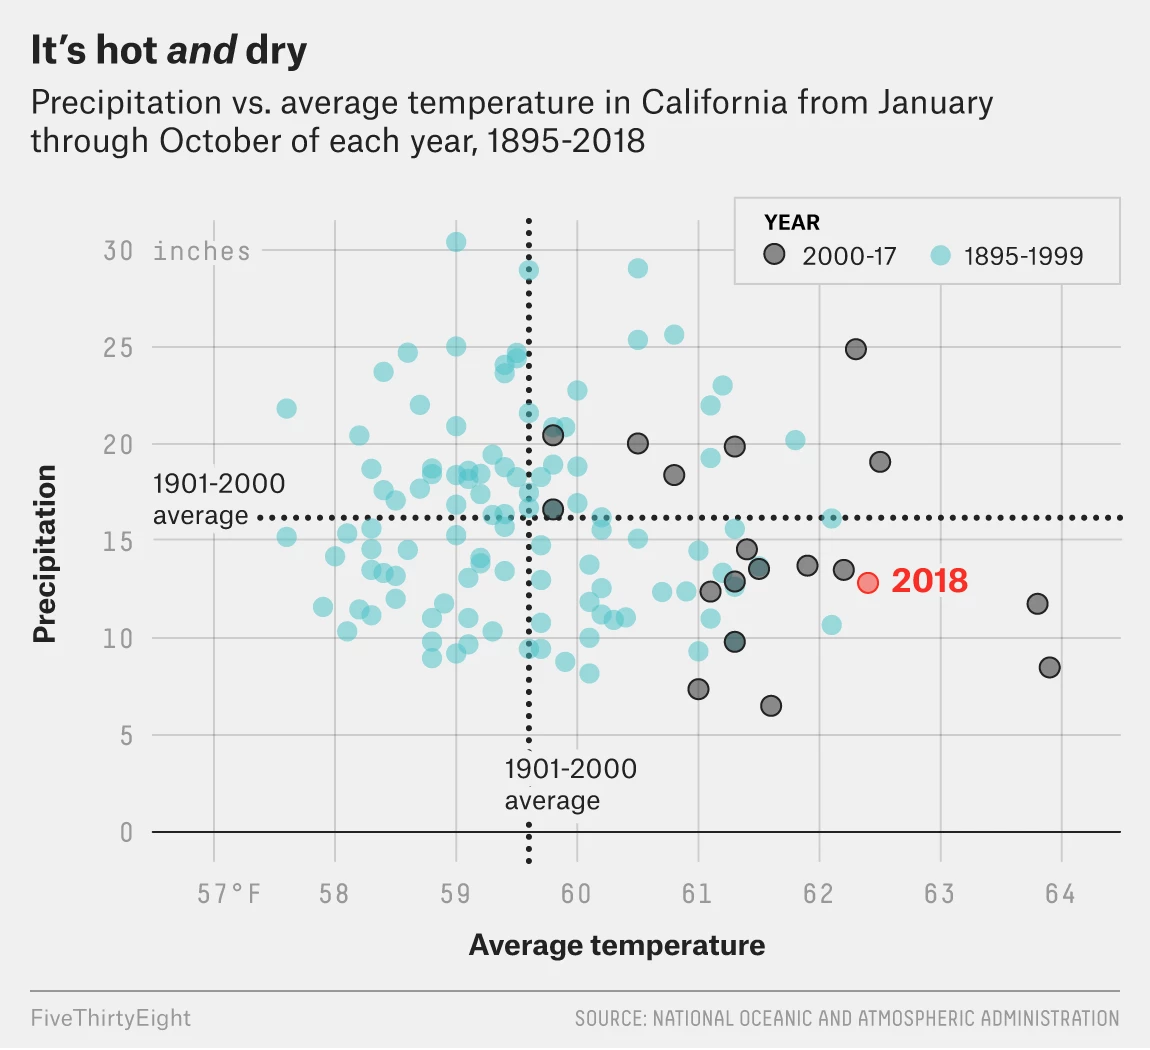
FiveThirtyEight explained some of the causes in an article that features a number of charts and graphics. The screenshot below features a scatter plot looking at the temperature and precipitation recorded from winter through autumn every year since 1895.

The evolving California climate

The designers did a good job of highlighting the most recent data, separating out 2000 through 2017 with the 2018 data highlighted in a third separate colour. But the really nice part of the chart is the benchmarking done to call out the historic average. Those dotted lines show how over the last nearly two decades, California’s climate has warmed. However, precipitation amounts vary. (Although they have more often tended to be below the long-term average.)

I may have included some annotation in the four quadrants to indicate things like “hotter and drier” or “cooler and wetter”, but I am not convinced they are necessary here. With more esoteric variables on the x- and y-axis they would more likely be helpful than not.

The rest of the piece makes use of a standard fare line chart and then a few maps. Overall, a solid piece to start the week.

Credit for the piece goes to Christie Aschwanden, Anna Maria Barry-Jester, Maggie Koerth-Baker and Ella Koeze.

Arctic Sea Ice Levels Continue to Decline

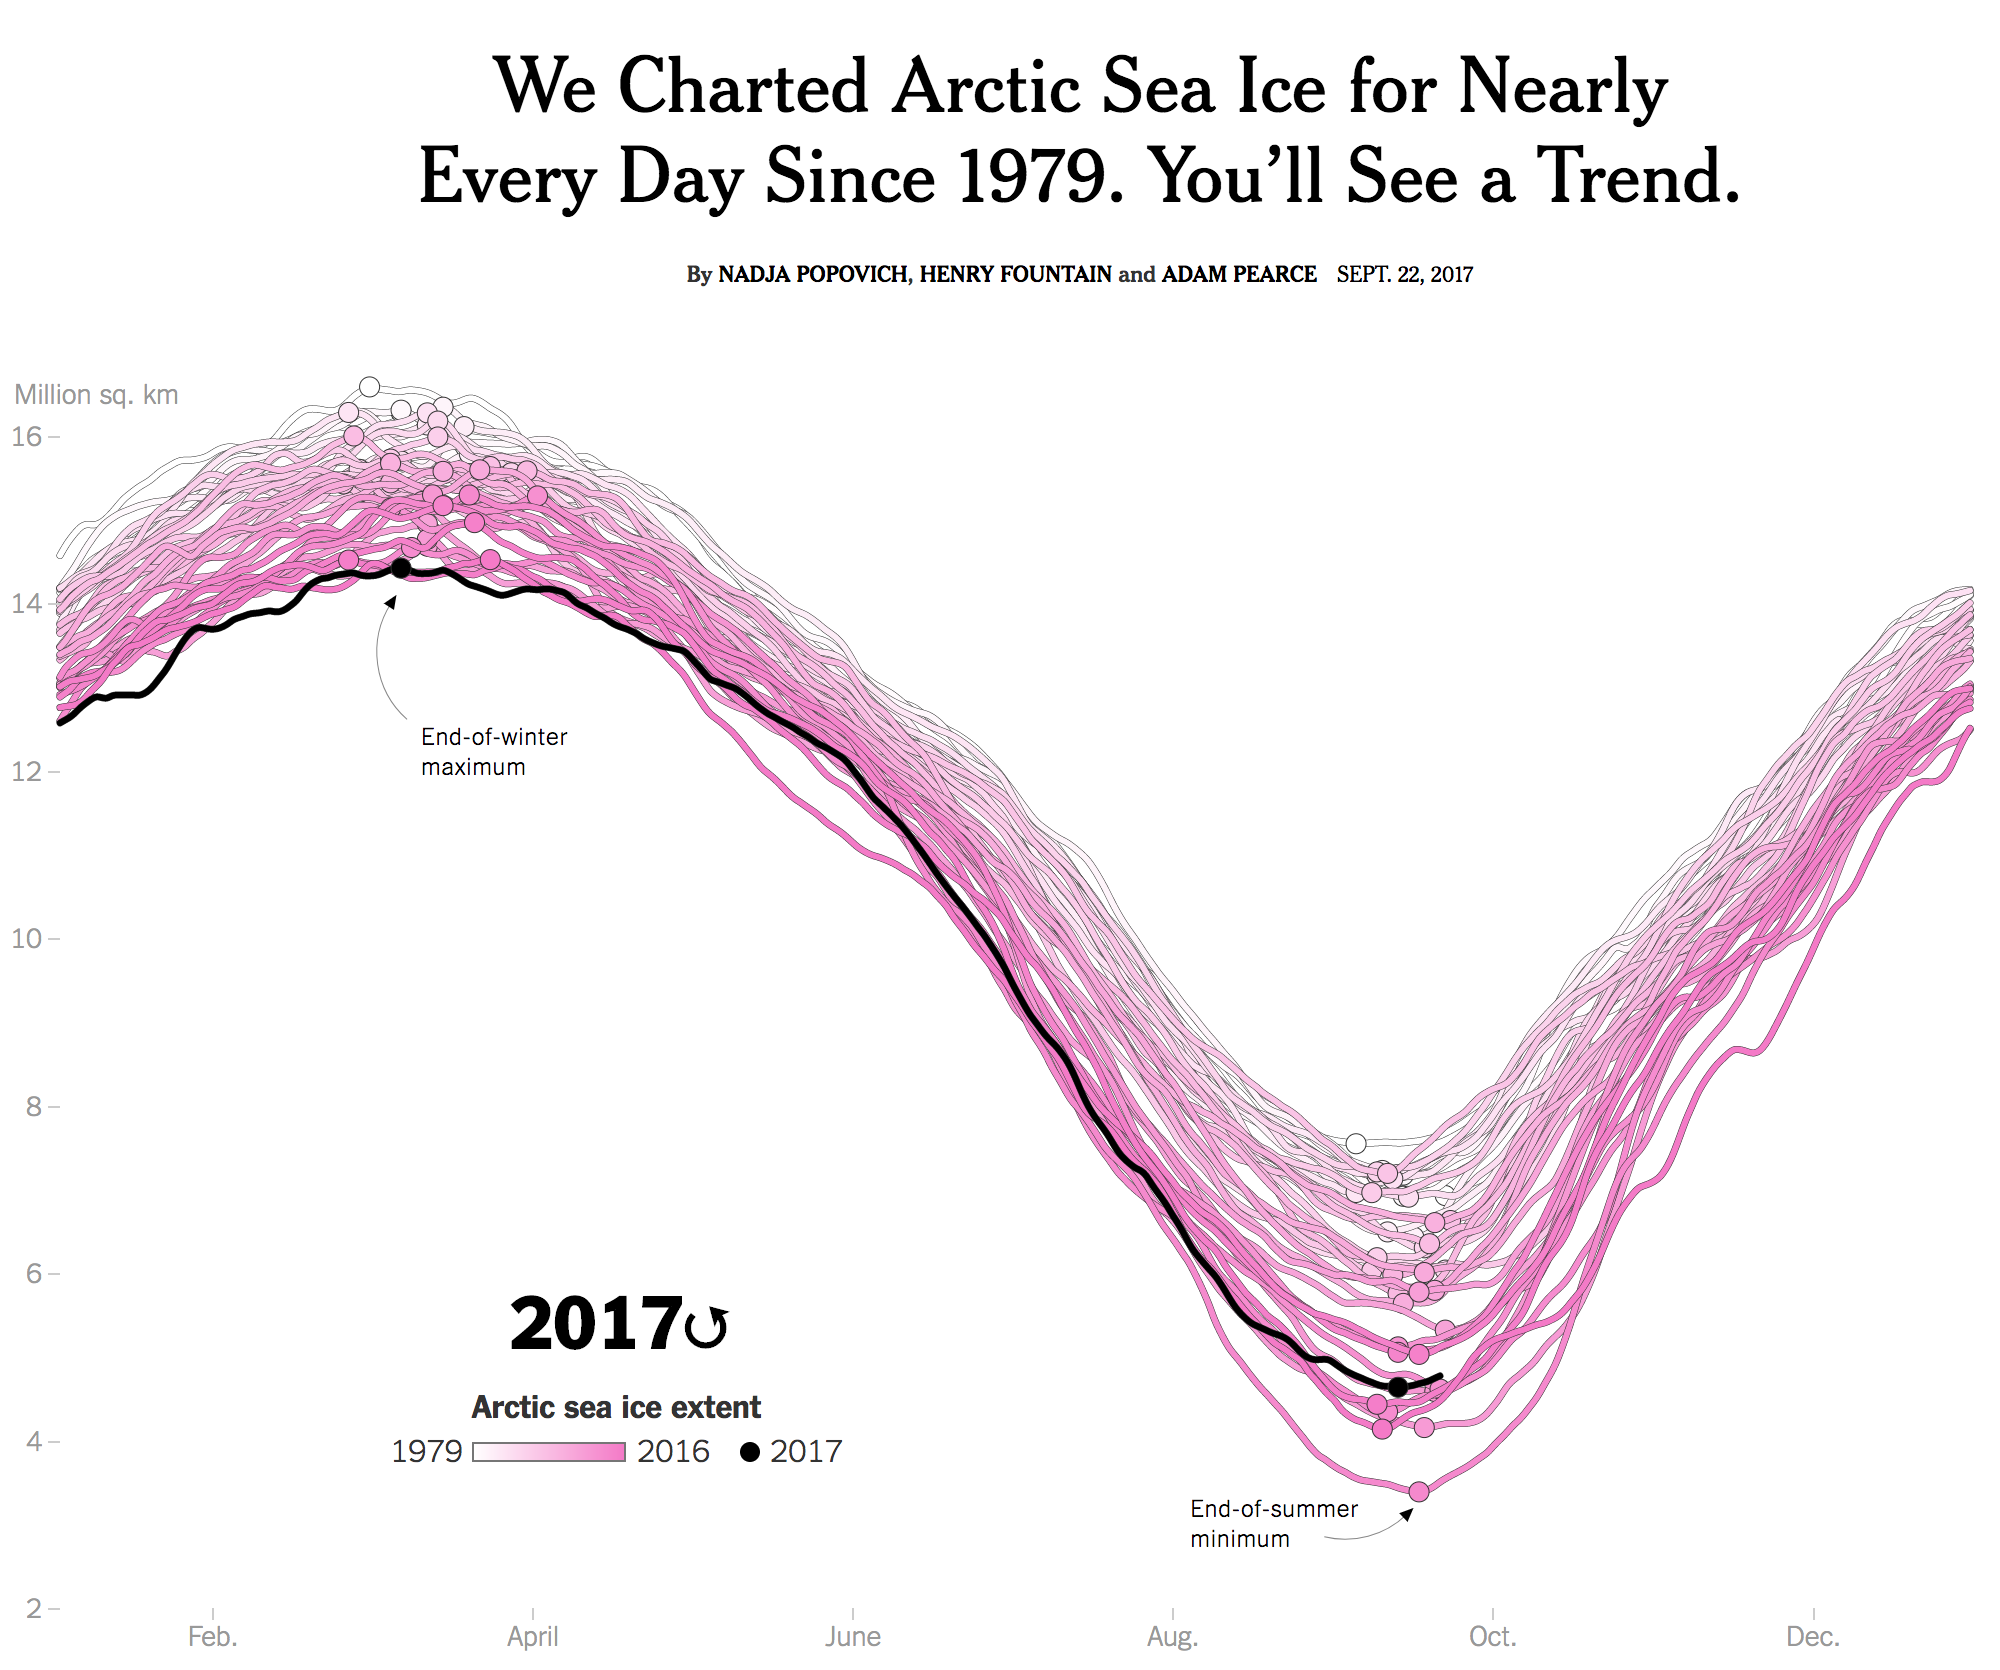
You may recall how over two years ago I posted about a piece from the New York Times that explored the levels of Arctic sea ice. It showed how the winter sea ice of 2015 was the lowest level ever recorded. Well last week the Times updated that piece with new data. And instead of the static graphic we enjoyed last time around, this time the piece began with a nice animation. It really helps you see the pattern, so you should click through and check out the whole piece.

Go hit play and you'll see the trend
Go hit play and you’ll see the trend

But this isn’t just a visually top heavy piece. No, the remainder of the article continues to explore the state of Arctic sea ice through a number of other charts and maps.

Credit for the piece goes to Nadja Popovich, Henry Fountain, and Adam Pearce.

Alaskan (im)Permafrost

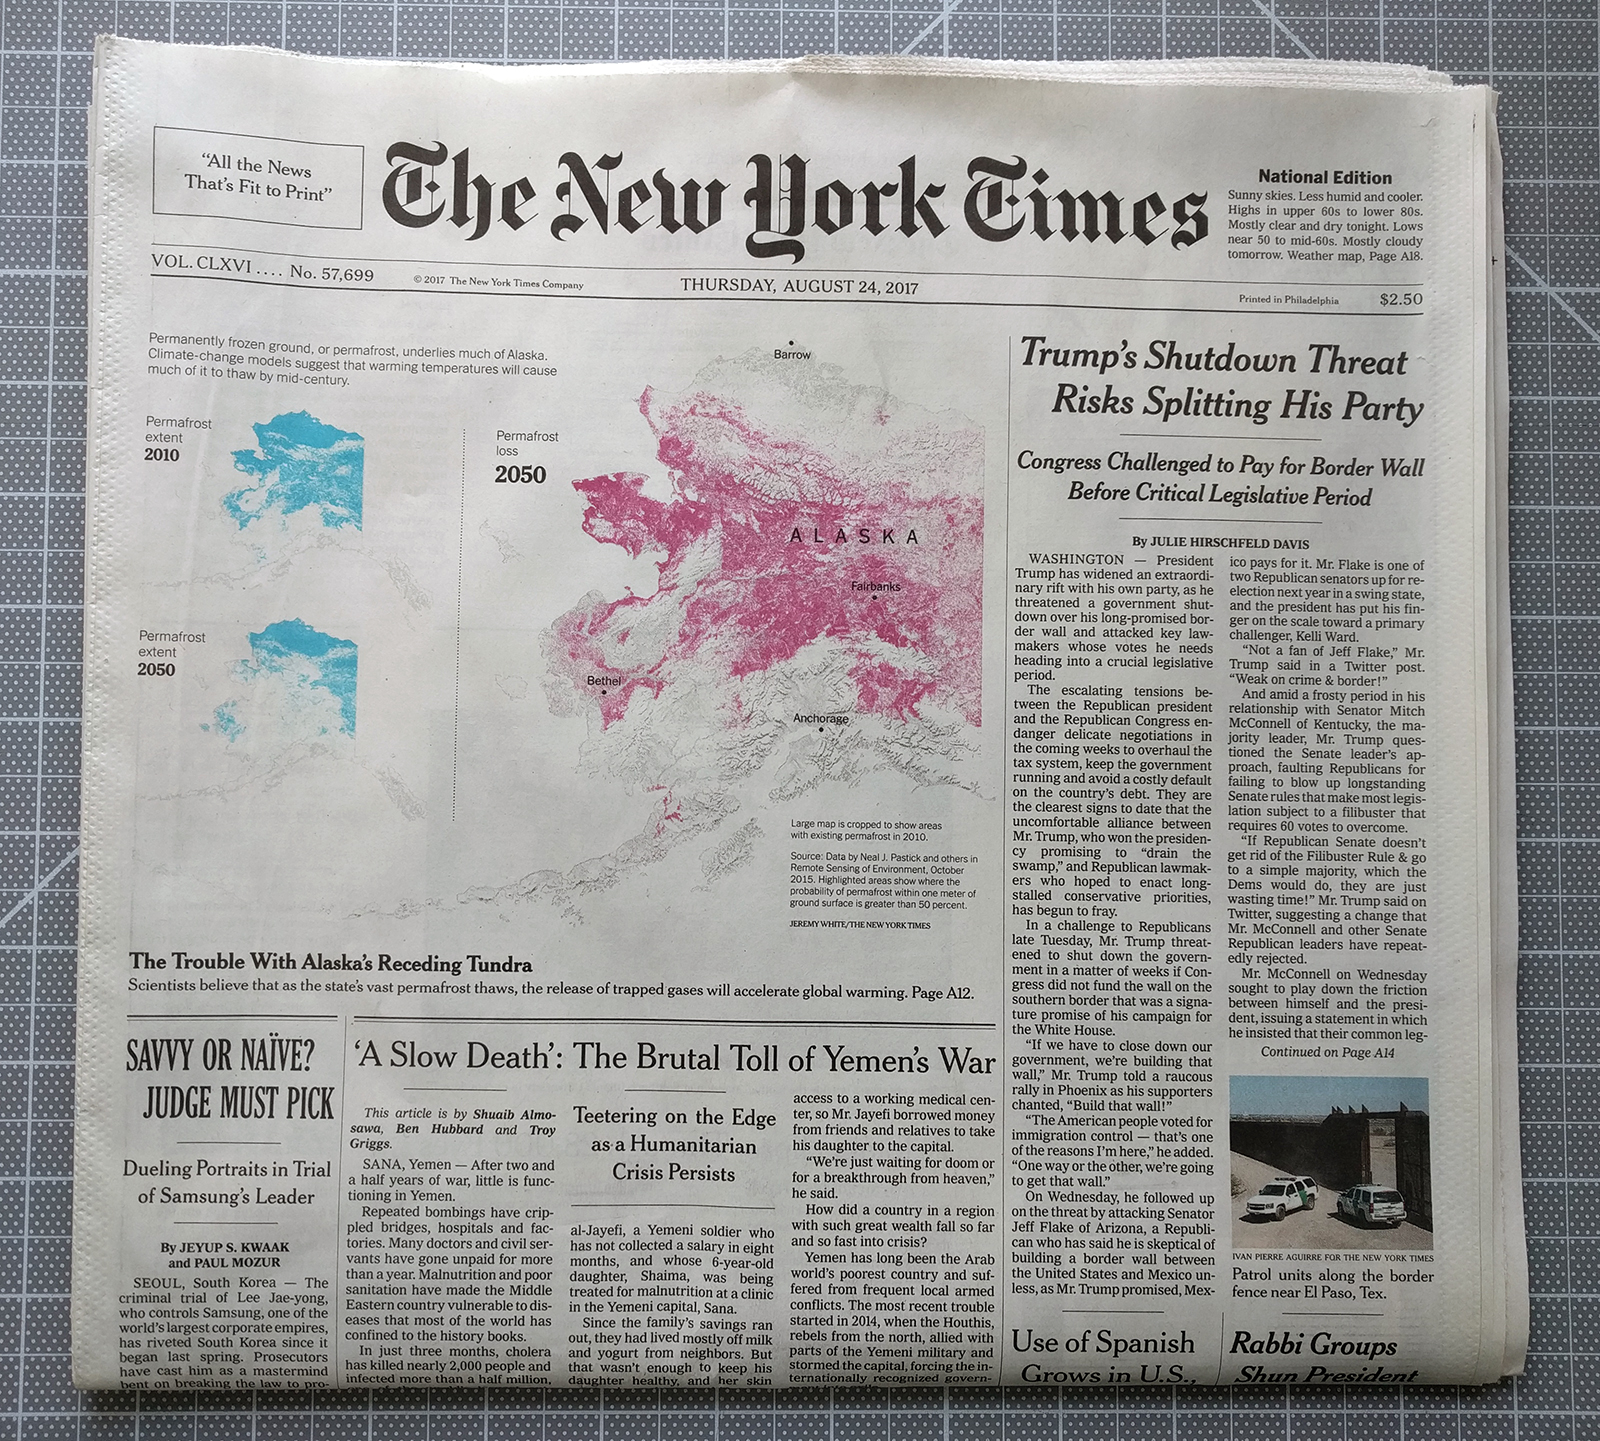
I woke up this morning and before breakfast I opened the door to bring in today’s edition of the New York Times. I enjoy reading the paper, or at least a few articles, over breakfast (and more often than not preparing a post for here at Coffeespoons.me). Some of the best days are when I open the door and find a giant piece of data visualisation there above the fold. Other images, for example the other day’s eclipse coverage, also strike me, but as someone who visualises data as part of his career, I particularly enjoy things like maps. (I should point out I also do editorial design, so things like this layout are even closer to the intersection of my interests.)

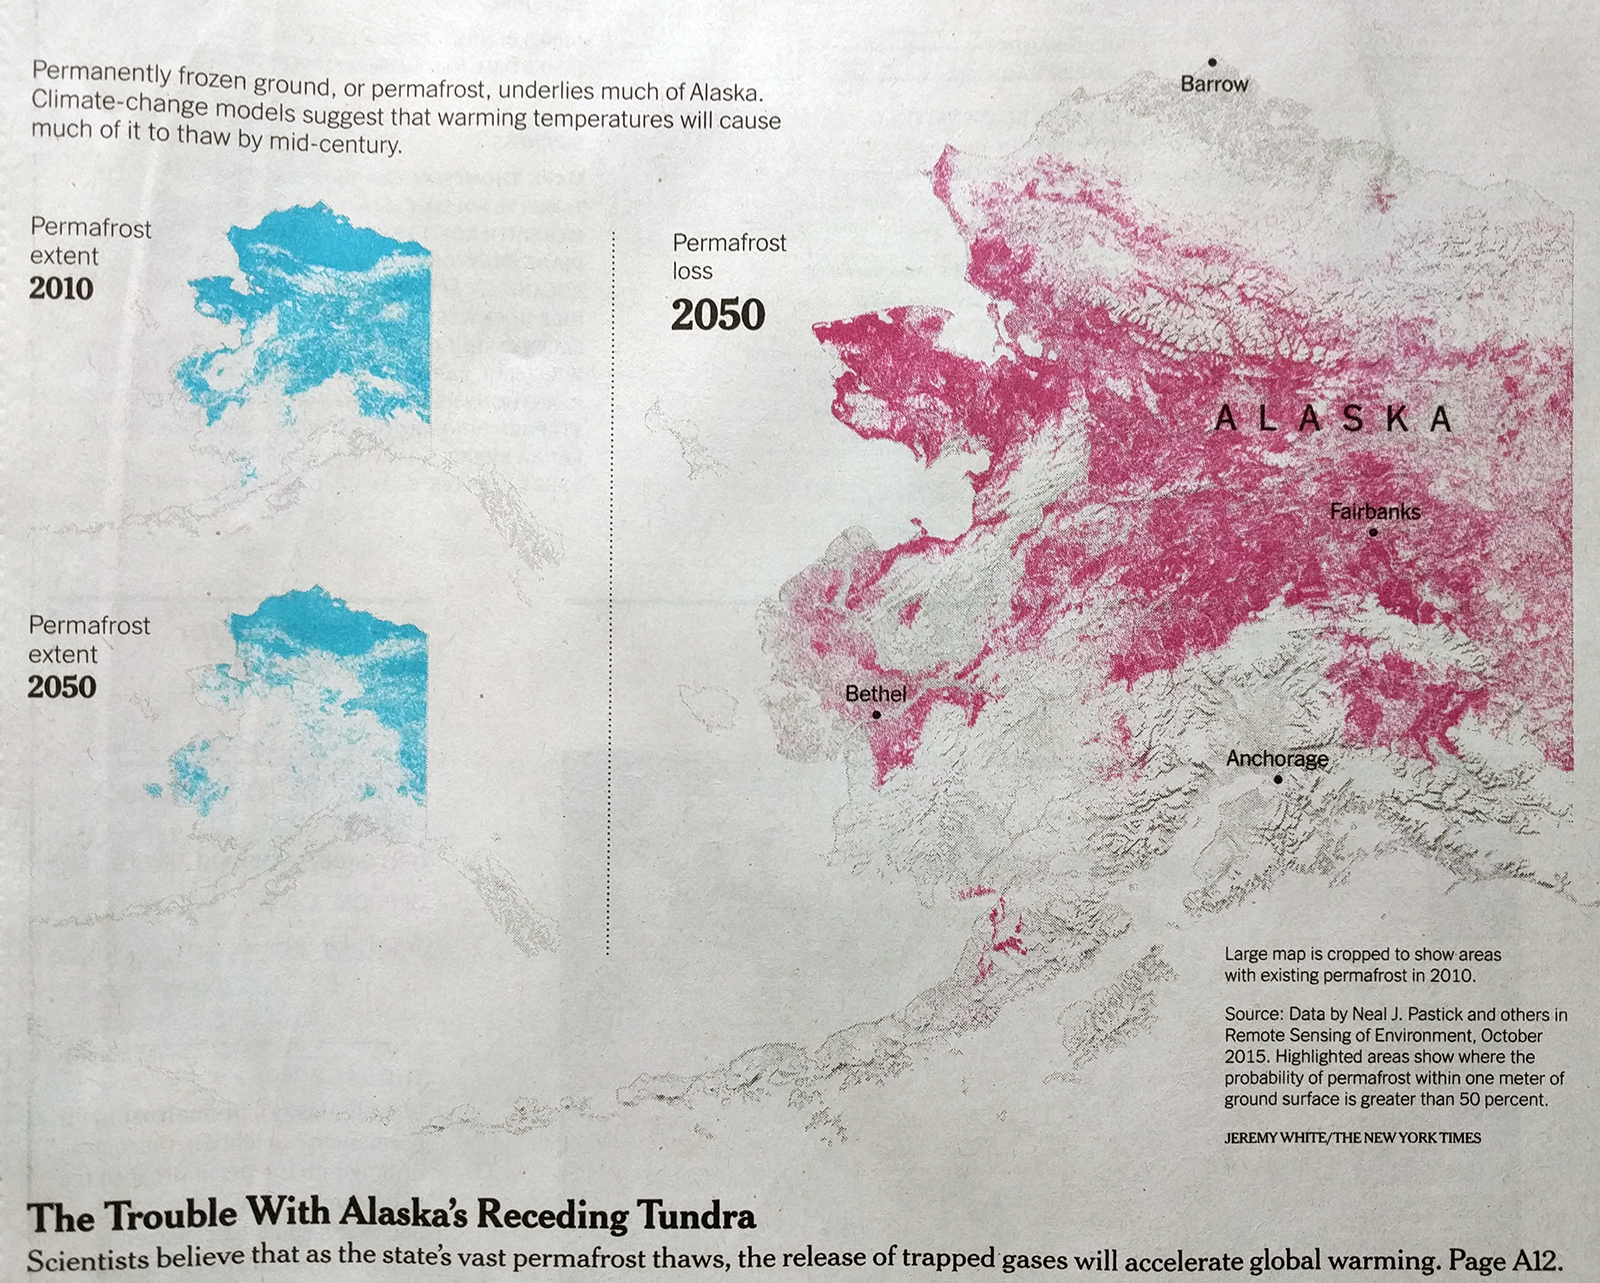
Lo and behold, this morning I opened the door and we had the shrinking permafrost of Alaska this morning.

Now that is basically it. I have a crop of the map at the end here, but the map was the extent of the data visualisation in the article. Indeed, other articles in today’s edition carried more interesting graphics—I took photos to hopefully circle back—but the nerd I am, I really do get a kick finding a paper like this in the morning.

The graphic itself occupies half the space above the fold and the bright cyan and magenta steal the user’s attention. Even the headlines of the other articles recede behind the Alaska maps.

White space around the maps subtly helps focus attention on the piece. To be fair, the shape of Alaska with its archipelagos and bays along with the southeast extension help to create that space. A more squarish shape, say Colorado, would not quite have the same effect.

If I had to critique anything, I might have placed the city labels, especially Fairbanks, and the state label elsewhere to enhance their legibility. But at that point, I’m really just quibbling around the edges.

Red means it's warming up
Red means it’s warming up

Credit for the piece goes to Jeremy White.

Piece, Larsen C

When I was in high school in 2002, it was big news when one of the three Larsen ice shelves in Antarctica, Larsen B, collapsed. And then when I was at university, the band British Sea Power wrote a song titled “Oh Larsen B” that I have always enjoyed.

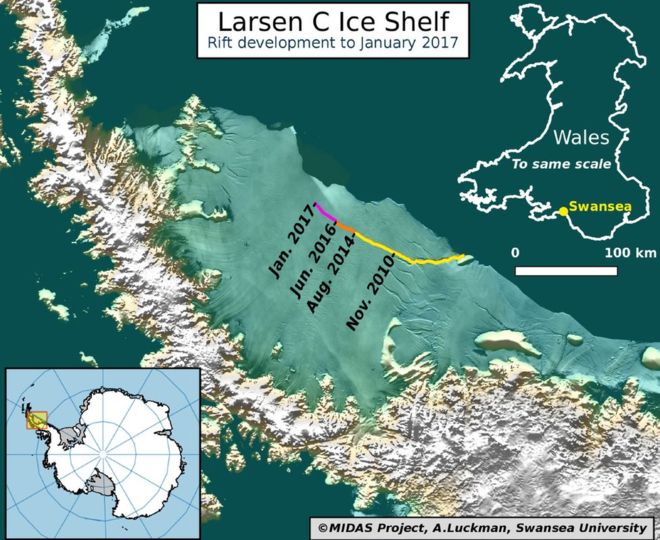
Now Larsen B was not the first Larsen ice shelf to collapse. That dubious honour belongs to Larsen A, which collapsed in 1995. But, Larsen B will not be the last as the third, Larsen C, is now on the verge of collapse. This graphic from Adrian Luckman, reproduced by the BBC, illustrates how the rift calving the shelf has seen accelerated growth recently.

The rift's growth has accelerated lately
The rift’s growth has accelerated lately

I believe the colours could have been designed a bit better to show more of the acceleration. The purple fades too far into the background and the yellow stands out too much. I would be curious if the data existed to create a chart showing the acceleration.

The inclusion of the map of Wales works well for showing the scale, especially for British audiences. In other words, an iceberg 1/4 the size of Wales will be released into the Southern Ocean. For those not well versed in British geography, that means an iceberg larger than the size of Delaware. That’s a big iceberg.

Credit for the piece goes to Adrian Luckman.

Climate Change

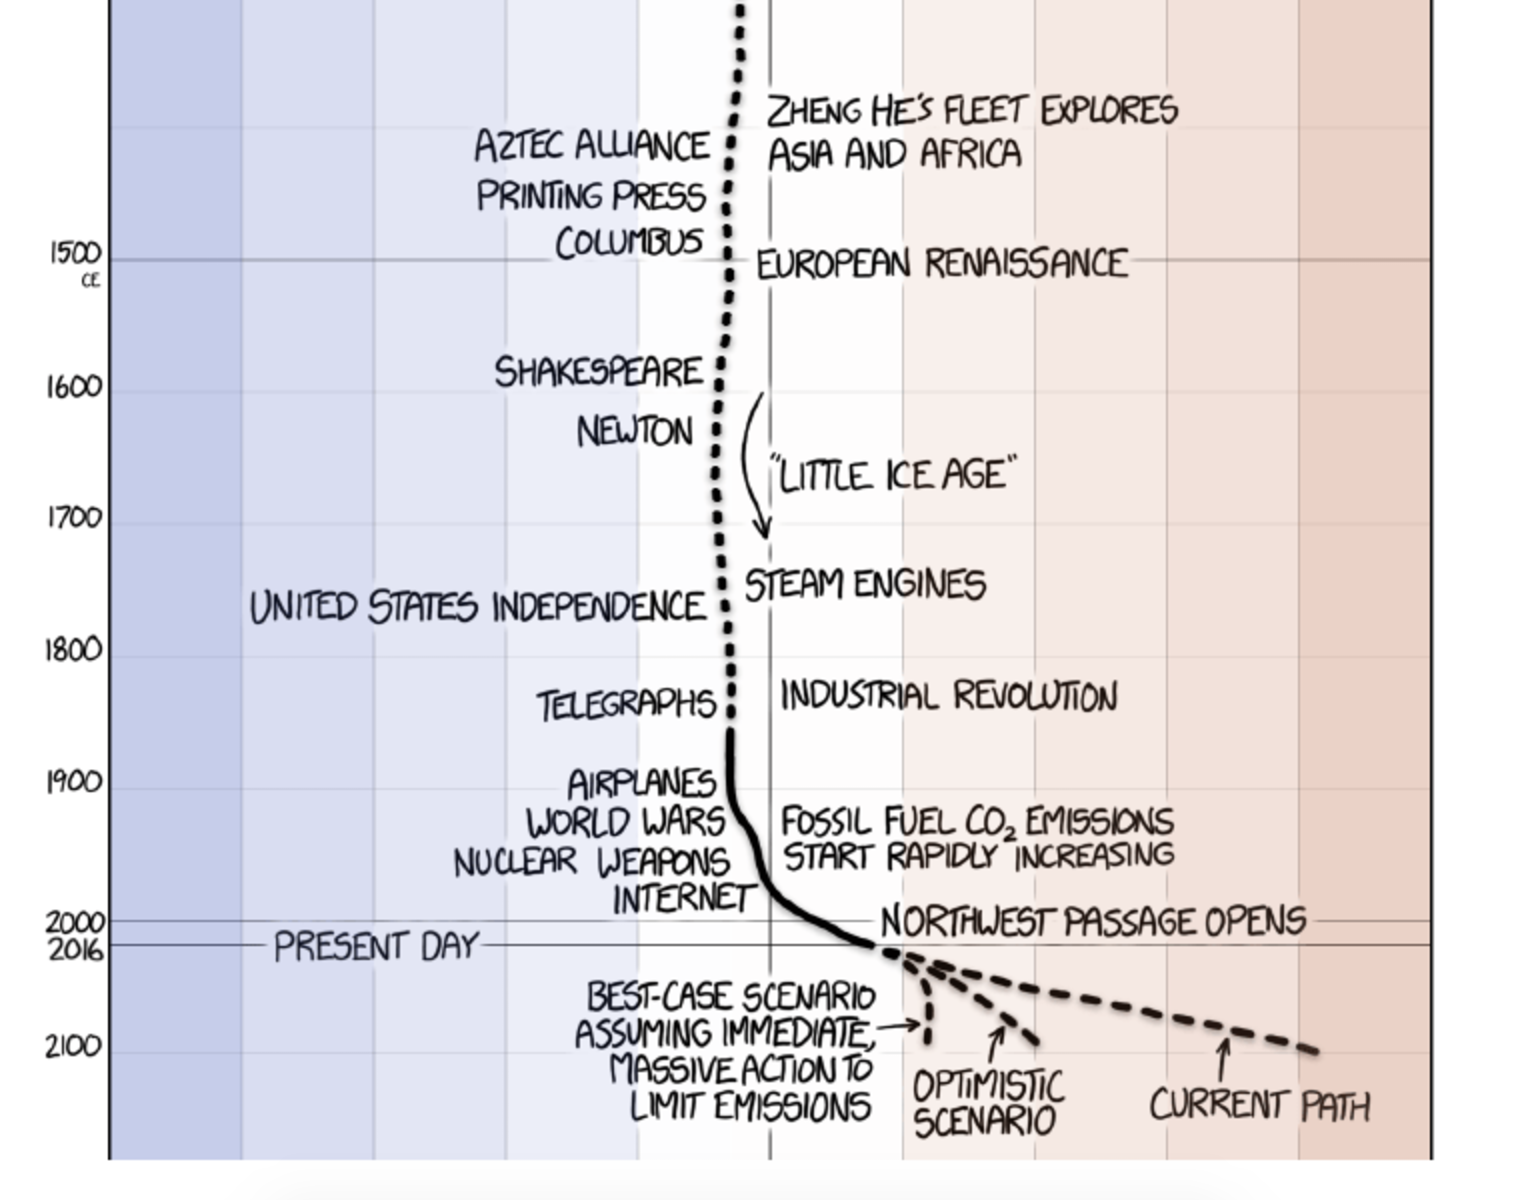
So this is the last Friday before the election next Tuesday. Normally I reserve Fridays for less serious topics. And often xkcd does a great job covering that for me. But because of the election, I want today’s to be a bit more serious. Thankfully, we still have xkcd for that.

Recent temperature history

The screenshot above gets to the point. But the whole piece is worth a scroll-through and so it goes at the end. Credit for the piece goes to Randall Munroe.

Earth's global average temperature
Earth’s global average temperature