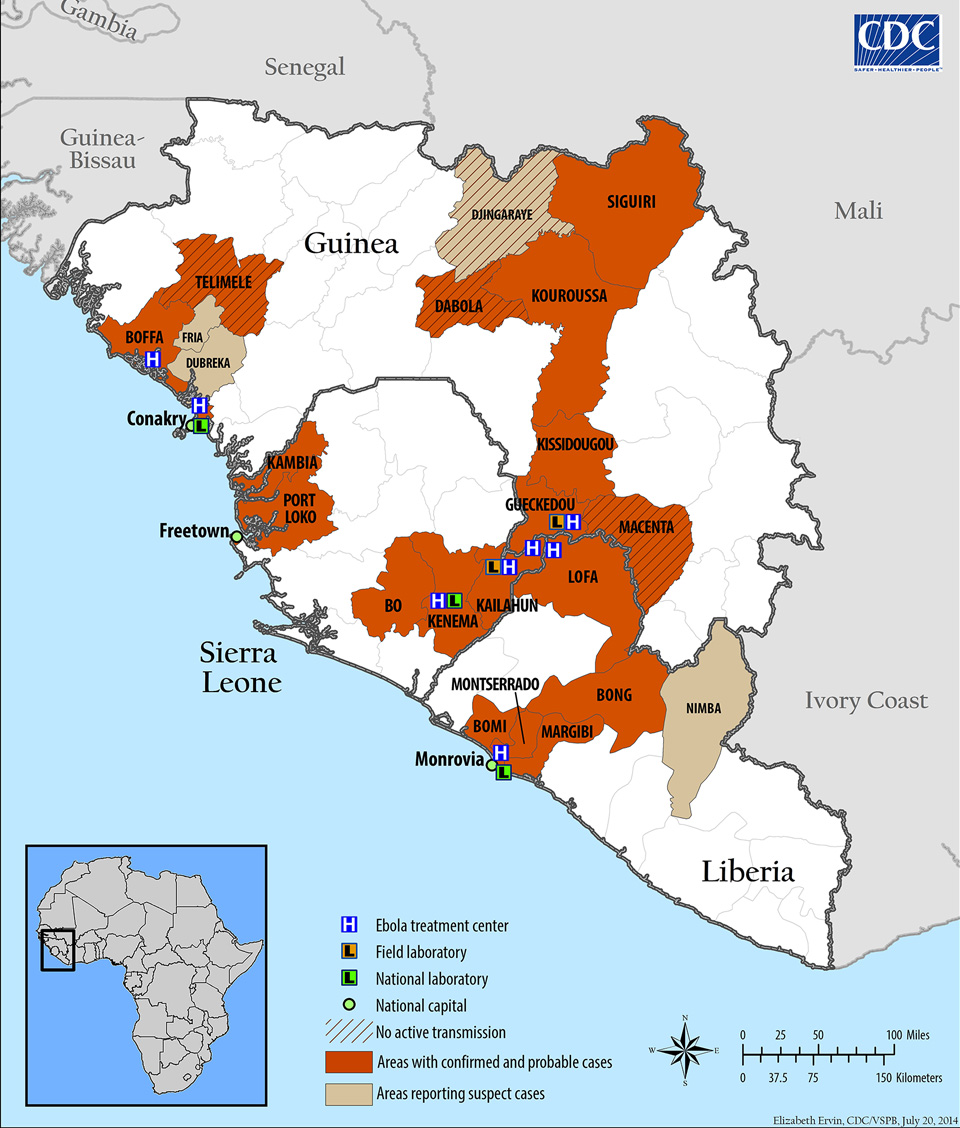
If you haven’t heard, there is a fairly significant outbreak of Ebola occurring in western Africa these days. The most attention has been drawn since the death of an American national in Nigeria. He had been working for the Liberian government and collapsed at the Lagos airport and died shortly thereafter. So the Centers for Disease Control has been reporting and advising on the outbreak and they have at least two graphics.
This first is good. It looks at the spread of the disease through different areas of several countries. It also identifies sites of interest for treating/containing the outbreak.

The second, however, takes prominence as an “infographic” on the CDC homepage. How this qualifies as an infographic I have no idea. It is…just sad. I mean I get it, too many people do not understand how Ebola is transmitted. But to call this an infographic does disservice to other, real infographics.

Credit for the map goes to Elizabeth Ervin. For the “infographic”, no idea.
